Fig. A.1
Download original image
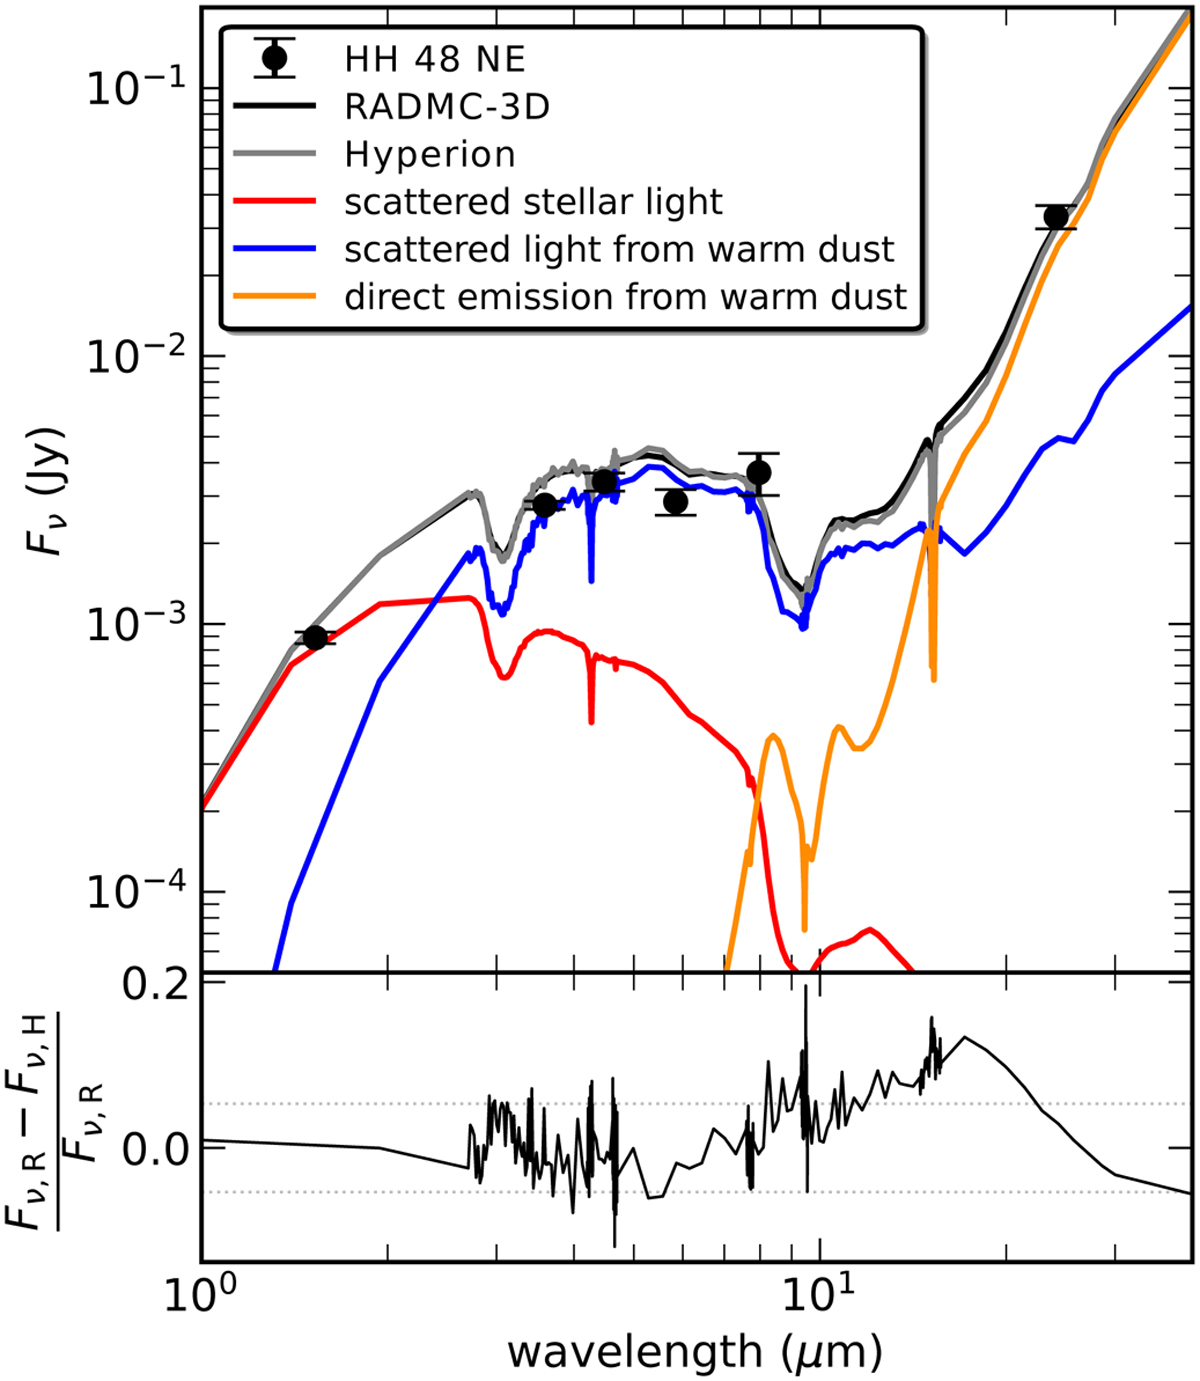
Comparison between ray-traced spectra by RADMC-3D and Hyperion. The top panel shows the SEDs for Hyperion and RADMC-3D. The colored lines show the contribution to the total spectrum of scattered stellar light (red), scattered light from warm dust (blue), and direct light from warm dust (orange). The direct stellar light component is negligible and is therefore not shown in this plot. The bottom panel shows the normalized difference between the two total outputs of the two codes. The dashed lines indicates the standard deviation of the difference, which is 5%.
Current usage metrics show cumulative count of Article Views (full-text article views including HTML views, PDF and ePub downloads, according to the available data) and Abstracts Views on Vision4Press platform.
Data correspond to usage on the plateform after 2015. The current usage metrics is available 48-96 hours after online publication and is updated daily on week days.
Initial download of the metrics may take a while.