Fig. 4
Download original image
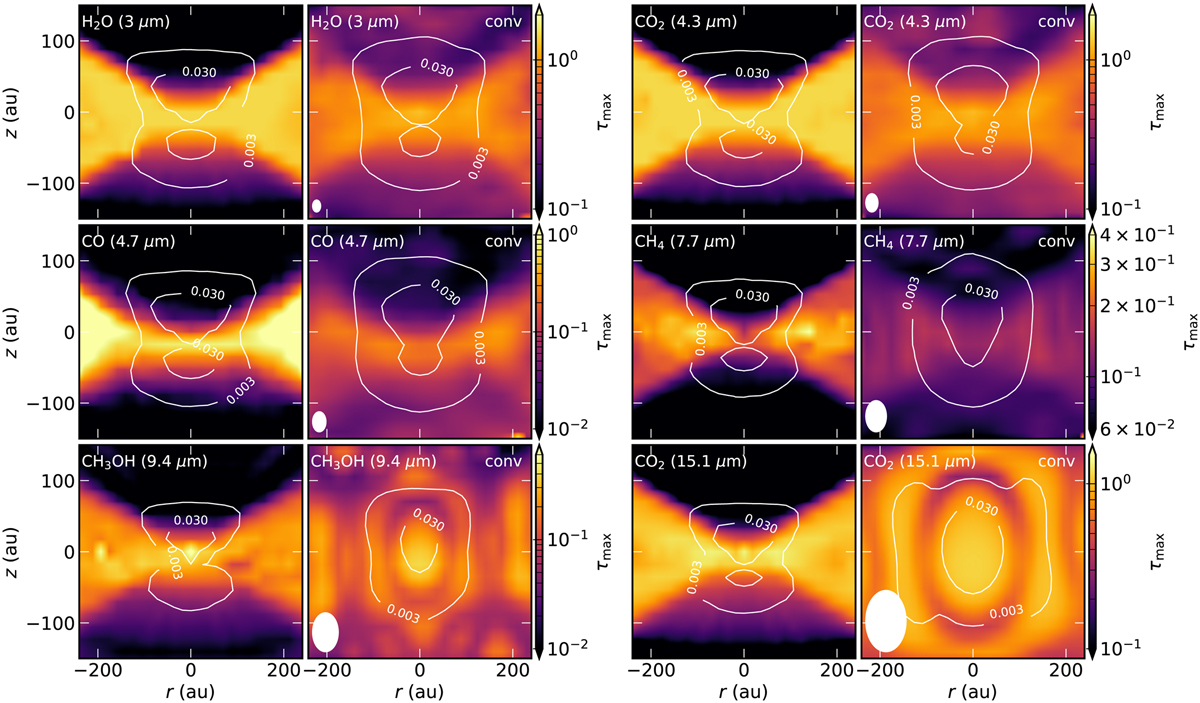
Expected peak optical depth for the six main ice absorption features as a function of disk radius and height toward HH 48 NE. The left columns show the optical depth in the model at similar pixel resolution as NIRSpec and MIRI. The right columns show the same after convolving the model with an instrumental PSF of NIRSpec (<5 µm) or MIRI (>5 µm). The FWHM of the PSF is shown in the lower left corner. The white contours show the local continuum at 0.003 and 0.030mJy for reference. 30 µJy is the typical 3σ sensitivity of a JWST/NIRSpec exposure of ~1 h. The color scales are different for each ice feature.
Current usage metrics show cumulative count of Article Views (full-text article views including HTML views, PDF and ePub downloads, according to the available data) and Abstracts Views on Vision4Press platform.
Data correspond to usage on the plateform after 2015. The current usage metrics is available 48-96 hours after online publication and is updated daily on week days.
Initial download of the metrics may take a while.