Open Access
Fig. 2
Download original image
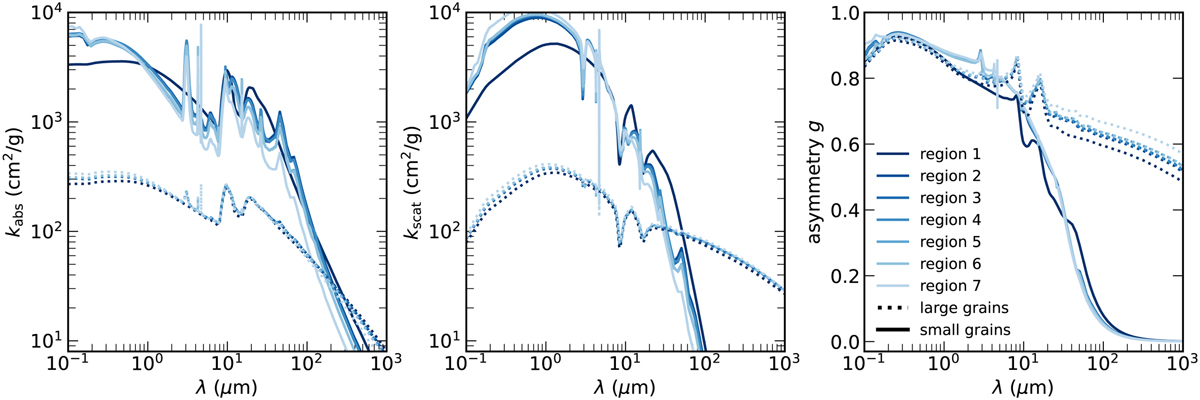
Opacities used for the seven different regions in the disk. Left: absorption opacity. Center: effective scattering opacity. Right: asymmetry parameter g. The regions are numbered with decreasing desorption temperature, as further specified in Table 2.
Current usage metrics show cumulative count of Article Views (full-text article views including HTML views, PDF and ePub downloads, according to the available data) and Abstracts Views on Vision4Press platform.
Data correspond to usage on the plateform after 2015. The current usage metrics is available 48-96 hours after online publication and is updated daily on week days.
Initial download of the metrics may take a while.