Fig. 5
Download original image
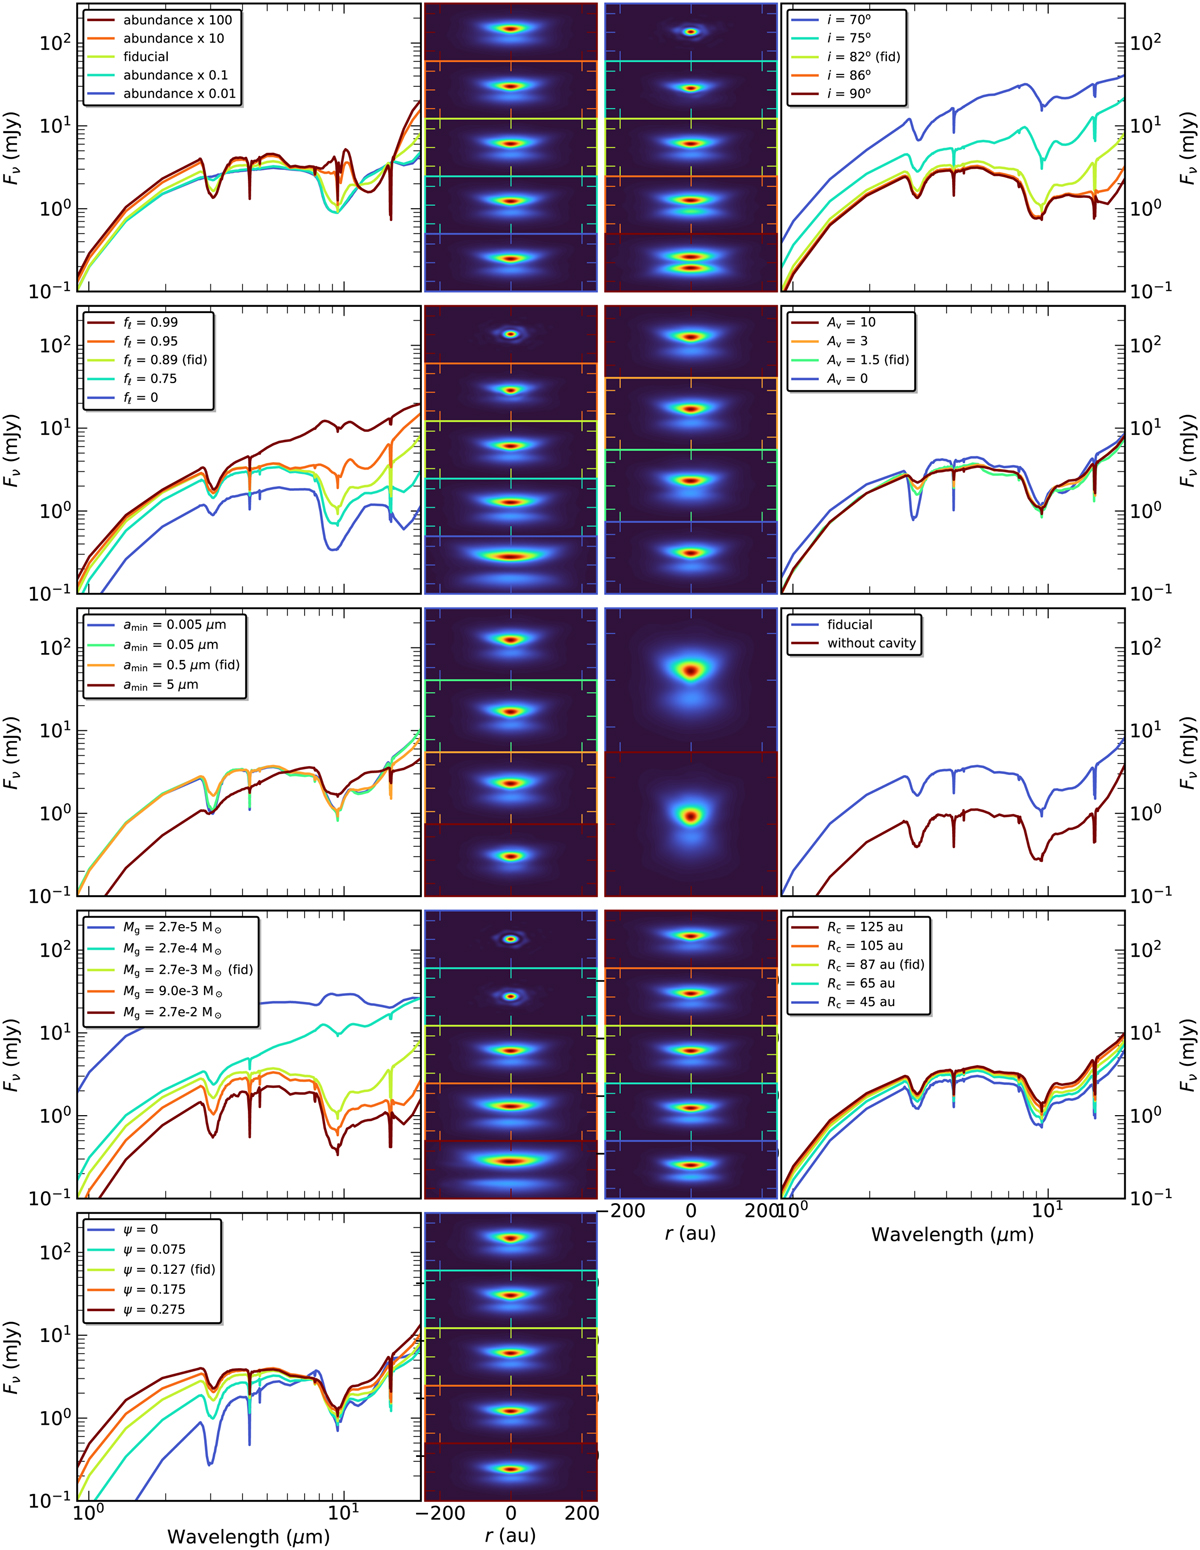
Sensitivity of the mid-infrared spectrum to various parameters of the model, stated in the legend (large panels). Appearance of the disk in scattered light at 4 µm, convolved with the NIRSpec PSF (small panels). The panels are labeled with the same color as the legend and show to which extent changes in these parameters will be visible in the NIRSpec images. The vertical ticks indicate ±100 au.
Current usage metrics show cumulative count of Article Views (full-text article views including HTML views, PDF and ePub downloads, according to the available data) and Abstracts Views on Vision4Press platform.
Data correspond to usage on the plateform after 2015. The current usage metrics is available 48-96 hours after online publication and is updated daily on week days.
Initial download of the metrics may take a while.