| Issue |
A&A
Volume 677, September 2023
|
|
|---|---|---|
| Article Number | A177 | |
| Number of page(s) | 20 | |
| Section | Catalogs and data | |
| DOI | https://doi.org/10.1051/0004-6361/202245634 | |
| Published online | 26 September 2023 | |
Frequency analysis of the first-overtone RR Lyrae stars based on Extended Aperture Photometry from K2 data★
1
Konkoly Observatory, Research Centre for Astronomy and Earth Sciences, Eötvös Loránd Research Network (ELKH); MTA Centre of Excellence,
1121
Konkoly Thege Miklós út 15–17,
Budapest, Hungary
e-mail: henia@netzel.pl
2
MTA CSFK Lendület Near-Field Cosmology Research Group,
1121
Konkoly Thege Miklós út 15–17,
Budapest, Hungary
3
ELTE Eötvös Loránd University, Institute of Physics,
1117,
Pázmány Péter sétány 1/A,
Budapest, Hungary
4
ELTE Eötvös Loránd University, Gothard Astrophysical Observatory,
Szent Imre h. u. 112,
9700
Szombathely, Hungary
Received:
7
December
2022
Accepted:
18
March
2023
Context. Additional low-amplitude signals have been observed in many RR Lyrae stars separate from pulsations in radial modes. The most common of these are short-period signals forming a period ratio of around 0.60–0.65 with the first overtone and long-period signals forming a period ratio of around 0.68. The RR Lyrae stars may also exhibit quasi-periodic modulation in their light curves, the so-called Blazhko effect.
Aims. We used the extensive sample of the first-overtone RR Lyrae stars observed by the Kepler telescope during the K2 mission to search for and characterize additional low-amplitude signals. The K2 data provides space-based photometry for a statistically significant sample. Hence, this data is excellent for studying the pulsation properties of RR Lyrae stars in detail.
Methods. We used K2 space-based photometry for RR Lyrae candidates from Campaigns 0–19. We selected RR Lyrae stars pulsating in the first overtone and performed a frequency analysis for each star to characterize their frequency contents.
Results. We classified 452 stars as first-overtone RR Lyrae. From that sample, we selected 281 RR0.61 stars, 67 RR0.68 stars, and 68 Blazhko stars. We found particularly interesting stars that show all of the above phenomena simultaneously. We detected signals in RR0.61 stars that form period ratios lower than those observed for the majority of stars of this type. These signals likely form a new sequence in the Petersen diagram, around a period ratio of 0.60. In 32 stars, we detected additional signals that form a period ratio close to that expected in RRd stars, but the classification of these stars as RRd is uncertain. We also report a discovery of additional signals in eight stars that form a new group in the Petersen diagram around the period ratio of 0.465–0.490. The nature of this periodicity remains unknown.
Key words: stars: variables: RR Lyrae / stars: oscillations / stars: horizontal-branch
Full Tables 1–4 are available at the CDS via anonymous ftp to cdsarc.cds.unistra.fr (130.79.128.5) or via https://cdsarc.cds.unistra.fr/viz-bin/cat/J/A+A/677/A177
© The Authors 2023
 Open Access article, published by EDP Sciences, under the terms of the Creative Commons Attribution License (https://creativecommons.org/licenses/by/4.0), which permits unrestricted use, distribution, and reproduction in any medium, provided the original work is properly cited.
This article is published in open access under the Subscribe to Open model. Subscribe to A&A to support open access publication.
1 Introduction
RR Lyrae stars are low-mass population II pulsating stars from the classical instability strip. The majority of them pulsate in the radial fundamental mode (RRab), first overtone (RRc), or the fundamental and first-overtone modes simultaneously (RRd). Double-mode pulsations in the fundamental and second overtone modes are also known, but such stars are relatively rare (Benkő et al. 2010; Moskalik 2013). Similarly, triple-mode pulsations in radial modes are also a rare phenomenon reported in few stars (Molnár et al. 2012; Jurcsik et al. 2015; Soszyński et al. 2014). For many years, the only unexplained phenomenon occurring in RR Lyrae stars was the presence of the Blazhko effect.
The Blazhko effect is a quasi-periodic modulation of the amplitude and/or phase of the pulsations (Blažko 1907). It is more common among RRab stars than RRc stars. Jurcsik et al. (2009) inferred the Blazhko effect to have an incidence rate of nearly 50% in RRab stars. The incidence rate is lower for RRc stars. In the Galactic bulge, it is estimated to be below 6%, according to ground-based data (Netzel et al. 2018). The Blazhko effect is also known to occur among RRd stars (Jurcsik et al. 2015; Smolec et al. 2015; Plachy et al. 2017; Carrell et al. 2021). The origin of the Blazhko effect has remained a mystery for over a century, and many mechanisms have been proposed, but none fully explain the properties. Only recently, Kolláth (2021) was able to produce amplitude modulation similar to the Blazhko effect in the theoretical model of an RRab star via interactions between the fundamental mode and the ninth overtone, although it does not explain all the aspects of the Blazhko effect observed in RRab stars. Moreover, the explanation of the Blazhko effect in RRc stars is still missing.
Thanks to new photometric observations from ground-based large-scale surveys, such as the Optical Gravitational Lensing Experiment (OGLE; Udalski et al. 2015) and such space-based missions as CoRoT, Kepler, and TESS, we have gained new insights into the pulsations of RR Lyrae stars, and a variety of additional low-amplitude signals that do not correspond to radial modes have been detected. The most numerous group of RR Lyrae stars with additional periodicities consists of RRc and RRd stars with low-amplitude, short-period signals forming a period ratio of around 0.60–0.64 with the first overtone, so-called RR0.61 stars. The first member of this group was an RRd star, AQ Leo, observed with the MOST space telescope (Gruberbauer et al. 2007). Currently, over a thousand RR0.61 stars are known. They have been observed with both ground-based (e.g., Jurcsik et al. 2015; Smolec et al. 2017; Netzel & Smolec 2019) and space-based surveys (e.g., Moskalik et al. 2015; Molnár et al. 2015, 2022). The incidence rate of RR0.61 stars has increased with the better quality of the photometry used in such surveys. The incidence rate is below 60% for ground-based data, but this rate is exceeded when using space-based photometry, suggesting that this multimode type of pulsation is a common feature among first-overtone RR Lyrae stars. Interestingly, an additional signal has not been detected in RRab stars where the first overtone is not present. An explanation for the nature of RR0.61 stars was proposed by Dziembowski (2016), who suggested that the observed signals are due to harmonics of nonradial modes of degrees ℓ = 8 and 9. We note that similar signals have been observed in the first-overtone classical Cepheids (see e.g., Soszyński et al. 2010; Rathour et al. 2021, and references therein). The model proposed by Dziembowski (2016) explains these analogous signals in classical Cepheids as harmonics of nonradial modes of degrees seven, eight, and nine. Notably, Plachy et al. (2021) reported the detection of an analogous signal in an overtone anomalous Cepheid.
Another group of multimode RR Lyrae stars are the so-called RR0.68 stars (Netzel et al. 2015). In these stars, the dominant pulsation mode is the first overtone. The additional signal has a longer period and forms a period ratio with the first overtone of about 0.686, meaning that its period is longer than the period corresponding to the fundamental mode. Analogous signals have also been reported in classical Cepheids by Süveges & Anderson (2018). The nature of this additional signal still lacks an explanation.
Additional low-amplitude signals have been detected in RRab stars as well. Smolec et al. (2016) reported the discovery of a group of long-period RRab stars with additional shorter-period signals. They suggested that these stars can be explained as pulsating in the fundamental mode and first overtone. Prudil et al. (2017) found a group of RR Lyrae stars that have an additional signal of a shorter period and are located in the Petersen diagram at the short-period extension of an RRd sequence. The origin of the observed signals remains unknown.
Observations carried out with the Kepler satellite have resulted in many discoveries connected to all of these phenomena in RR Lyrae stars. Continuous sampling has led to the discovery of period doubling in RRab stars showing the Blazhko effect (Kolenberg et al. 2010; Szabó et al. 2010) and to the detection of additional signals in RR Lyrae stars (Benkő et al. 2010; Moskalik et al. 2015). The original Kepler field could no longer be monitored after two reaction wheels failed, and thus a new mission named K2 followed, which monitors subsequent fields along the ecliptic plane (Howell et al. 2014). Observations of these fields, called “campaigns,” lasted around 80 days for each field, with the exception of Campaign 19, which lasted around 15 days. Challenges in data processing came with the new mode of observation. Plachy et al. (2019) suggested an analysis method optimized for detecting RR Lyrae stars. The method called Extended Aperture Photometry was then automatized and applied to Campaigns 0–19 by Bódi et al. (2022).
In this work, we aim to characterize the phenomena that occur in first-overtone RR Lyrae stars, such as the Blazhko modulation and the presence of additional signals, using the K2 light curves extracted by Bódi et al. (2022). The paper is structured as follows: in Sect. 2, we describe the method. We present results in Sect. 3 and discuss them in Sect. 4. Finally, conclusions are collected in Sect. 5.
2 Methods
We used light curves of RR Lyrae candidates observed in Campaigns 0 to 19 of the K2 mission, as prepared by Bódi et al. (2022). First, we performed a classification based on light curve shapes to select RRc stars from the whole sample. Second, we carried out the frequency analysis of the classified RRc stars. We searched for stars showing the Blazhko effect and for those that feature additional signals.
2.1 Data and classification
The sample of light curves prepared by Bódi et al. (2022) consists of 3917 light curves for K2 Campaigns 0 to 19. Some of the stars were observed during multiple campaigns; hence, the number of unique stars in the whole sample is 3057. The positions of these stars in sky coordinates are presented in Fig. 1.
Classification of the 3057 candidate RR Lyrae stars into RRc and RRab subtypes was carried out in two stages. In the first step, we used Fourier transforms to find the dominant periodicity for each object. Then, we fitted a Fourier series to each light curve in the form:
 (1)
(1)
where A0 is a mean brightness and Ak, fk, and ϕk are the amplitude, frequency, and phase of the k-th harmonic of the highest signal in the power spectrum. Only harmonics fulfilling the criterion Ak/σk > 4.0 were fitted to the data. From the fit, we obtained the Fourier coefficient, R21, defined as amplitude ratio (Simon & Lee 1981):
 (2)
(2)
The Fourier coefficient, R21, is presented in Fig. 2. For reference, we included RRab and RRc stars observed by the OGLE project toward the Galactic bulge (Soszyński et al. 2014). Based on the Fourier coefficient R21, we performed the initial classification of stars for RRc and RRab subtypes. Several stars with a period or R21 values atypical for RR Lyrae stars are not presented in Fig. 2, and they were not analyzed further.
We visually inspected the light curves phased with the dominant periodicity in the second classification step. This step allowed us to exclude from the RRc sample objects that are not RRc stars but have similar Fourier coefficient values (e.g., eclipsing binaries). In particular, we excluded objects in which the only periodicity originates from the instrumental signal connected to the K2 observations (see the points forming a line of the constant period around 0.25 day in Fig. 2).
We classified 452 stars as RRc. Their positions in sky coordinates are plotted in Fig. 1, and their Fourier coefficients R21 are plotted in Fig. 2. Further analysis focuses only on those stars. We note that we did not merge the data for stars observed in multiple campaigns. Typically, the campaigns were far apart from each other. Due to technical reasons, we did not join such datasets. For our analysis, we chose data from only one campaign for each star where the instrumental trends were the least significant.
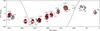 |
Fig. 1 Positions of RR Lyrae candidates and classified RRc stars in sky coordinates. RR Lyrae candidates are plotted with black symbols. Stars classified as RRc are plotted with red symbols. |
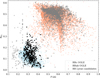 |
Fig. 2 Fourier coefficient R21 as a function of period of pulsation. RR Lyrae candidates are plotted with black open circles. Filled black circles correspond to stars classified as RRc. For a reference, we plotted RRab and RRc stars observed by the OGLE project toward the Galactic bulge with light blue and orange points (Soszyński et al. 2014). |
2.2 Frequency analysis
To perform the frequency analysis, we followed the standard consecutive prewhitening method. After prewhitening with the dominant signal and its harmonics, we searched for additional signals in the Fourier spectrum of the residual light curve. If an additional signal was detected, it was added to the Fourier series in the form of Eq. (1) either as an independent frequency or as a linear combination of frequencies already included in the fit. Then, we subtracted the Fourier fit from the data and repeated the inspection of the residuals. The Nyquist frequency for the analyzed data is around 24 c/d. We inspected the frequency range of 0–20 c/d. Again, only terms fulfilling the criterion A/σA > 4 remained in the final light curve solution.
For some stars, we observed significant long-term trends in the data that were likely of instrumental origin. Such trends manifest in the frequency spectra as signals at low frequencies. Such signals increase the noise level and hamper the search for signals at low amplitudes. We removed such trends by fitting a spline function to the residuals and subtracting it from the data.
RRc stars often show irregular period changes, manifesting as additional signals close to the first-overtone frequency (Jurcsik et al. 2001). Typically, these signals are unresolved with the first-overtone frequency. We considered two signals to be resolved within the resolution of the Fourier transform when their separation was larger than 2/ΔT, where ΔT is the time baseline. We included only resolved signals in the solution.
We found the three most common groups of RRc stars with additional signals to be RR0.61, RR0.68 and Blazhko stars. In RR0.61 stars, we observed additional signals of period, P0.61, shorter than the first-overtone period, P1O, and typically P0.61 ∈ 〈0.60,0.64〉 P1O. We allowed for a larger margin and classified stars as RR0.61 when P0.61 ∈ 〈0.57,0.65〉P1O. Often, many signals in a single star fulfilled this criterion (see Sect. 3.2). We included all resolved signals in the fit.
A common feature of RR0.61 stars is the presence of sub-harmonics of the additional signals, f0.61, at around 0.5 f0.61 and 1.5f0.61. The subharmonics often show complex structures in the frequency spectra (see Sect. 3.2). The structures of signals at f0.61 and its subharmonics often consist of many unresolved peaks, which makes complete prewhitening (i.e., to the point where only the noise is left in the frequency spectrum of residuals) impossible.
The additional signal in the RR0.68 stars has a period longer than the first-overtone period. The period ratio between the two periodicities is around 0.686, with a relatively small scatter around this value observed among currently known RR0.68 stars. Since we do not know the range of possible deviation from P0.68/P1O ≈ 0.686, we again allowed for a larger margin of period ratios. We classified stars as RR0.68 when the period ratio between the first-overtone period and the period of the additional signal was in a range of 0.66–0.71.
The Blazhko effect can normally be detected through a visual inspection of the light curve (see examples in Sect. 3.4). In the frequency spectrum, it manifests as modulation multiplets centered at the pulsation frequency and its harmonics. The frequency separation between the side peaks and the pulsation frequency corresponds to the frequency of modulation, fB, and its period, PB. The structure and amplitudes of side peaks depend on the modulation properties (Benkő et al. 2011).
We classified candidates for Blazhko stars based on the visible light curve modulation or based on the presence of side peaks in frequency spectra. We note that in some stars, the modulation is visible in the light curve, but the data coverage is too short to detect resolved side peaks in the frequency spectra. However, simply the presence of side peaks was not a strict enough criterion to distinguish between Blazhko and non-Blazhko stars. Namely, often many signals (resolved or unresolved) were present in the vicinity of the first overtone and its harmonics. Such signals can come from irregular period changes that mimic quasi-periodic modulation over the span of the observations or instrumental artifacts. This is particularly the case for short timebase K2 data. Consequently, not all low-amplitude side peaks and quasi-periodic modulations can be labeled as the Blazhko effect (see a discussion in Molnár et al. 2022, and references therein). We decided to also check the temporal variability of amplitude and phase. This served as an additional criterion to distinguish between firm Blazhko stars and dubious cases in which, due to the complexity of the Blazhko effect, no firm conclusion is possible on a time baseline as short as that of the K2 campaigns. Examples of amplitude and phase changes for two stars are presented in Fig. 3. In the top panel, we have plotted a star that was classified as a firm Blazhko star. In the bottom panel, we have plotted a star that was marked as a Blazhko star based only on the presence of side peaks, as the amplitude and phase variability were too irregular to confirm this case.
We also divided Blazhko stars into BL1 and BL2 subclasses. In BL2 stars, we detected side peaks at both sides of the dominant frequency. In BL1 stars, we detected side peaks only on one side of the main peak, so-called doublets.
Apart from the additional signals connected to the Blazhko effect or the RR0.61 and RR0.68 groups, in some stars we detected additional signals that do not fall into the mentioned categories. We present these stars in Sect. 3.5. A number of stars from the sample were not straightforward to classify. These stars are discussed individually in Appendix A.
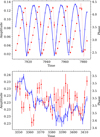 |
Fig. 3 Amplitude (blue) and phase (red) changes over time in two stars with detection of signals close to the first-overtone frequency. Top panel: amplitude and phase changes of EPIC 248553635. This star was classified as Blazhko. Bottom panel: amplitude and phase changes of EPIC 212595129. This star was not classified as Blazhko. |
3 Results
3.1 RRc stars
We classified 452 targets as RRc stars. In Table 1, we provide their coordinates, mean brightness collected in the Ecliptic Plane Input Catalog (EPIC; Huber et al. 2016), and the dominant period derived during the analysis. In the case of seven stars in NGC 5897, the information about mean brightness was not available in the input catalog but was calculated from the light curve during the analysis (term A0 in Eq. (1)).
The positions of RRc stars in sky coordinates are plotted in Fig. 1. There are seven stars in our sample that are likely members of the globular cluster NGC 5897. This and the other globular clusters observed in the K2 campaigns will be studied elsewhere in detail (Kalup et al., in prep.).
In the top panel of Fig. 4, we present the distribution of the observed Kp band brightnesses for RRc stars. The range of brightness in the sample is wide, from 11 mag to 21 mag, with a majority of the stars being fainter than 15 mag. The average brightness in the sample is around 16.7 mag.
The distribution of dominant periods for all RRc stars is presented in the bottom panel of Fig. 4. The shortest and the longest periods in the sample are 0.24 day and 0.56 day, respectively. The average period in the sample is 0.33 day, and a majority of the stars have periods shorter than around 0.35 day.
The distributions plotted in Fig. 4 correspond to RRc stars for which we detected any kind of additional signal. These can be either RR0.61, RR0.68, or Blazhko stars or stars where the additional signals are of unknown origin. All of these stars will be discussed in detail in the text. In Fig. 4, we also provide the incidence rate of RRc stars with additional signals for each bin. The incidence rate slightly decreases for decreasing brightness. In particular, we did not detect any additional signals in stars with a mean brightness above 20 mag. We did not notice any significant dependence of the incidence rate on the dominant pulsation period.
3.2 RR0.61 stars
We found additional signals corresponding to the RR0.61 group in 281 stars. This corresponds to an incidence rate of 62%. Properties of these stars are collected in Table 2. For some stars, there is more than one row. In these stars, we detected more than one additional signal that forms a period ratio within a range of 0.57–0.65. Detection of several signals is common for RR0.61 stars and will be discussed further in this section.
In Fig. 5, we have plotted a Petersen diagram for RR0.61 stars using all of the additional signals detected in these stars (i.e., all rows from Table 2). Signals that correspond to the same star are connected with a line. In the right panel of Fig. 5, we have plotted the distribution of period ratios. In the Petersen diagram, our sample forms three already well-known sequences for period ratios around 0.61, 0.62, and 0.63 (see e.g. Netzel & Smolec 2019). Separate from these three sequences, there is noticeable scatter toward lower period ratios, below 0.61, where two additional maxima are visible. The first one corresponds to a period ratio of around 0.605 and the second to around 0.598. There are six stars with even lower values (i.e., below 0.59). In four of them, the signal that forms the low period ratio is present together with signals forming period ratios in the expected range of 0.60–0.64.
Two stars in which the only detected signal forms a low period ratio are EPIC 220654797, with P0.61/P1O ≈ 0.5857, and EPIC 250003296, with P0.61/P1O ≈ 0.58273. Such values would also fit double-mode pulsations in the fundamental mode and second overtone. We checked the Fourier decomposition parameters for both stars. The position of EPIC 220654797 in the Fourier decomposition parameters plot (Fig. 2) is in between the groups of RRab and RRc stars. The classification of this star as pulsating in the fundamental mode and second overtone is therefore also possible. In the case of EPIC 250003296, its position in Fig. 2 is very typical for RRc stars. In this star, however, we did not detect any combination signals between the additional periodicity and first overtone, so there is a strong probability that the observed signal originates from blending. In both outlying stars, we detected the Blazhko effect.
As already visible from the Petersen diagram in Fig. 5, we detected more than one additional signal in the majority of stars. In fact, we detected only a single signal in 95 stars that have P0.61 ∈ 〈0.57,0.65〉P1O. In Fig. 6, we have plotted the Petersen diagram for RR0.61 stars using the only detected signal or, in the case of stars with multiple detected signals, the additional signal with the highest amplitude. A histogram of period ratios is presented in the right panel of Fig. 6. The most populated sequence is still located at a period ratio of around 0.61. There is also significant scatter around this sequence. Within the range of this scatter, we can see a hint of a sequence centered at a period ratio of 0.62. A sequence located at period ratios of 0.63 is also clearly visible. There is significantly less scatter around this sequence. Interestingly, the new sequence formed in the Petersen diagram at a period ratio of around 0.60 can be clearly seen. Three sequences located at period ratios of 0.598, 0.61, and 0.63 are also very visible in the distribution of period ratios in the right panel of Fig. 6. The sequences located at period ratios of around 0.605 and 0.62 are still visible, but less pronounced.
In Fig. 7, we show an example of a frequency spectrum for an RR0.61 star, EPIC 228763070, after prewhitening with the first overtone and its harmonics. A large number of additional signals remained after prewhitening. The highest signal corresponds to the f0.61 signal. Both signals corresponding to the subharmonics (i.e., signals at 0.5f0.61 and 1.5f0.61) were detected. Such signals are common for RR0.61 stars, especially in space-based photometry. Stars in which we detected subharmonics are marked with an “s” in the remarks column of Table 2. We also detected signals arising due to linear combinations between f0.61, its sub-harmonics, and the first-overtone frequency. Stars in which we detected combination signals between f0.61 and the first overtone are marked with a “c” in the remarks column of Table 2.
In Fig. 8, we have plotted frequency spectra of eight of RR0.61 stars as examples for the variety seen in additional signals. In the figure, we show the frequency range corresponding to the f0.61 signals only, and we scaled the horizontal axis with the first-overtone period so the positions of signals can be directly compared with the positions of the stars in the Petersen diagram (Figs. 5 and 6). In the top three panels, we show examples of stars where only one additional signal was detected. For these panels, we chose stars that belong to three different sequences in the Petersen diagram. Specifically, they are members of the 0.61, 0.63, and 0.60 sequences, respectively. As already shown, more than one signal was detected in this frequency range in the majority of RR0.61 stars. The next panels of Fig. 8 show examples of such stars. In the fourth and fifth panels, three signals were detected. These signals are well resolved from each other and form period ratios that simultaneously fit the three sequences in the Petersen diagram well. In the case of EPIC 201318343 (fourth panel), the star belongs to the 0.61, 0.62, and 0.63 sequences. In the case of EPIC 201318343 (fifth panel), the star belongs to 0.60, 0.61, and 0.63 sequences. In the last three panels, we present examples of stars in which many additional signals were detected, not only those that correspond directly to well-defined sequences in the Petersen diagram.
The subharmonics of the additional signals (i.e., signals at the half-integer frequencies) are often observed in RR0.61 stars (see e.g. Netzel & Smolec 2019; Moskalik et al. 2015). From the ground-based photometry, subharmonics at 0.5f0.61 are detected most of the time. In the space-based photometry, subharmonics at 0.5f0.61 and 1.5f0.61 have been reported. We found signals at subharmonic frequencies in 183 stars, which corresponds to 65% of the RR0.61 stars. Stars with detected subharmonics are marked in Table 2 with an “s” in the remarks columns. In 104 stars, we detected both subharmonics at 0.5f0.61 and 1.5f0.61. In 40 stars, we only detected subharmonics at 0.5f0.61, and in 39 stars we only detected subharmonics at 1.5f0.61.
Typically, the signals corresponding to the subharmonics show temporal variations in amplitudes and phases (see Moskalik et al. 2015). In the frequency spectra, this variability manifests as wide signals, often located offset from the exact frequencies at 0.5f0.61 or 1.5f0.61. In Fig. 9, we show six examples of stars with both subharmonics to present the variety of these signals in the frequency domain. The structure formed by the subharmonics at 0.5f0.61 is much more complex than the f0.61 signal itself or the subharmonics at 1.5f0.61. Subharmonics at 0.5f0.61 typically form an extended section of power excess over a wide frequency range. Interestingly, the subharmonics at 1.5f0.61 are significantly narrower than their low-frequency counterparts and show more resemblance to signals at f0.61. According to the explanation by Dziembowski (2016), signals at 0.5f0.61 are the true frequencies of nonradial modes excited in these stars, while signals observed at f0.61 and 1.5 f0.61 are harmonics of these nonradial modes. Due to the cancellation effect, signals at f0.61 typically have higher amplitudes than subharmonics at 0.5f0.61 (i.e., the parent frequencies), but this is not always the case. In Fig. 10, we have plotted the distribution of amplitude ratios of the 0.5f0.61 and f0.61 signals. The subharmonics at 0.5f0.61 typically have much smaller amplitudes than the signals at f0.61, that is, the amplitude ratio is smaller than 0.5 for the majority of stars. However, the amplitude of the subharmonics is higher in four stars. The ratio of these stars is lower than in the Galactic bulge sample, where this was the case for 35 out of 114 RR0.61 stars with subharmonics (Netzel & Smolec 2019).
Basic properties of stars classified as RRc.
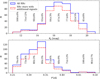 |
Fig. 4 Distribution of observed brightness in Kp band (top panel) and first-overtone period (bottom panel) for stars classified as RRc (blue solid line). With a red dashed line, we plotted the distributions for RRc stars in which we detected additional low-amplitude signals. We also provide the incidence rate of RRc stars with the additional signals for each bin of both distributions. The error was calculated assuming Poisson distribution (see e.g. Alcock et al. 2003). |
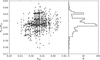 |
Fig. 5 Petersen diagram for RR0.61 stars. Signals detected in the same star are connected with a line. Right panel: Histogram of period ratios. |
Properties of RR0.61 stars.
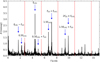 |
Fig. 7 Frequency spectrum for EPIC 228763070 after prewhitening with the first overtone and its harmonics. Positions of the prewhitened signals are marked with red dashed lines. The highest additional signals present in the frequency spectrum are marked with arrows and are labeled. |
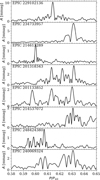 |
Fig. 8 Examples of frequency spectra for eight RR0.61 stars for a frequency range corresponding to f0.61 signals. The horizontal axis is scaled with the first-overtone periods. The star’s ID is provided in the upper-left corner of each panel. |
3.3 RR0.68 stars
We found the additional signal corresponding to the RR0.68 group in 67 stars, giving us an incidence rate of 15%. The properties of these stars are collected in Table 3. As opposed to the RR0.61 stars, the additional signals in RR0.68 stars are typically coherent and appear as single peaks. However, in three stars we detected more than one signal that forms a period ratio close to 0.68. In Table 3, there is more than one row for these stars.
The RR0.68 stars are plotted in the Petersen diagram in Fig. 11. For reference, we have also plotted RR0.68 stars detected in the OGLE data (Netzel et al. 2015). The stars studied here are centered on a period ratio of around 0.685, which is slightly lower than what was observed for the OGLE sample, where the average period ratio was around 0.686. A majority of the stars have period ratios ranging from 0.678 to 0.692, while five stars have higher ratios and another five stars have lower ratios. The highest period ratio observed in the sample is 0.70779, for EPIC 228757559. In this star, we also detected the f0.61 signal. Another outlier with a high period ratio is EPIC 200194935. In this star, we observed three additional signals that have f0.68 ∈ 〈0.66,0.71〉. The signal of the highest amplitude forms a period ratio that fits the RR0.68 group well, P1O/Px ≈ 0.687. The second-highest amplitude signal forms a slightly lower period ratio, around 0.673. The signal with the highest period ratio has the lowest amplitude of the three, with its signal-to-noise ratio being only 4.16. The lowest period ratio in the sample is 0.66764, observed in EPIC 246217239. The detection in this star is significant, with a signal-to-noise ratio of around 7.9. In this star, we also detected a f0.61 signal and an additional signal with low amplitude that fits the RRd sequence in the Petersen diagram. Interestingly, the majority of stars that are outliers from the RR0.68 group in the Petersen diagram have additional signals with periods P0.68 > 0.5 day.
In Fig. 12, we have plotted a histogram of the P0.68 periods. For comparison, we include the sample of RR0.68 stars based on the OGLE data. The highest number of stars in the K2 sample corresponds to periods of around 0.5 day. Interestingly, in the distribution for the OGLE sample, there is a minimum for P0.68 ≈ 0.5 day. In ground-based data, as in the case of the OGLE data, periods around 0.5 day correspond to the position of possible instrumental signals or daily aliases of long trends. Consequently, the distribution of the K2 sample is likely more representational for the RR0.68 group.
In 32 RR0.68 stars, we found signals corresponding to the RR0.61 group. These stars are marked with “0.61” in the remarks column of Table 3 and with “0.68” in the remarks column of Table 2. These stars are particularly interesting in the context of simultaneous theoretical explanations of both types of modes (see discussion in Sect. 4.2) Previously, only six such stars were known. One star was observed in the original Kepler field (Moskalik et al. 2015), three stars were detected in the OGLE sample (Netzel & Smolec 2019), and two were found through TESS observations (Molnár et al. 2022). In this study, we significantly increase the number of known stars that show both kinds of additional signals.
In Fig. 13, we have plotted the frequency spectrum of EPIC 249784033, which is one of the stars that show the f0.68 and the f0.61 signals simultaneously. The highest peak corresponds to the f0.68 signal. It also forms a combination with the first overtone, f1O + f0.68, which is located close to the f0.61 signal. However, both are separated and well resolved. We did not detect a combination signal between f0.61 and f0.68.
In 14 RR0.68 stars, we found Blazhko modulation. These stars are marked with “bl” in the remarks column of Table 3. Blazhko stars are discussed in detail in Sect. 3.4.
Apart from the dominant first-overtone signal, the RR0.68 signal, its combination, and harmonics, we detected additional signals of mostly unknown origin in 28 RR0.68 stars. These stars are marked with a “d” in the remarks column of Table 3.
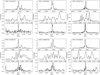 |
Fig. 9 Frequency spectrum examples for six RR0.61 stars. For each star, the top, middle, and lower panels show the frequency ranges corresponding to the f0.61, 0.5f0.61, and 1.5f0.61 signals, respectively. The horizontal axis is scaled with the first-overtone periods. The EPIC numbers are provided in the upper-left corner of the top panel. |
Properties of RR0.68 stars.
3.4 Blazhko stars
We detected Blazhko modulation through visual inspection of light curves in 45 stars. Their light curves are presented in Fig. 14 and the EPIC numbers are included in each panel. The diversity of modulation periods and amplitudes is visible in the figure. Particularly interesting are the stars that show multiperiodic modulation (e.g., EPIC 229177052, EPIC 201552850). Another interesting object is EPIC 220661075 (third row, third column in Fig. 14), as the period and amplitude of modulation seem to change during the 80-day observing period. In the case of several stars, the data length is too short to cover the whole modulation period. In the frequency spectra of such stars, the modulation would show up as signals unresolved from the dominant frequency and its harmonics. The data length of the K2 data is around 80 days. This means that with the adopted criterion for resolution in the frequency spectrum, the longest Blazhko period possible to detect is around 40 days. Only the stars with modulation periods shorter than this limit are the topic of further analysis of the Blazhko effect.
In Table 4 we present stars in which the Blazhko modulation manifests as resolved multiplets in the frequency spectrum. This is the case for 57 stars, which gives an incidence rate of 12.6% for the Blazhko effect in the RRc K2 sample. We note that some stars that were classified as Blazhko are not presented in Fig. 14 because the amplitude of modulation is too small to be visible in the light curve. In eleven more stars, we observed clear modulation of the light curve, but the modulation period is too long for the available data. If we were to include these stars, the number of Blazhko stars would increase to 68, which corresponds to an incidence rate of 15%.
The 57 Blazhko stars for which the modulation period is within the resolution of the Fourier transform are collected in Table 4. For some stars, there is more than one row. In these stars, we detected more than one modulation period. We detected two Blazhko periods in four stars, three Blazhko periods in three stars, and in one star we found four Blazhko periods. For some stars with multiple modulation periods, we found combinations between the side peaks. These stars are marked with a “c” in the remarks column of Table 4. For some of the stars, it was also possible to detect the signal in the low-frequency range that corresponds to the modulation of mean brightness. Such stars are marked with an “a” in the remarks. We marked these stars only when the detection of a signal was clear and not subjected to confusion with long-term instrumental trends. The detection was typically clear because we considered only relatively short-period Blazhko stars. However, in the case of some stars, the strong instrumental trend was present in the data and had not been removed completely with the spline function. In such cases, the noise level in the low-frequency range was raised and may have hampered the detection of signals connected to the mean-brightness modulation. In some stars, we found multiplets (i.e., sidepeaks in the form of nf1O ± kfB, where k > 1). These stars are marked with an “m” in the remarks column.
In Fig. 15, we have plotted a histogram of Blazhko periods from the sample in Table 4. In the case of stars with multiple modulation periods, we used all detected periods. We also compare the distributions of BL1 and BL2 stars in the figure. Two maxima are visible in the distribution of all Blazhko stars. The highest maximum corresponds to Blazhko periods of 10–15 days. This maximum is also visible in the period distributions of both the BL1 and BL2 stars, respectively. The second maximum is significantly lower and corresponds to Blazhko periods of 25–30 days. This peak is not visible in the distribution of BL1 stars. A majority of the stars have modulation periods between 5 and 20 days. The shortest Blazhko period in the sample is 2.81 days. It was detected in the star EPIC 249789797, among four different Blazhko periods. This Blazhko period also corresponds to the BL1 type (i.e., it does not form a full multiplet in a frequency spectrum). The shortest modulation period detected in a star with a single modulation cycle is 5.57 days and was found in EPIC 249605297, a BL2 star.
The longest detected Blazhko period was limited by the data length; we found the period to be 49 days, detected in EPIC 249883675. Two more modulation periods were detected in this star. The longest detected period in a star with a single modulation period is 38 days in EPIC 212767731, a BL2-type star. As shown in Fig. 14, there are stars in the sample with significantly longer modulation periods for which we cannot determine the cycle length.
In Fig. 16, we have plotted the relative modulation amplitudes, defined as the ratio of the amplitude of the highest sidepeak to the first-overtone amplitude:
 (3)
(3)
In the case of BL1 stars, we used the amplitude of the only detected sidepeak. In Fig. 16, we compare distributions of BL2 and BL1 stars with the distribution of all Blazhko stars. For both groups, the highest number of stars corresponds to the low relative modulation amplitude, below 0.1. Nevertheless, there are several stars in both groups with higher relative modulation amplitude values. The largest value of 0.86 was detected in a BL1 star, EPIC 251529654. We note that the frequency content of EPIC 251529654 is puzzling, and it might be in fact an object similar to V37 discussed by Smolec et al. (2017) and OGLE-BLG-RRLYR-11754 of OGLE-BLG-RRLYR-15059 discussed by Netzel & Smolec (2019). Interestingly, there seems to be a gap in the modulation amplitude distribution at around 0.5–0.6. However, the small number of stars with high relative modulation amplitudes makes this observation uncertain.
In Fig. 17, we have plotted the distribution of the asymmetry parameter Q defined as:
 (4)
(4)
by Alcock et al. (2003). We have plotted this distribution in Fig. 17 with a black line. In the case of BL1 stars, we assigned Q = +1 when the sidepeak is located on the higher-frequency side or Q = −1 in the opposite case. These stars are plotted with red dashed lines in. Interestingly, there are many BL2 stars where the Q parameter is lower than −0.8, which means that the sidepeak on the lower-frequency side has significantly higher amplitude than the sidepeak on the higher-frequency side.
Overall, 24 BL2 stars have Q < 0, whereas 18 BL2 stars have Q > 0. However, if we consider only the stars that have Q ∈ 〈−0.8, 0.8〉, then the distribution becomes nearly flat, with 14 stars showing dominant lower-frequency sidepeaks and 16 showing dominant higher-frequency sidepeaks. In the case of BL1 stars, there is also no preference for which sidepeak is present. Thirteen BL1 stars have sidepeaks on the lower-frequency side, whereas 15 stars have sidepeaks on the higher-frequency side.
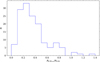 |
Fig. 10 Distribution of amplitude ratio of subharmonic at 0.5f0.61 and signal at f0.61. |
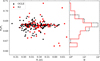 |
Fig. 11 Petersen diagram for RR0.68 stars. Stars detected in the K2 data are plotted with red squares. Stars from the OGLE sample are plotted with black circles. Right panel: histogram of period ratios for the two samples. |
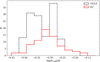 |
Fig. 12 Histogram of periods of the additional signal for RR0.68 stars detected in the K2 data (red solid line) and in the OGLE data (black dashed line). |
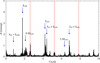 |
Fig. 13 Frequency spectrum for EPIC 249784033 after prewhitening with the first overtone and its harmonics. The positions of the first overtone and the harmonics are marked with red dashed lines. The most important signals are marked with arrows and labeled. |
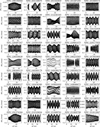 |
Fig. 14 RRc stars with visible Blazhko modulation in the light curve. |
Properties of Blazhko RRc stars.
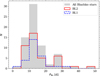 |
Fig. 15 Histogram of the Blazhko periods. |
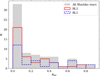 |
Fig. 16 Histogram of the relative modulation for stars with triplets or multiplets detected (BL2) or doublets (BL1). |
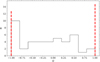 |
Fig. 17 Distribution of the Q parameter (see Eq. (4)) for BL2 stars (black solid line). BL1 stars are plotted with red dashed lines (see text for details). |
3.5 Other additional signals in RRc stars
Aside from the well-established groups (RR0.61, RR0.68 and Blazhko stars), we also found stars with additional signals of mostly unknown origin. We present these stars on the Petersen diagram in Fig. 18 together with the already known groups of multimode RR Lyrae stars, which are RRd stars, double-mode RR Lyrae stars pulsating in the fundamental mode and the second overtone; RR0.61 and RR0.68 stars; and the group of RR Lyrae stars with additional signals of unknown origin discovered by Prudil et al. (2017). We note, that we limited the horizontal axis to 0.65 day, but there are points extending past that limit. These points correspond to stars in which we detected additional signals in a low-frequency range. Such signals are likely due to trends in the data or blending; hence we did not use these signals as the long-period denominators in the Petersen diagram. They also do not form any specific groups and were therefore not investigated further.
We also note that in some stars we detected more than one additional signal of unknown origin. In Fig. 18, we used different symbols to separate stars in which the additional signal has a period longer or shorter than the first-overtone period. There are four places in the Petersen diagram where stars seem to cluster. At a period ratio close to one, there are many stars with additional signals with periods either longer or shorter than the first-overtone period. Such a high period ratio means that the additional signals are located close to the first overtone. The origin of these signals can be due to additional nonradial modes, period changes resulting in close signals, or Blazhko modulation that does not fulfill the criteria described in Sect. 2 for firm classification as Blazhko. At period ratios of 0.8–0.9, there is a group of stars in which the longer period belongs to the additional signal. Such signals can likely be explained by very wide subharmonic signals at 0.5f0.61 (signals at 0.5f0.61 often form complicated and wide structures in frequency spectra; see Fig. 9). This group in the Petersen diagram consists of 36 stars. Interestingly, 27 stars are also in the RR0.61 group, but in the remaining nine stars, the f0.61 signals were not detected. It is possible that in these stars we see the nonradial mode directly. Such stars are already known among RR Lyrae stars (Netzel & Smolec 2019; Benkő et al. 2021) and classical Cepheids (Rathour et al. 2021).
Equally interesting is a group of stars located above the RRd sequence up to a period ratio of around 0.80 that consists of stars in which the additional signal has a longer period than the first-overtone period, too. The origin of such signals is likely to be similar to the 0.80–0.90 group. However, for lower period ratios, when the points get closer to the RRd sequence, it is not clear whether the additional long-period signal is due to a wide subharmonic signal or to the small-amplitude fundamental mode. In principle, it should be easy to distinguish between the wide structures of subharmonics at 0.5 f0.61 and coherent signals of the fundamental mode. In Fig. 19, we show that this is not always the case using the frequency spectrum for KIC 249630037 after prewhitening with the first overtone and its harmonics. As is clearly visible in the frequency spectrum, the signal that would correspond to the fundamental mode is accompanied by many other additional signals that are part of a group of signals centered at the 0.5 f0.61 signal.
Also visible in Fig. 19 is how the two groups at the 0.80–0.90 period ratio and between the RRd sequence and the 0.80 period ratio are formed. The former group is created by signals at frequencies higher than the orange region in Fig. 19. The latter group is formed by signals at frequencies lower than the orange region. Dziembowski (2016) has already predicted and discussed that signals at subharmonics (i.e., the nonradial mode frequencies) would show significantly more variability and more complex and wider structures than the harmonics. However, how wide they can become is not clear. This is especially concerning, as the case of the star shown in Fig. 19 illustrates, signals outside the expected frequency range of subharmonics can have higher amplitudes.
We selected stars that are located at or close to the RRd sequence in Fig. 18 as candidates for RRd stars in which the fundamental mode has a very low amplitude. The selected stars are plotted with red squares in the Petersen diagram in Fig. 20 together with RRd stars and anomalous RRd stars (aRRd) from the Galactic bulge (Soszyński et al. 2019). We selected 32 such stars.
Another group visible in Fig. 18 is located at the period ratios 0.465–0.490 and consists of eight stars. The additional signal, f0.48, has a period shorter than the first-overtone period and also its first harmonic. In Fig. 21, frequency spectra of these eight stars are presented after prewhitening with the first overtone; its harmonics; possible Blazhko sidepeaks; known additional signals, such as f0.61 or f0.68; and an associated combination of signals or subharmonics. In one star we detected a Blazhko modulation. In three stars we detected the Blazhko effect together with the f0.68 signal. In one star we detected Blazhko modulation together with the f0.61 signal. In three stars we did not detect anything that would fall into the categories above. The signal f0.48 is often accompanied by many signals close to the first-overtone frequency and its harmonics and sometimes also by signals in the low-frequency range.
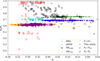 |
Fig. 18 Petersen diagram for additional unknown signals in studied RRc stars. We used red diamonds to indicate if the additional detected signal has a period longer than the first-overtone period and black squares if otherwise. We also plotted RR0.61 and RR0.68 stars identified in this study using purple circles. For comparison, we plotted known multiperiodic groups: RRd stars (green points; Soszyński et al. 2019), fundamental and second overtone (F+2O) stars (yellow pluses; Jurcsik et al. 2008; Poretti et al. 2010; Chadid et al. 2010; Benkő et al. 2010, 2014), peculiar RRd (pRRd) stars (cyan triangles; Prudil et al. 2017), and RR0.61 and RR0.68 from the Galactic bulge (orange crosses and blue diamonds, respectively; Netzel & Smolec 2019). |
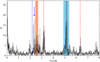 |
Fig. 19 Frequency spectrum for EPIC 249630037 after prewhitening with the first overtone and its harmonics. The positions of the first overtone and its harmonics are marked with red dashed lines. The blue dashed line corresponds to the location of the f0.68 signal (which was not detected in this star). With a blue region, we marked the frequency range of the f0.61 signal, and with an orange region, we marked the corresponding frequency range of the subharmonic. With a blue arrow, we marked the signal that forms a period ratio that fits the RRd sequence. |
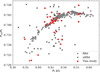 |
Fig. 20 Petersen diagram for RRd stars (gray points) and anomalous RRd stars (black crosses; Soszyński et al. 2019). With red squares, we plotted stars from this study for which we found additional signals that fit the RRd group in the Petersen diagram. |
4 Discussion
4.1 RR0.61 stars
We identified 281 RR0.61 stars out of 452 RRc stars, which corresponds to an incidence rate of 62 per cent. This value is higher than incidence rates inferred from analyzing ground-based photometry, with exception of the study by Smolec et al. (2017) who analyzed RR Lyrae stars in the globular cluster NGC 6362 and inferred an incidence rate of 63 per cent. The incidence rate from this study is also slightly lower than values inferred in other studies that used space-based photometry. Analysis of the photometry for the original Kepler field resulted in the incidence rate of 100 per cent (Moskalik et al. 2015). Forró et al. (2022) analyzed background RR Lyrae stars in the original Kepler field and detected four more RRc stars and two new RRd stars. Again, all of them show the 0.61 signal. Molnár et al. (2015) used K2-E2 data from Pisces and obtained an incidence rate of 75 per cent. Molnár et al. (2022) analyzed TESS photometric data and found 20 RR0.61 stars, which corresponds to the incidence rate of 65 per cent, very similar to that inferred in this study. Different photometric data used in mentioned studies makes the direct comparison of incidence rates not straightforward. We also note that the previous results from space-based photometry are mostly small-number statistics, whereas in this study we used a statistically significant sample.
Even though the incidence rate of RR0.61 stars in this study is slightly lower than what has been inferred from other studies focused on the analysis of space-based photometry, the total number of selected RR0.61 stars significantly increases the number of known RR0.61 stars observed by space telescopes. Up until the time of writing this work, 30 such stars were known (Gruberbauer et al. 2007; Chadid 2012; Szabó et al. 2014; Moskalik et al. 2015; Molnár et al. 2015, 2022; Kuehn et al. 2017; Kurtz et al. 2016). Here, we increase this number by an order of magnitude. The analysis of another numerous sample of RR0.61 stars observed by the TESS satellite is ongoing (Benkő et al., in prep.).
In Fig. 22, we have plot the distribution of periods for RRc and RR0.61 stars. We also provide the incidence rates of RR0.61 for each bin. The errors were calculated assuming a Poisson distribution (e.g., Alcock et al. 2003). The incidence rate of RR0.61 stars is the highest for first-overtone periods between 0.3 day to 0.4 day. We did not detect any RR0.61 stars for the first-overtone periods longer than 0.45 day. We note, however, that even though RRc stars of long periods are known, the long-period stars classified as RRc may in fact be fundamental mode RR Lyrae stars.
In the majority of RR0.61 stars, we found more than one additional signal within the period ratio range of 0.57–0.65. The range of period ratios covered by all signals in the RR0.61 stars is wide. In particular, many points in the Petersen diagram correspond to a period ratio below 0.61 (see Fig. 5). Such scatter was observed in stars from the TESS sample analyzed by Molnár et al. (2022), but for a much smaller number of stars. The histogram of period ratios (right panel of Fig. 5) suggests two additional maxima are present below the well-established 0.61 sequence. Particularly interesting is the Petersen diagram when only the highest additional signal in each star is plotted. Two of the well-established sequences at 0.61 and 0.63 period ratios are visible. According to the explanation by Dziembowski (2016), the sequences at 0.63 and 0.61 are due to the harmonics of nonradial modes of degrees ℓ = 8 and 9, respectively. For the first time, we observed another sequence formed at a period ratio of around 0.599. As predicted by Dziembowski (2016), period ratios lower than 0.60 could correspond to the harmonics of nonradial modes of degrees ℓ = 10 (see Fig. 4 in Dziembowski 2016). In Fig. 23, we have plotted RR0.61 stars using only the highest additional signals and theoretical models for RR Lyrae stars calculated with the Warsaw envelope code (Dziembowski 1977). The models were calculated for M ∈ (0.5, 0.9)M⊙, log L/L⊙ ∈ (1.4, 1.8), log Teff є (3.77, 3.9), X ∈ (0.72, 0.75), and Z ∈ (0.0134,0.000134). Only models with a first-overtone period shorter than 0.5 day and linearly unstable first-overtone and nonradial modes were plotted. The models where the ℓ = 10 nonradial mode is linearly unstable are plotted with red points and cover the range of period ratios corresponding to the lowest sequence at Px/Р1O ≈ 0.599.
Another possibility that has to be considered regarding the origin of the 0.60 sequence involves a combination signal of the 0.68 mode with the first overtone. An example of a star that has both f0.61 and f0.68 signals is presented in Fig. 13. The combination signal, f1O + f0.68, is located close to f0.61. However, we consider the explanation of the 0.60 sequence with the combination signals in RR0.68 stars unlikely. First, of the 26 RR0.61 stars with a low period ratio, only five also show the f0.68 signal. Second, the RR0.68 stars tend to be located close to the period ratio of 0.686, with only a few stars as outliers from the relatively tight 0.686 sequence. Consequently, the sequence created by the combination signal with the first overtone would also show relatively little scatter and would appear tight and horizontal on the Petersen diagram. The average period ratio of the 0.60 sequence is around 0.599, whereas the average period ratio formed by the combination signal of the 0.68 signal with the first overtone would be 0.593.
The period ratio formed by a combination signal of the 0.68 mode with the first overtone is presented in the Petersen diagram in Fig. 24. In the figure, we have plotted RR0.68 stars using the period ratio that is formed by the combination signal with the first overtone (i.e., (f1O + f0.68)/f1O). The 0.60 sequence is indeed located close to the sequence created by the combination frequencies, and there is a small overlap. However, the whole sequence cannot be reproduced simply by using the combination signals, as there is a significant difference in the average period ratios, indicating that the origin of the f0.68 modes is different from that of the f0.61 modes.
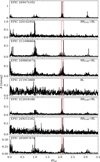 |
Fig. 21 Frequency spectra of eight stars with additional signals of unknown origin forming a period ratio of around 0.47–0.49. The horizontal axis is scaled with a first-overtone frequency. Red boxes indicate the position of signals forming a period ratio in the range of 0.467–0.488. In the upper-left corner of each panel, we provide the star’s EPIC number, and in the upper-right corner, we provide the classification. If no classification is given, only the unknown signals were detected. |
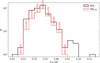 |
Fig. 22 Distribution of first-overtone periods for RRc (black solid line) and RR0.61 stars (red dashed line). Incidence rates of RR0.61 stars are given for each bin. The errors were calculated assuming Poisson distribution (e.g. Alcock et al. 2003). |
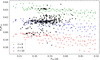 |
Fig. 23 Petersen diagram for RR0.61 stars together with theoretical models for RR Lyrae stars calculated with the Warsaw envelope code (Dziembowski 1977). Only the highest amplitude additional signals (black symbols) are plotted for the RR0.61 stars. For the modeled period ratios, we used the first harmonics of nonradial modes of the given degrees. |
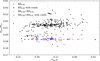 |
Fig. 24 Petersen diagram for RR0.61 stars together with RR0.68 stars using the combination signal, f1O + f0.68, to calculate the period ratio. Open symbols correspond to RR0.68 stars for which we did not detect the combination signal in the frequency spectrum. Filled symbols correspond to stars for which the combination signal was detected. Pure RR0.68 stars are plotted with blue circles. Stars that are both RR0.68 and RR0.61 are plotted with red triangles. |
4.2 RR0.68 stars
We identified 67 RR0.68 stars out of 452 RRc stars, which corresponds to an incidence rate of 15%. This is higher by an order of magnitude than the results from the analysis of ground-based photometry (below 2%; Netzel & Smolec 2019). Molnár et al. (2022) analyzed TESS space-based photometry and obtained an incidence rate very similar to this work – 16% based on five RR0.68 stars identified out of 31 RRc stars. The lower incidence rate obtained from the ground-based photometry is not surprising since the noise level is significantly higher in that data. Additionally, as visible from the period distribution of the RR0.68 stars in Fig. 11, the number of RR0.68 stars is likely underestimated in the ground-based data when the period of the additional signal is around 0.5 day. This corresponds to the first-overtone period of around 0.34 day. In fact, in the K2 sample, RR0.68 stars that have P0.68 ≈ 0.5 day are the most numerous. In Fig. 25, we have plotted the distribution of the first-overtone periods for RRc and RR0.68 stars together with the incidence rate for each bin. The incidence rate of RR0.68 stars increases with longer first-overtone periods.
The only explanation proposed for RR0.68 stars by Dziembowski (2016) assumes that these stars are not true RR Lyrae stars, but low-mass (mass of around 0.25 M⊙) stars stripped from their envelope during the evolution in a binary system similar to the Binary Evolution Pulsator discovered by Pietrzyński et al. (2012). In such stripped giants, the period ratio observed in the RR0.68 stars can be explained by double-mode pulsations in radial fundamental mode and the first overtone. Stars that show both kinds of the additional signals, f0.61 and f0 68, challenge this explanation. In this work, we significantly increase the number of known stars belonging to both RR0.61 and RR0.68 groups. The large number of such stars is important for any further attempts to explain the observed signals, as the explanation proposed for RR0.68 stars has to be consistent with the one proposed for RR0.61 stars.
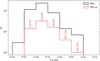 |
Fig. 25 Distribution of first-overtone periods for RRc (black solid line) and RR0.68 stars (red dashed line). The incidence rate of RR0.68 stars is given for each bin. The errors were calculated assuming Poisson distribution (e.g. Alcock et al. 2003). |
4.3 Blazhko stars
We classified 68 stars as Blazhko stars. In 57 of them, the modulation period is covered by the available data. In eleven more stars, the modulation is clearly visible in the light curve, but its period is too long to be fully covered by the available data. The incidence rate is 12.6% when the Blazhko period is covered and 15% when stars with long modulation periods are included. Both incidence rates are higher than what was derived for RRc stars based on all studies but one using ground-based photometry. The Blazhko effect in RRc stars was investigated in the Galactic bulge sample by Netzel et al. (2018), Moskalik & Poretti (2003), and Mizerski (2003). In all of these studies, the incidence rate does not exceed 7%. Higher incidence rates of 10% and 19% were derived for RRc stars in globular clusters M3 and NGC 6362, respectively (Jurcsik et al. 2014; Smolec et al. 2017). The incidence rate obtained in this study is similar to the 13% rate derived by Molnár et al. (2022) based on the TESS sample. Lower incidence rates derived using ground-based photometry are easy to explain through the higher noise level in the frequency spectra. Interestingly, the highest observed incidence rate of Blazhko RRc stars is for NGC 6362, even though ground-based data were used for the analysis (Smolec et al. 2017). Still, the incidence rate derived for RRc stars in this study is significantly lower than the observed for RRab stars (see e.g., Kovacs 2016, and references therein).
We note that we detected additional signals close to the firstovertone frequency and its harmonics in many more stars (see Fig. 18). Such signals can be caused by irregular period changes, which are especially common in RRc stars, and with short data lengths, the signals could mimic features of the Blazhko modulation. Without longer data lengths, we cannot unambiguously classify such stars. There is always a possibility that with longer data lengths, the stars with additional signals close to the first-overtone frequency could also be classified as Blazhko stars.
In Fig. 26, we have plotted the period distribution of RRc stars and Blazhko stars. We also provide the incidence rate of Blazhko stars for each bin. We did not detect Blazhko modulation in stars with a first-overtone period longer than 0.45 day. The highest incidence rate corresponds to stars with first-overtone periods between 0.25 and 0.30 day. The incidence rate decreases with an increasing first-overtone period. This observation is in agreement with results from Netzel et al. (2018), who also observed the highest incidence rate for the 0.25–0.30 day firstovertone period.
Four Blazhko RRd stars analyzed by Molnár et al. (2022) using TESS photometry painted a complex picture of the Blazhko effect in RRc stars. Low noise level allowed for the detection of low-amplitude sidepeaks. In three out of four stars, Molnár et al. (2022) observed strong asymmetry in sidepeak amplitudes (i.e., the Q parameter was close to 1.0 or −1.0). Interestingly, in many Blazhko stars in this study, we observed similar asymmetry resulting in a distribution of the Q parameter presented in Fig. 17, where many stars have values of the Q parameter close to −1.0. This is in contrast to the results obtained by Netzel et al. (2018), where distribution is asymmetric and centered at Q ∼ −0.1, and the number of stars decreases with and increasing |Q|. In addition, we detected numerous samples of modulated stars with only one sidepeak present (i.e., BL1 stars). Incomplete triplets or multiplets, as in BL1 stars, can be caused by strongly asymmetric sidepeaks or additional nonradial modes with a frequency close to first-overtone frequency. However, we considered the latter scenario unlikely (see discussion in Netzel et al. 2018). On the other hand, Benkő et al. (2011) discussed the scenarios in which the strong asymmetry in amplitudes of sidepeaks can be observed. This is likely the case for the group of stars with Q ∈ 〈−1.0, −0.8〉. We consider BL1 stars to likely be Blazhko stars with strong asymmetry of sidepeak amplitudes.
Several models have been proposed over the years to explain the mechanism behind the Blazhko modulation. The most promising model predicting modulation of the light curve in RRab stars involves mode resonances, specifically the 9:2 resonance between the fundamental mode and ninth overtone (Kolláth 2021). An important step toward the development of the model behind the Blazhko effect came with the detection of the period doubling in modulated RRab stars (Kolenberg et al. 2010; Szabó et al. 2010). So far, no similar detection has been made regarding modulated RRc stars. Netzel et al. (2018) tried to detect traces of period doubling using averaged spectra (see their Fig. 15). In this study, we attempted a similar approach but also did not detect any signals that might be related to period doubling in Blazhko RRc stars. Thus, the exact mechanism behind the Blazhko effect, in particular in RRc stars, is still an open problem.
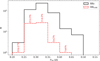 |
Fig. 26 Distribution of first-overtone periods for RRc (black solid line) and Blazhko stars (red dashed line). The incidence rate of Blazhko stars is given for each bin. The errors were calculated assuming Poisson distribution (e.g. Alcock et al. 2003). |
4.4 Color-magnitude diagram
For a subset of stars, we calculated the Gaia absolute magnitudes to place them onto an MG versus (BP–RP) color-magnitude diagram (CMD). Since the accuracy of Gaia parallaxes strongly depends on the apparent brightness of the sources, we limited our sample to stars brighter than 15.0 mag in the G band, which translates to a limiting distance of about 7 to 8 kpc (Hernitschek et al. 2019; Lindegren et al. 2021). We used the mwdust package and the bayestar 3D dust map to calculate interstellar extinction in the Gaia bands (Bovy et al. 2016). We then limited the sample to stars where the extinction in the G band (Aɡ) was below 1.0 mag. This left us with 53 stars.
We marked stars where either the 0.61 or the 0.68 mode is present. The resulting CMD is shown in Fig. 27, where we have plotted the results of Molnár et al. (2022) as well for reference. When looking at the two CMDs, we found that the K2 sample contains more stars that are less luminous compared to the TESS sample, extending down to MG = 1.3 mag. This range is still in good agreement with the CMD presented by Clementini et al. (2023). The difference is likely caused by differences in metal-licity: TESS sectors 1 and 2 sampled the halo, whereas some K2 fields also cover the disk that contains metal-rich RR Lyrae stars that are fainter (Marconi et al. 2015).
Both plots indicate that the blue edge of the instability strip is populated by pure overtone pulsators, but cooler RRc stars almost always feature at least one type of extra mode. This is in good agreement with previous observations (Jurcsik et al. 2015; Smolec et al. 2017; Molnár et al. 2022) and with the linear model calculations of Netzel & Smolec (2022). The agreement between the distribution of the observed f0.61 modes and the linearly excited high-ℓ modes supports the hypothesis of Dziembowski (2016) that we are indeed observing high radial order modes in overtone pulsators.
4.5 RRd candidates
We found 32 stars that have additional signals that place them at or close to the RRd sequence (see Fig. 20). However, in all candidates, the additional signal suspected of being the fundamental mode has a very low amplitude. The amplitude ratio is typically AF/A1O < 0.1, where А1O is the first-overtone Fourier amplitude and AF is the Fourier amplitude of the additional signal that, based on the period ratio it forms with the first overtone, could correspond to the fundamental mode. In Fig. 28, we have plotted the amplitude ratio, AF/А1O, versus the first-overtone period. The colors correspond to period ratio on the Petersen diagram. Candidates selected in this study are plotted with squares. For comparison, we calculated the amplitude ratio for RRd and anomalous RRd stars from the Galactic bulge Soszyński et al. (2019), which are plotted with circles and crosses, respectively. In the right panel of Fig. 28, we include the distribution of the amplitude ratio.
Based on the analysis of the TESS sample, Molnár et al. (2022) noticed a gap in amplitude ratios (see their Fig. 19) between stars with various additional signals and RRd stars. The amplitude ratio presented in Fig. 28 is bimodal, but the clear gap between RRd stars and RRd candidates is not present.
To verify whether these stars might be RRd stars, we have plotted them on the CMD. Again, as in Sect. 4.4, we limited the sample to stars brighter than 15.0 mag in the G band, which left us with eight RRd candidates. The eight stars are plotted in the Petersen diagram and CMD in Fig. 29 with square symbols. Of these, four stars (cyan squares) fit very well to the progression of the RRd sequence in the Petersen diagram. The other four stars (blue squares) are outliers from the RRd sequence. Interestingly, the distinction between these two groups is connected with their positions on the CMD. Stars that follow the RRd sequence are redder. Stars that are outliers from the sequence are typically bluer, likely too blue to classify them as RRd stars.
In the lower panels of Fig. 29, we have plotted the frequency spectra of the eight RRd candidates. In the left column, we have plotted stars that follow the RRd sequence (cyan squares in the Petersen diagram), and in the right column, we have plotted stars that are outliers (blue squares). Frequency spectra were prewhitened with the first overtone and its harmonics as well as with any other additional signals with the exception of 0.5f0.61 subharmonics and signals in its vicinity. We note that in all eight stars, the signals at f0.61 were detected together with the sub-harmonics. We marked the signal that might correspond to the fundamental mode based on the period ratio with red dashed lines. In all stars, the additional signal is located close to the subharmonic at 0.5 f0.61 Especially in the case of stars that are outliers from the RRd sequence, the additional signal blends with the wide structure of the subharmonic. Interestingly, the separation between the signal in question and the subharmonic is more noticeable in the frequency spectra of stars from the cyan group.
Of all 32 stars that are RRd candidates, 16 follow the RRd sequence (see Fig. 20). However, we cannot check their position on the CMD to verify their classification. One of the reasons to doubt the nature of the additional signal is the fact that in the majority of RRd candidates, we also observe the f0.61 signal together with its subharmonics. Indeed, in only two stars of the 32 RRd candidates did we not detect the f0.61 signal. In one of the two stars, EPIC 246159987, we detected two signals. The first one, f1 = 2.17862522 days, forms a period ratio of 0.743 with the first overtone and fits the RRd progression. The second signal, f2 = 2.41719765 days, forms a period ratio around 0.825. Interestingly, the (not observed) harmonic of f2 would form a period ratio around 0.606 with the first overtone, which means that the f2 signal might be a detection of a nonradial mode corresponding to RR0.61 stars. In the second star, EPIC 249605297, we detected Blazhko modulation and an additional signal, f1 = 2.68763533 d, which forms a period ratio of around 0.722 and does not fit the RRd sequence. However, the period ratio is consistent with anomalous RRd stars, which show atypical period ratios and modulation (Soszyński et al. 2016). The signal f1 forms combination signals with the first overtone. The amplitude ratio is low, A1 /A1O ≈ 0.014, which is contrary to aRRd stars. Namely, in aRRd stars, the fundamental mode typically has a higher amplitude than the first overtone. Similar RRd candidates have already been reported by Molnár et al. (2022). The final classification of these stars as RRd or aRRd stars remains uncertain.
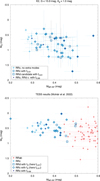 |
Fig. 27 Color-magnitude diagrams. Top panel: Color-magnitude diagram of 53 stars from the bright end of the sample. Presence of additional modes are marked with dark outlines (f0.61) and crosses (f0.68). The RRd candidate stars are marked with squares. Bottom panel: CMD of the TESS observations published by Molnár et al. (2022), for comparison. Here, RRab stars are indicated with red symbols. |
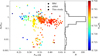 |
Fig. 28 Amplitude ratio of Fourier first-overtone amplitude and the amplitude of the additional signal for RRd candidates (see text for details). The period ratio of the two frequencies is plotted with different colors as indicated in the legend. The RRd candidates are plotted with squares. We also included RRd and aRRd stars from the Galactic bulge, which are plotted with circles and crosses, respectively (Soszyński et al. 2019). Right panel: Distribution of the amplitude ratio. |
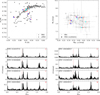 |
Fig. 29 Petersen diagram, color-magnitude diagram, and frequency spectra for eight RRd candidates. Top-left panel: Petersen diagram showing an RRd sequence (gray points), anomalous RRd stars (black crosses), and RRd candidates that fit the RRd sequence (cyan squares) and that have a slightly atypical period ratio (blue squares). Top-right panel: Color-magnitude diagram for RRc stars (black open circles, see also Fig. 27) and RRd candidates. Bottom-left panel: Frequency spectra of four RRd candidates that fit the RRd sequence (cyan squares in the top panels) after prewhitening with the first overtone and its harmonics. The horizontal axis is scaled with the first-overtone frequency. The signal forming period ratio fitting the RRd sequence is marked with a red dashed line. Bottom-right panel: Same as the bottom-left panel but for RRd candidates that deviate from the RRd sequence (plotted with blue squares in the top panels). The EPIC number is provided in the top-left corner of each panel with a frequency spectrum. Stars in the different panels are identified with a letter in the top-right corner of the frequency spectra plots as well as close to their corresponding points in the top two panels. |
5 Conclusions
We analyzed 3917 light curves of 3057 objects from K2 Campaigns 0–19. We classified 452 stars as RRc stars and performed frequency analysis on them to search for additional phenomena such as the presence of nonradial modes and/or modulation.
The most important results we obtained from these high-accuracy, continuous light curves are the following:
We detected 281 RR0.61 stars. This not only increases the total number of known RR0.61 stars, but most importantly, it significantly increases the number of such stars observed from space. The incidence rate of RR0.61 stars in our sample is 62%;
Aside from the well-known three sequences formed by the RR0.61 stars in the Petersen diagram, we found indications of a fourth sequence at the period ratio of around 0.59. A possible explanation of this sequence would be the harmonics of nonradial modes of degree ℓ = 10;
We detected 67 RR0.68 stars, which constitutes the largest sample of these stars observed by the space telescope. The incidence rate of RR0.68 stars in our sample is 15%;
In 32 stars, we found signals corresponding to both RR0.61 and RR0.68 groups. Such stars are very important from the perspective of simultaneously explaining the nature of RR0.61 and RR0.68 stars;
We found Blazhko modulation in 57 stars where the modulation period is within the data length. In 11 more stars, the amplitude modulation is visible in the light curve, but the period is too long to be covered by the data. The incidence rate is 12.6% in the former case and 15% in the latter;
We found 32 stars with additional signals that put them on or in the vicinity of the RRd sequence in the Petersen diagram. These RRd candidates would feature the fundamental mode with a very low amplitude. However, the classification of them as RRd stars remains uncertain;
We found a new group formed by eight stars in the Petersen diagram around the period ratio of 0.465–0.490. The origin of the additional signals forming this period ratio is unknown;
In 125 stars, we detected signals that either do not fall into the above-mentioned groups or do not correspond to known instrumental signals. For a majority of the stars, the origin of the additional signals remains unknown.
This study represents the most detailed investigation of the mode content of RRc stars via space-based photometry so far. Together with the numerical advancements of the field, we are now able to make asteroseismic inferences for RR Lyrae stars, and we are getting closer to understanding the additional modes observed in them.
Acknowledgements
H.N. has been supported by the ÚNKP-22-4 New National Excellence Program of the Ministry for Culture and Innovation from the source of the National Research, Development and Innovation Fund. This project has been supported by the Lendület Program of the Hungarian Academy of Sciences, project no. LP2018-7/2020, by the ‘SeismoLab’ KKP-137523 Élvonal and NN-129075 grants of the Hungarian Research, Development and Innovation Office (NKFIH). This work uses frequency analysis software written by R. Smolec. This paper includes data collected by the K2 mission. Funding for the Kepler and K2 missions is provided by the NASA Science Mission Directorate. This work has made use of data from the European Space Agency (ESA) mission Gaia, processed by the Gaia Data Processing and Analysis Consortium (DPAC). Funding for the DPAC has been provided by national institutions, in particular the institutions participating in the Gaia Multilateral Agreement. This research has made use of NASA’s Astrophysics Data System (ADS).
Appendix A Dubious classification
For several stars from our sample, the simple classification, as described in Sect. 2, was unambiguous. Those stars are described below:
EPIC 214602901 In this star, we found an additional signal that fits the RR0.61 group. After prewhitening with this signal and its subharmonic, a strong signal unresolved with the first overtone remains in the frequency spectrum. Visual inspection of the light curve showed a decrease in the amplitude, which is not as clear as it is in the Blazhko stars. We checked temporal variations in the amplitude and phase of the first overtone. They clearly show variability and decrease in amplitude, though they are not as periodic as one would expect from Blazhko stars. Classification of this star as a Blazhko remains uncertain.
EPIC 251562169 This star has three close additional signals forming a period ratio of 0.60–0.61 and is classified as RR0.61. However, their corresponding signals are not at subharmonic frequencies. At half of the frequency, that is, close to the frequency range of subharmonic, we found signals, but they have either slightly higher or lower frequencies than expected. Three signals located at this frequency form period ratios of around 0.76, 0.87, and 0.89; therefore, they do not fit well into any other known multimode group.
In this star, we also detected a few additional signals close to the first-overtone frequency. The signals do not form clear multiplets connected to the Blazhko effect. Visual inspection of the light curve did not indicate any kind of modulation. The time variation of the amplitude and the phase of the first overtone are neither periodic enough nor correlated. Therefore, this star was not classified as a Blazhko star.
EPIC 203097870 We detected signals close to the firstovertone frequency and its harmonics in this star, but the signals do not form clear multiplets. We also detected strong signals in the low-frequency range. The light curve showed no clear modulation. However, modulation is visible in the time variation of amplitude and the phase of the first overtone. We note that this star is a likely Blazhko candidate, but due to the complicated frequency spectrum, we have not yet classified this star as Blazhko.
EPIC 214145992 In this star, the highest additional signal, f0.68 = 2.31504082 d−1, corresponds to the RR0.68 group. In the frequency spectrum, we found three more signals. The first one is at the frequency f1 = 4.35728498 d−1, and it would fit the combination frequency between f0.68 and the first overtone, f1O, but in the form 2f1O − f0.68. The simple combination f1O + f0.68 is not present in the frequency spectrum. The signal at f1 = 4.35728498 d−1 is also not likely to be explained by the instrumental signal expected at f ≈ 4.07 d−1. Interestingly, f0.68 and f1 are almost equally spaced with respect to f1O, with a separation of ∆f ≈ 1.02 d−1. Two more additional signals were found at f2 = 7.41474260 d−1 and f3 = 0.74308575. They are likely aliases of the first overtone of separation ∆f ≈ 4.07 d−1.
EPIC 248765005 This star is classified as RR0.68 due to the additional signal at f0.68 = 2.16303756 d−1. Similarly to EPIC 214145992, we found another signal, f1, that would fit the combination with the first-overtone frequency, f1O, in the form 2f1O – f0.68. A combination frequency in the form f1O + f0.68 was not detected. Again, as in the case of EPIC 214145992, the separation between the first overtone and f0.68 and the first overtone and f1 are almost equal, and ∆f ≈ 0.999 d−1. The signal at f1 = 4.16167610 d−1 is close to the position of the possible instrumental signal; however, the instrumental signal is typically located at the frequency ≈ 4.07 d−1.
EPIC 249896645 This star has a very rich frequency spectrum. We detected a signal corresponding to the RR0.68 group, forming a period ratio with the first overtone around 0.684. In the case of the f0.68 signal, we faced the same problem as described in the case of EPIC 214145992 and EPIC 248765005. In the case of this star, the signal f1, forming the puzzling combination 2f1O – f0.68, is located at 3.45198218 d−1; Therefore, the signal cannot be explained with the instrumental signal. The separation between the first-overtone frequency and f0.68 or f1 is ≈ 0.829 d−1.
We also found signals corresponding to the RR0.61 group. Four signals were detected in the frequency range of interest. They form period ratios of 0.608, 0.621, 0.634, and 0.585. Notably, only the signal corresponding to the lowest period ratio has a corresponding subharmonic at half of its frequency.
Close to the frequency range of subharmonics, we detected another signal that forms a period ratio with the first overtone of around 0.768, so it does not fit any particular group in the Petersen diagram. Another detected additional signal is located at f = 1.47 d−1, and it forms a period ratio of around 0.56, which also does not correspond to any known multimode group.
We also detected many signals close to the first-overtone frequency, f1O = 2.62337858 d−1, namely, signals at fa = 2.63698090 d−1, fb = 2.74156059 d−1, f = 2.68927643 d−1, fd = 2.40492376 d−1, and fe = 2.84183339 d−1. The signals do not form simple multiplets that can be immediately connected with the Blazhko modulation. However, visual inspection of the light curve showed slight amplitude change.
EPIC 251248707 In this star, we detected the Blazhko side-peaks and two independent additional signals. The additional signal of the highest amplitude, f1, forms a period ratio with the first-overtone period of 0.597. We also detected a signal that can be interpreted as a linear combination in the form f1 + f1O. The second additional signal, f2, forms a period ratio with the first overtone around 0.685. However, it could be also explained as a linear combination in the form f1 – f1O. The frequency of such a linear combination is unresolved with the detected signal, f2. The frequency difference between f2 and the calculated frequency of the linear combination corresponds to 30 days, whereas the data length is 47 days. We classified this star as an RR0.61.
EPIC201552850 This star is classified as an RR0.68 star. It also shows clear modulation in the light curve. The modulation is likely multiperiodic, with the longest period being too long for the used data. We included this star in the Blazhko group as well (Table 4) but only used its period of modulation that is covered by the data. We note that the multiperiodic modulation visible in the light curve results in the complex structure of the frequency spectrum involving sidepeaks unresolved with the first overtone, and therefore these sidepeaks are not prewhitened during the analysis.
EPIC210740526 This star is a member of the RR0.61 and RR0.68 groups. It also shows many signals close to the firstovertone frequency that do not form simple multiplets. Time variations of amplitude and phase of the first overtone are present; however, they are not periodic enough to indicate the Blazhko effect. Longer data coverage would be necessary to draw any conclusions.
References
- Alcock, C., Alves, D. R., Becker, A., et al. 2003, ApJ, 598, 597 [NASA ADS] [CrossRef] [Google Scholar]
- Benkő, J. M., Kolenberg, K., Szabó, R., et al. 2010, MNRAS, 409, 1585 [CrossRef] [Google Scholar]
- Benkő, J. M., Szabó, R., & Paparó, M. 2011, MNRAS, 417, 974 [CrossRef] [Google Scholar]
- Benkő, J. M., Plachy, E., Szabó, R., Molnár, L., & Kolláth, Z. 2014, ApJS, 213, 31 [CrossRef] [Google Scholar]
- Benkő, J. M., Sódor, Á., & Pál, A. 2021, MNRAS, 500, 2554 [Google Scholar]
- Blažko, S. 1907, Astron. Nachr., 175, 325 [Google Scholar]
- Bódi, A., Szabó, P., Plachy, E., et al. 2022, PASP, 134, 014503 [CrossRef] [Google Scholar]
- Bovy, J., Rix, H.-W., Green, G. M., Schlafly, E. F., & Finkbeiner, D. P. 2016, ApJ, 818, 130 [Google Scholar]
- Carrell, K., Wilhelm, R., Olsen, F., et al. 2021, ApJ, 916, L12 [NASA ADS] [CrossRef] [Google Scholar]
- Chadid, M. 2012, A&A, 540, A68 [NASA ADS] [CrossRef] [EDP Sciences] [Google Scholar]
- Chadid, M., Benkő, J. M., Szabó, R., et al. 2010, A&A, 510, A39 [NASA ADS] [CrossRef] [EDP Sciences] [Google Scholar]
- Clementini, G., Ripepi, V., Garofalo, A., et al. 2023, A&A, 674, A18 [NASA ADS] [CrossRef] [EDP Sciences] [Google Scholar]
- Dziembowski, W. 1977, Acta Astron., 27, 95 [NASA ADS] [Google Scholar]
- Dziembowski, W. A. 2016, Commmun. Konkoly Observatory Hungary, 105, 23 [NASA ADS] [Google Scholar]
- Forró, A., Szabó, R., Bódi, A., & Császár, K. 2022, ApJS, 260, 20 [CrossRef] [Google Scholar]
- Gruberbauer, M., Kolenberg, K., Rowe, J. F., et al. 2007, MNRAS, 379, 1498 [NASA ADS] [CrossRef] [Google Scholar]
- Hernitschek, N., Cohen, J. G., Rix, H.-W., et al. 2019, ApJ, 871, 49 [NASA ADS] [CrossRef] [Google Scholar]
- Howell, S. B., Sobeck, C., Haas, M., et al. 2014, PASP, 126, 398 [Google Scholar]
- Huber, D., Bryson, S. T., Haas, M. R., et al. 2016, ApJS, 224, 2 [Google Scholar]
- Jurcsik, J., Clement, C., Geyer, E. H., & Domsa, I. 2001, AJ, 121, 951 [Google Scholar]
- Jurcsik, J., Sódor, Á., Hurta, Z., et al. 2008, MNRAS, 391, 164 [NASA ADS] [CrossRef] [Google Scholar]
- Jurcsik, J., Sódor, Á., Szeidl, B., et al. 2009, MNRAS, 400, 1006 [NASA ADS] [CrossRef] [Google Scholar]
- Jurcsik, J., Smitola, P., Hajdu, G., & Nuspl, J. 2014, ApJ, 797, L3 [NASA ADS] [CrossRef] [Google Scholar]
- Jurcsik, J., Smitola, P., Hajdu, G., et al. 2015, ApJS, 219, 25 [NASA ADS] [CrossRef] [Google Scholar]
- Kolenberg, K., Szabó, R., Kurtz, D. W., et al. 2010, ApJ, 713, L198 [NASA ADS] [CrossRef] [Google Scholar]
- Kolláth, Z. 2021, ASP Conf. Ser., 529, 117 [Google Scholar]
- Kovacs, G. 2016, Commmun. Konkoly Observatory Hungary, 105, 61 [NASA ADS] [Google Scholar]
- Kuehn, C. A., Moskalik, P., & Drury, J. A. 2017, Eur. Phys. J. Web Conf., 160, 04011 [CrossRef] [EDP Sciences] [Google Scholar]
- Kurtz, D. W., Bowman, D. M., Ebo, S. J., et al. 2016, MNRAS, 455, 1237 [NASA ADS] [CrossRef] [Google Scholar]
- Lindegren, L., Klioner, S. A., Hernández, J., et al. 2021, A&A, 649, A2 [EDP Sciences] [Google Scholar]
- Marconi, M., Coppola, G., Bono, G., et al. 2015, ApJ, 808, 50 [Google Scholar]
- Mizerski, T. 2003, Acta Astron., 53, 307 [NASA ADS] [Google Scholar]
- Molnár, L., Kolláth, Z., Szabó, R., et al. 2012, ApJ, 757, L13 [CrossRef] [Google Scholar]
- Molnár, L., Szabó, R., Moskalik, P. A., et al. 2015, MNRAS, 452, 4283 [CrossRef] [Google Scholar]
- Molnár, L., Bódi, A., Pál, A., et al. 2022, ApJS, 258, 8 [CrossRef] [Google Scholar]
- Moskalik, P. 2013, Astrophys. Space Sci. Proc., 31, 103 [NASA ADS] [CrossRef] [Google Scholar]
- Moskalik, P., & Poretti, E. 2003, A&A, 398, 213 [NASA ADS] [CrossRef] [EDP Sciences] [Google Scholar]
- Moskalik, P., Smolec, R., Kolenberg, K., et al. 2015, MNRAS, 447, 2348 [NASA ADS] [CrossRef] [Google Scholar]
- Netzel, H., & Smolec, R. 2019, MNRAS, 487, 5584 [NASA ADS] [CrossRef] [Google Scholar]
- Netzel, H., & Smolec, R. 2022, MNRAS, 515, 3439 [NASA ADS] [CrossRef] [Google Scholar]
- Netzel, H., Smolec, R., & Dziembowski, W. 2015, MNRAS, 451, L25 [NASA ADS] [CrossRef] [Google Scholar]
- Netzel, H., Smolec, R., Soszynski, I., & Udalski, A. 2018, MNRAS, 480, 1229 [NASA ADS] [Google Scholar]
- Pietrzyński, G., Thompson, I. B., Gieren, W., et al. 2012, Nature, 484, 75 [CrossRef] [Google Scholar]
- Plachy, E., Klagyivik, P., Molnár, L., & Szabó, R. 2017, Eur. Phys. J. Web Conf., 160, 04010 [CrossRef] [EDP Sciences] [Google Scholar]
- Plachy, E., Molnár, L., Bódi, A., et al. 2019, ApJS, 244, 32 [CrossRef] [Google Scholar]
- Plachy, E., Pál, A., Bódi, A., et al. 2021, ApJS, 253, 11 [NASA ADS] [CrossRef] [Google Scholar]
- Poretti, E., Paparó, M., Deleuil, M., et al. 2010, A&A, 520, A108 [NASA ADS] [CrossRef] [EDP Sciences] [Google Scholar]
- Prudil, Z., Smolec, R., Skarka, M., & Netzel, H. 2017, MNRAS, 465, 4074 [Google Scholar]
- Rathour, R. S., Smolec, R., & Netzel, H. 2021, MNRAS, 505, 5412 [NASA ADS] [CrossRef] [Google Scholar]
- Simon, N. R., & Lee, A. S. 1981, ApJ, 248, 291 [NASA ADS] [CrossRef] [Google Scholar]
- Smolec, R., Soszyński, I., Udalski, A., et al. 2015, MNRAS, 447, 3756 [Google Scholar]
- Smolec, R., Prudil, Z., Skarka, M., & Bakowska, K. 2016, MNRAS, 461, 2934 [NASA ADS] [CrossRef] [Google Scholar]
- Smolec, R., Moskalik, P., Kałuzny, J., et al. 2017, MNRAS, 467, 2349 [NASA ADS] [Google Scholar]
- Soszyński, I., Udalski, A., Szymański, M. K., et al. 2010, Acta Astron., 60, 165 [Google Scholar]
- Soszyński, I., Udalski, A., Szymański, M. K., et al. 2014, Acta Astron., 64, 177 [NASA ADS] [Google Scholar]
- Soszyński, I., Smolec, R., Dziembowski, W. A., et al. 2016, MNRAS, 463, 1332 [Google Scholar]
- Soszyński, I., Udalski, A., Wrona, M., et al. 2019, Acta Astron., 69, 321 [Google Scholar]
- Süveges, M., & Anderson, R. I. 2018, MNRAS, 478, 1425 [CrossRef] [Google Scholar]
- Szabó, R., Kolláth, Z., Molnár, L., et al. 2010, MNRAS, 409, 1244 [CrossRef] [Google Scholar]
- Szabó, R., Benkő, J. M., Paparó, M., et al. 2014, A&A, 570, A100 [NASA ADS] [CrossRef] [EDP Sciences] [Google Scholar]
- Udalski, A., Szymański, M. K., & Szymański, G. 2015, Acta Astron., 65 1 [NASA ADS] [Google Scholar]
All Tables
All Figures
|
Fig. 1 Positions of RR Lyrae candidates and classified RRc stars in sky coordinates. RR Lyrae candidates are plotted with black symbols. Stars classified as RRc are plotted with red symbols. |
| In the text | |
|
Fig. 2 Fourier coefficient R21 as a function of period of pulsation. RR Lyrae candidates are plotted with black open circles. Filled black circles correspond to stars classified as RRc. For a reference, we plotted RRab and RRc stars observed by the OGLE project toward the Galactic bulge with light blue and orange points (Soszyński et al. 2014). |
| In the text | |
|
Fig. 3 Amplitude (blue) and phase (red) changes over time in two stars with detection of signals close to the first-overtone frequency. Top panel: amplitude and phase changes of EPIC 248553635. This star was classified as Blazhko. Bottom panel: amplitude and phase changes of EPIC 212595129. This star was not classified as Blazhko. |
| In the text | |
|
Fig. 4 Distribution of observed brightness in Kp band (top panel) and first-overtone period (bottom panel) for stars classified as RRc (blue solid line). With a red dashed line, we plotted the distributions for RRc stars in which we detected additional low-amplitude signals. We also provide the incidence rate of RRc stars with the additional signals for each bin of both distributions. The error was calculated assuming Poisson distribution (see e.g. Alcock et al. 2003). |
| In the text | |
|
Fig. 5 Petersen diagram for RR0.61 stars. Signals detected in the same star are connected with a line. Right panel: Histogram of period ratios. |
| In the text | |
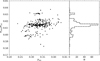 |
Fig. 6 Same as Fig. 5 but only for the single additional signal of the highest amplitude. |
| In the text | |
|
Fig. 7 Frequency spectrum for EPIC 228763070 after prewhitening with the first overtone and its harmonics. Positions of the prewhitened signals are marked with red dashed lines. The highest additional signals present in the frequency spectrum are marked with arrows and are labeled. |
| In the text | |
|
Fig. 8 Examples of frequency spectra for eight RR0.61 stars for a frequency range corresponding to f0.61 signals. The horizontal axis is scaled with the first-overtone periods. The star’s ID is provided in the upper-left corner of each panel. |
| In the text | |
|
Fig. 9 Frequency spectrum examples for six RR0.61 stars. For each star, the top, middle, and lower panels show the frequency ranges corresponding to the f0.61, 0.5f0.61, and 1.5f0.61 signals, respectively. The horizontal axis is scaled with the first-overtone periods. The EPIC numbers are provided in the upper-left corner of the top panel. |
| In the text | |
|
Fig. 10 Distribution of amplitude ratio of subharmonic at 0.5f0.61 and signal at f0.61. |
| In the text | |
|
Fig. 11 Petersen diagram for RR0.68 stars. Stars detected in the K2 data are plotted with red squares. Stars from the OGLE sample are plotted with black circles. Right panel: histogram of period ratios for the two samples. |
| In the text | |
|
Fig. 12 Histogram of periods of the additional signal for RR0.68 stars detected in the K2 data (red solid line) and in the OGLE data (black dashed line). |
| In the text | |
|
Fig. 13 Frequency spectrum for EPIC 249784033 after prewhitening with the first overtone and its harmonics. The positions of the first overtone and the harmonics are marked with red dashed lines. The most important signals are marked with arrows and labeled. |
| In the text | |
|
Fig. 14 RRc stars with visible Blazhko modulation in the light curve. |
| In the text | |
|
Fig. 15 Histogram of the Blazhko periods. |
| In the text | |
|
Fig. 16 Histogram of the relative modulation for stars with triplets or multiplets detected (BL2) or doublets (BL1). |
| In the text | |
|
Fig. 17 Distribution of the Q parameter (see Eq. (4)) for BL2 stars (black solid line). BL1 stars are plotted with red dashed lines (see text for details). |
| In the text | |
|
Fig. 18 Petersen diagram for additional unknown signals in studied RRc stars. We used red diamonds to indicate if the additional detected signal has a period longer than the first-overtone period and black squares if otherwise. We also plotted RR0.61 and RR0.68 stars identified in this study using purple circles. For comparison, we plotted known multiperiodic groups: RRd stars (green points; Soszyński et al. 2019), fundamental and second overtone (F+2O) stars (yellow pluses; Jurcsik et al. 2008; Poretti et al. 2010; Chadid et al. 2010; Benkő et al. 2010, 2014), peculiar RRd (pRRd) stars (cyan triangles; Prudil et al. 2017), and RR0.61 and RR0.68 from the Galactic bulge (orange crosses and blue diamonds, respectively; Netzel & Smolec 2019). |
| In the text | |
|
Fig. 19 Frequency spectrum for EPIC 249630037 after prewhitening with the first overtone and its harmonics. The positions of the first overtone and its harmonics are marked with red dashed lines. The blue dashed line corresponds to the location of the f0.68 signal (which was not detected in this star). With a blue region, we marked the frequency range of the f0.61 signal, and with an orange region, we marked the corresponding frequency range of the subharmonic. With a blue arrow, we marked the signal that forms a period ratio that fits the RRd sequence. |
| In the text | |
|
Fig. 20 Petersen diagram for RRd stars (gray points) and anomalous RRd stars (black crosses; Soszyński et al. 2019). With red squares, we plotted stars from this study for which we found additional signals that fit the RRd group in the Petersen diagram. |
| In the text | |
|
Fig. 21 Frequency spectra of eight stars with additional signals of unknown origin forming a period ratio of around 0.47–0.49. The horizontal axis is scaled with a first-overtone frequency. Red boxes indicate the position of signals forming a period ratio in the range of 0.467–0.488. In the upper-left corner of each panel, we provide the star’s EPIC number, and in the upper-right corner, we provide the classification. If no classification is given, only the unknown signals were detected. |
| In the text | |
|
Fig. 22 Distribution of first-overtone periods for RRc (black solid line) and RR0.61 stars (red dashed line). Incidence rates of RR0.61 stars are given for each bin. The errors were calculated assuming Poisson distribution (e.g. Alcock et al. 2003). |
| In the text | |
|
Fig. 23 Petersen diagram for RR0.61 stars together with theoretical models for RR Lyrae stars calculated with the Warsaw envelope code (Dziembowski 1977). Only the highest amplitude additional signals (black symbols) are plotted for the RR0.61 stars. For the modeled period ratios, we used the first harmonics of nonradial modes of the given degrees. |
| In the text | |
|
Fig. 24 Petersen diagram for RR0.61 stars together with RR0.68 stars using the combination signal, f1O + f0.68, to calculate the period ratio. Open symbols correspond to RR0.68 stars for which we did not detect the combination signal in the frequency spectrum. Filled symbols correspond to stars for which the combination signal was detected. Pure RR0.68 stars are plotted with blue circles. Stars that are both RR0.68 and RR0.61 are plotted with red triangles. |
| In the text | |
|
Fig. 25 Distribution of first-overtone periods for RRc (black solid line) and RR0.68 stars (red dashed line). The incidence rate of RR0.68 stars is given for each bin. The errors were calculated assuming Poisson distribution (e.g. Alcock et al. 2003). |
| In the text | |
|
Fig. 26 Distribution of first-overtone periods for RRc (black solid line) and Blazhko stars (red dashed line). The incidence rate of Blazhko stars is given for each bin. The errors were calculated assuming Poisson distribution (e.g. Alcock et al. 2003). |
| In the text | |
|
Fig. 27 Color-magnitude diagrams. Top panel: Color-magnitude diagram of 53 stars from the bright end of the sample. Presence of additional modes are marked with dark outlines (f0.61) and crosses (f0.68). The RRd candidate stars are marked with squares. Bottom panel: CMD of the TESS observations published by Molnár et al. (2022), for comparison. Here, RRab stars are indicated with red symbols. |
| In the text | |
|
Fig. 28 Amplitude ratio of Fourier first-overtone amplitude and the amplitude of the additional signal for RRd candidates (see text for details). The period ratio of the two frequencies is plotted with different colors as indicated in the legend. The RRd candidates are plotted with squares. We also included RRd and aRRd stars from the Galactic bulge, which are plotted with circles and crosses, respectively (Soszyński et al. 2019). Right panel: Distribution of the amplitude ratio. |
| In the text | |
|
Fig. 29 Petersen diagram, color-magnitude diagram, and frequency spectra for eight RRd candidates. Top-left panel: Petersen diagram showing an RRd sequence (gray points), anomalous RRd stars (black crosses), and RRd candidates that fit the RRd sequence (cyan squares) and that have a slightly atypical period ratio (blue squares). Top-right panel: Color-magnitude diagram for RRc stars (black open circles, see also Fig. 27) and RRd candidates. Bottom-left panel: Frequency spectra of four RRd candidates that fit the RRd sequence (cyan squares in the top panels) after prewhitening with the first overtone and its harmonics. The horizontal axis is scaled with the first-overtone frequency. The signal forming period ratio fitting the RRd sequence is marked with a red dashed line. Bottom-right panel: Same as the bottom-left panel but for RRd candidates that deviate from the RRd sequence (plotted with blue squares in the top panels). The EPIC number is provided in the top-left corner of each panel with a frequency spectrum. Stars in the different panels are identified with a letter in the top-right corner of the frequency spectra plots as well as close to their corresponding points in the top two panels. |
| In the text | |
Current usage metrics show cumulative count of Article Views (full-text article views including HTML views, PDF and ePub downloads, according to the available data) and Abstracts Views on Vision4Press platform.
Data correspond to usage on the plateform after 2015. The current usage metrics is available 48-96 hours after online publication and is updated daily on week days.
Initial download of the metrics may take a while.