Fig. 19
Download original image
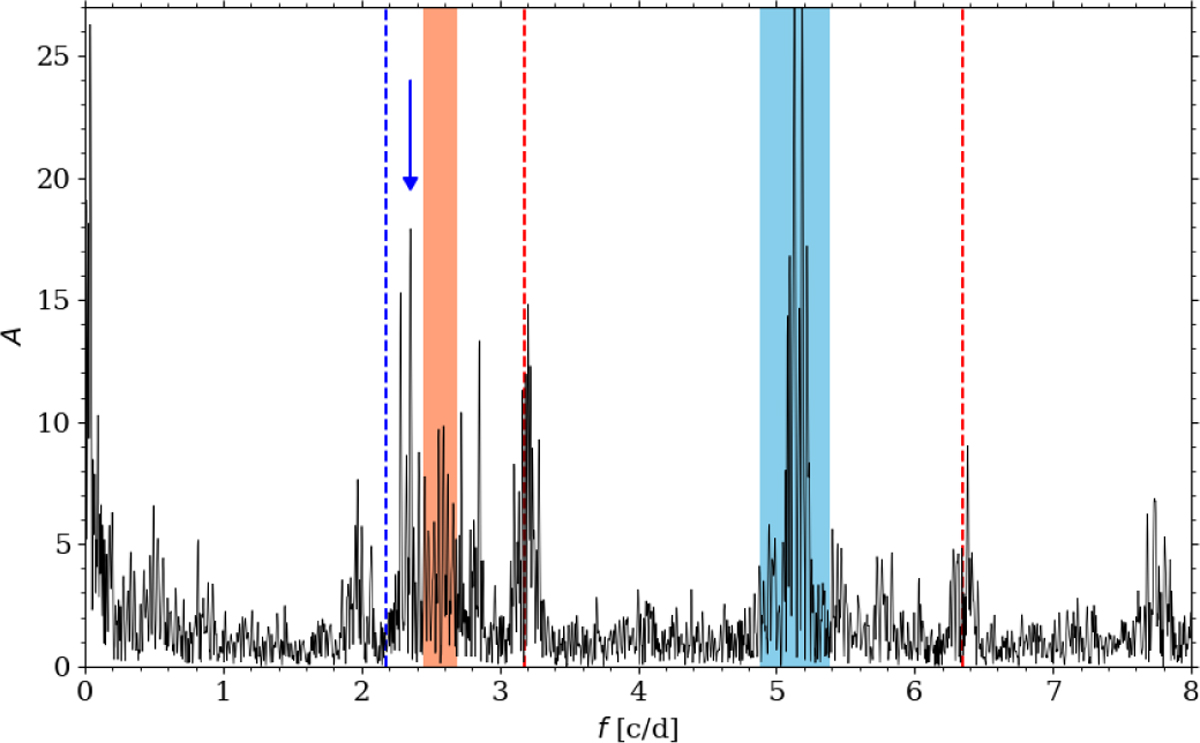
Frequency spectrum for EPIC 249630037 after prewhitening with the first overtone and its harmonics. The positions of the first overtone and its harmonics are marked with red dashed lines. The blue dashed line corresponds to the location of the f0.68 signal (which was not detected in this star). With a blue region, we marked the frequency range of the f0.61 signal, and with an orange region, we marked the corresponding frequency range of the subharmonic. With a blue arrow, we marked the signal that forms a period ratio that fits the RRd sequence.
Current usage metrics show cumulative count of Article Views (full-text article views including HTML views, PDF and ePub downloads, according to the available data) and Abstracts Views on Vision4Press platform.
Data correspond to usage on the plateform after 2015. The current usage metrics is available 48-96 hours after online publication and is updated daily on week days.
Initial download of the metrics may take a while.