| Issue |
A&A
Volume 680, December 2023
|
|
|---|---|---|
| Article Number | L6 | |
| Number of page(s) | 6 | |
| Section | Letters to the Editor | |
| DOI | https://doi.org/10.1051/0004-6361/202348062 | |
| Published online | 11 December 2023 | |
Letter to the Editor
Similar additional frequency patterns on fundamental- and overtone-mode RR Lyrae stars showing f68 frequencies
1
Konkoly Observatory, HUN-REN Research Centre for Astronomy and Earth Sciences; MTA Centre of Excellence, Konkoly Thege u. 15-17, 1121 Budapest, Hungary
e-mail: This email address is being protected from spambots. You need JavaScript enabled to view it.
2
Department of Astronomy, Institute of Geography and Earth Sciences, ELTE Eötvös Loránd University, Pázmány Péter sétány 1/A, 1117 Budapest, Hungary
Received:
25
September
2023
Accepted:
19
November
2023
Abstract
Context. Until now, it has been accepted that the additional frequencies in the fundamental-(RRab) and overtone-mode pulsating (RRc and RRd) RR Lyrae stars are of a different nature. RRab stars show frequencies associated with periodic doubling, as well as frequencies at the first and second radial overtones, and linear combinations of these. RRc stars show frequencies with specific ratios (f1/fx ∼ 0.61 or ∼0.63), which are explained by non-radial modes, and frequencies with a ratio of fx/f1 ∼ 0.68, for which there is currently no accepted explanation.
Aims. To search for similarities in spectral content, we compared the recently published Fourier spectra of TESS and K2 RRc stars with the spectra of Kepler RRab stars that do not show the Blazhko effect but contain additional frequencies.
Methods. We analysed the time series data using standard Fourier methods, and also investigated the possibility of excitation of the second radial overtone mode in RRab stars using numerical hydrodynamical codes.
Results. We show that the additional frequencies appear in non-Blazhko RRab stars at the position of the second radial overtone mode, and the pattern they create is very similar to that caused by the additional frequencies with the period ratio of ∼0.68 in RRc stars. The formerly raised hypothesis that the additional frequencies of these RRab stars are due to a second radial overtone is unlikely.
Key words: space vehicles / stars: variables: RR Lyrae / techniques: photometric / stars: oscillations / methods: data analysis
© The Authors 2023
 Open Access article, published by EDP Sciences, under the terms of the Creative Commons Attribution License (https://creativecommons.org/licenses/by/4.0), which permits unrestricted use, distribution, and reproduction in any medium, provided the original work is properly cited.
This article is published in open access under the Subscribe to Open model. This email address is being protected from spambots. You need JavaScript enabled to view it. to support open access publication.
1. Introduction
In the last two decades, our view of stars pulsating in the classical instability strip (e.g. Cepheides, RR Lyrae stars) has changed fundamentally. Thanks to the photometric space missions MOST (Walker et al. 2003), CoRoT (Baglin et al. 2006), Kepler/K2 (Borucki et al. 2010; Howell et al. 2014), and TESS (Ricker et al. 2015), as well as the ground-based survey OGLE (Udalski et al. 2015), a number of millimagnitude-level brightness variations have been detected in these stars. The frequencies that describe these brightness changes are usually called additional frequencies. As the focus of this paper is on RR Lyrae stars, other groups of the instability strip showing similar additional frequencies (e.g. classical Cepheids, anomalous Cepheids, Pop II Cepheids, etc.) are not discussed here. We also do not discuss the frequency patterns caused by the Blazhko effect (long-period amplitude and phase variation of the light curve; for a review, see for example Kovács 2009; Smolec 2016). Other authors have already reviewed the additional frequencies of RR Lyrae stars (see e.g. Molnár et al. 2017 or Plachy & Szabó 2021); we only briefly summarise the current understanding.
The first frequency that did not fit into the previously known frequency structure of RR Lyrae stars was detected by Gruberbauer et al. (2007) from the MOST data of the double-mode (RRd) star AQ Leo. Later, similar frequencies were found in other RRd stars, and in many RRc stars that pulsate purely in the overtone mode (Olech & Moskalik 2009; Chadid 2012; Szabó et al. 2014; Moskalik et al. 2015). After analysing the large number of RR Lyrae stars of the OGLE survey, it became clear that these frequencies are located in three horizontal roughly parallel sequences on the Petersen diagram, where the frequency ratio f1/fx of each sequence is 0.613, 0.622, and 0.631, respectively (Netzel et al. 2015; Netzel & Smolec 2019); from now on, these frequencies are referred to as f61, f62, and f63. In the meantime, a theoretical explanation has been put forward by Dziembowski (2016), namely that the frequencies f61 and f63 belong to non-radial modes ℓ = 9 and ℓ = 8, respectively, while f62 is a linear combination frequency. The frequencies of the modes themselves are 0.5f61 and 0.5f63. This picture was confirmed by further theoretical and observational studies (Netzel & Kolenberg 2021; Netzel & Smolec 2022; Molnár et al. 2022; Benkő et al. 2023; Netzel et al. 2023).
A further group of additional frequencies has been discovered in RRc stars (Netzel et al. 2015; Moskalik et al. 2015). The ratio of these frequencies is f1/fx ≈ 1.46 or fx/f1 ≈ 0.68 (hereafter as f68 frequencies.) The f68 frequencies are not only lower than the dominant f1, but are also lower than the fundamental frequencies of the stars in question; they can appear alone or in combination with the aforementioned f61, f63 frequencies. Currently, there is no theoretical explanation for their presence.
RRab stars may also contain additional frequencies, but these are different from those we mention above. The first additional frequencies on an RRab star were found in the CoRoT data of V1127 Aql, which also shows a strong Blazhko effect (Chadid et al. 2010). The Kepler space telescope data for other Blazhko RRab stars have made it clear that these frequencies are associated with the period doubling (PD) phenomenon (Kolenberg et al. 2010; Szabó et al. 2010). In the case of RR Lyrae light curves, PD appears as an alternation of cycles with smaller and larger amplitudes, causing half-integer frequencies (f0/2, 3f0/2, etc.) in the Fourier spectra, where f0 is the frequency of the radial fundamental mode. Hydrodynamic calculations have shown that, for RR Lyrae stars, the PD is caused by a 9:2 resonance of the fundamental mode and the ninth radial overtone (Kolláth et al. 2011). So far, PD has not been detected in either RRc or RRd stars, and has only been found in the RRab stars that also show the Blazhko effect. The theoretical works have also suggested that the PD and the Blazhko effect may be related to each other (Buchler & Kolláth 2011; Kolláth et al. 2011).
In addition to the PD frequencies, some RRab stars show other low-amplitude frequencies near the first and/or second radial overtones (Benkő et al. 2010); hereafter, we denote these by f1 and f2, respectively. These frequencies were later also identified in ground-based observations (Sódor et al. 2012; Smolec et al. 2016; Zalian et al. 2016), and in the CoRoT, Kepler/K2, and TESS samples (Szabó et al. 2014; Benkő et al. 2014, 2016; Molnár et al. 2015, 2022). Hydrodynamic calculations have been used to produce models in which the fundamental mode and the first and ninth overtones appear simultaneously in a triple resonance state. This provides a possible theoretical explanation for stars exhibiting both PD and f1 (Molnár et al. 2012). However, despite an intensive search, similar models have not been found for the f2 cases. Using linear models, Soszyński et al. (2016) showed that, for sufficiently high metallicity, parametric resonance can generate states in which the fundamental, first, and second overtones are excited simultaneously. These models could be suitable for a fraction of observed stars, but not all. However, Dziembowski & Cassisi (1999) showed that the non-radial modes associated with ℓ = 1 are most likely excited near the radial modes (ℓ = 0); that is, both f1 and f2 additional frequencies could be those of the non-radial modes.
Until now, it appeared that the additional frequency content of the fundamental- and overtone-mode RR Lyrae stars was different, with patterns belonging to PD, f1, and f2 frequencies in RRab stars, and patterns belonging to the frequencies f61, f63, and f68 in RRc and RRd stars.
2. The sample
The Blazhko effect produces characteristic patterns of many peaks in the Fourier spectra. The additional frequencies also have distinctive patterns, with many harmonics and linear combinations with the main pulsation frequency. To ensure that the two structures do not interfere with each other, we focus on the additional frequencies of the non-Blazhko stars.
2.1. RRab stars with f2 frequencies
Few RRab stars are known that are unlikely to show the Blazhko effect, but additional frequencies do appear in their Fourier spectra. Long time series are required to rule out the Blazhko effect, and precise measurements are needed to detect additional frequencies on millimagnitude scales. Not even all space photometric data fulfil both conditions.
The first two non-Blazhko RRab stars in which additional frequencies were detected were V350 Lyr and KIC 7021124 (Benkő et al. 2010; Nemec et al. 2011). The frequency of the second radial overtone mode f2 and its linear combination were identified for both stars. However, later, a very weak Blazhko effect was detected for both stars (Benkő & Szabó 2015), and so these stars were not analysed further. Molnár et al. (2015) found that EPIC 60018644 may also be a non-Blazhko star with an additional frequency pattern. As this was obtained from the commissioning phase (C0) data of K2, with a length of only 8.9 days, the Blazhko effect cannot be ruled out. The highest-amplitude additional frequency is shorter than the fundamental mode frequency and is therefore referred to as a g-mode frequency fg. Harmonics and linear combinations of this frequency also appear in the Fourier spectrum.
A systematic study of the Kepler non-Blazhko RRab stars has found further stars with additional frequency structures: V1510 Cyg, V346 Lyr, V894 Cyg, and KIC 9658012. In all of them, the f2 frequency and its combinations were identified (Benkő et al. 2019). Due to the short data series, the signal-to-noise ratio of the frequencies of EPIC 60018644 is much lower than in the spectra of the Kepler stars, but their similar patterns are still evident (see Fig. 2 in Benkő & Szabó 2015 and Fig. 11 in Molnár et al. 2015, respectively). Some important parameters of our RRab sample are summarised in Table 1. The precision of the numeric values (where not specifically shown) is indicated by the number of significant digits plus one. This convention has also been applied to subsequent tables.
Non-Blazhko Kepler/K2 RRab stars showing f2 additional frequencies.
2.2. RRc stars showing f68 frequencies
As in the case of RRab stars, we intend to separate the different frequency patterns as much as possible. To do this, only those non-Blazhko RRc stars are considered; these do not show the f61/f63 frequencies either. The CoRoT and the original Kepler samples do not contain such ‘clear’ cases; however, the works on TESS and K2 RRc stars identified a significant number of such stars (Benkő et al. 2023; Netzel et al. 2023). From the TESS sample, 23 stars were selected that contain both the f68 frequency and at least one linear combination of f68 and f1. Uncertain and blended cases were excluded, as were stars where only the f68 frequency is significant. Some parameters of the sample are shown in Table A.1. We identified nine of the K2 RRc stars in the work of Netzel et al. (2023) that met our criteria (listed in Table A.2).
Our sample of RRc stars is larger than our RRab sample. However, it should be noted that only two stars (Gaia DR2 5482545510194122112 and Gaia DR2 4628067852624828672) in the TESS continuous viewing zone have a data set of comparable length to the four years of Kepler data.
3. The result
Let us compare the frequency content of the RRab and RRc samples described above. We presented the Fourier spectra of Kepler RRab stars in our previous works (Benkő & Szabó 2015; Benkő et al. 2019) and have adopted them here. The underlying photometric time series are available for download1. The residual spectra of the Kepler stars in Table 1 are shown in the top four panels of Fig. 1. These spectra were produced from the data series from which the main period and all its significant harmonics were prewhitened. The spectrum of the K2 star EPIC 60018644 is given in Fig. 11 of Molnár et al. (2015), and is not repeated here. As shown in Table 1, the period increases from top to bottom. For ease of comparison, the relative frequencies f/f0 are plotted on the horizontal scales.
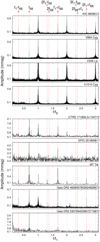 |
Fig. 1. Residual spectra of non-Blazhko RRab and RRc stars after the dominant pulsation frequency and its harmonics are prewhitened from the data. The top four panels show the Kepler RRab stars of Table 1, while the bottom five panels illustrate the spectra of RRc stars. The blue dotted and red dashed lines show the positions of the (prewhitened) harmonics and the possible positions of the additional frequencies, respectively. The frequency identification at the top of the figure refers to the RRc stars with f68 frequencies (shown in the bottom five panels), but a similar structure is also seen in our RRab stars (in the top four panels). |
The Fourier spectra of TESS RRc stars are taken from the work of Benkő et al. (2023). For the K2 RRc stars in Table A.2, following Netzel et al. (2023), we downloaded the Automated Extended Aperture Photometry data (Bódi et al. 2022) than the spectra were calculated using the Period04 program (Lenz & Breger 2005). The lower five panels of Fig. 1 show the residual spectra of some RRc stars. Stars with different parameters have been selected to represent different observed cases. We include the spectra of both the brightest (MT Tel, Tmag = 8.757 mag) and the faintest star (EPIC 251809817,  mag) from our sample2. Similarly, the spectra of the shortest- and longest-period stars are shown: CTRS 171806.3+134713, P1 = 0.27933 d, and Gaia DR2 5307694509672719872, P1 = 0.376984 d. Gaia DR2 4628067852624828672 is included here as the RRc star with the two longest TESS data sets, with a spectrum that not only has an outstandingly good signal-to-noise ratio, but also the richest additional frequency pattern. Relative frequencies (f/f1) are shown on the horizontal scale.
As can be seen in Fig. 1, the additional frequencies are located at the same positions on this relative frequency scale for both RRab and RRc stars. At the top of the figure, we have assigned to these positions the identifications adopted for RRc stars. For RRab stars, the frequency at the position of f0 + f68 is usually considered as the primary frequency and is identified as the second overtone frequency f2. More quantitatively, the average period ratio f68/f1 for TESS and K2 RRc samples is 0.684 ± 0.004 and 0.685 ± 0.003, respectively, while for RRab stars the (f2 − f0)/f0 ratio is 0.686 ± 0.001. That is, all three samples show the same ratio within 1σ error. This raises the possibility that the frequencies with a ratio of ∼0.68 are the primary ones for RRab stars too. Hereafter, these frequencies are denoted  = (f2 − f0).
4. Discussion
Modelling input parameters of the studied stars.
Let us now investigate the Fourier spectra in the framework of the above paradigm; that is, assuming that for both RRab and RRc stars, the f68 and  are the primary frequencies. In all cases, the stars show the linear combination of f68 and
  as frequencies f59 = f68 + f1 and
  =
=  + f0. The f1 − f68 (and f0 −
  ) combinations also appear in many stars but not always. It seems to be generally true that the amplitude of the combinations of differences is smaller than that of the combinations of sums, that is, A(kf1 + jf68)> A(kf1 − jf68), where k, j are positive integers and k ≥ j. Fewer linear combinations with higher harmonics appear in the spectra of RRc stars. This is possibly because these stars have much more sinusoidal light curves than RRab stars; that is, the higher harmonics carry much less power, and therefore the linear combinations with these harmonics drop below the significance level very quickly.
The f68 frequencies are known to be relatively coherent (Netzel & Smolec 2019; Benkő et al. 2023). Using the amplitude and phase variation calculation tool of Period04, each RRab time series was cut into slices of 10 and 7 days, and the amplitudes and phases of  were determined for each slice. For all RRab stars, both amplitude and phase were found to be constant within the estimated error. This behaviour is an another similarity between the f68 and
  frequencies.
The amplitudes of the f68 and  frequencies are larger than those of the f59 and
  frequencies, with the exception of KIC 9658012, for which the amplitude of the
  frequency is smaller (see Col. 5 in Table 1 and Col. 4 in Tables A.1 and A.2). It is known that linear combinations of non-radial pulsation frequencies can have larger amplitudes than the amplitudes of the parent frequencies that form the combination (e.g. Balona et al. 2013). The theoretical explanation of the phenomenon was given by Kurtz et al. (2015). The key point here is that the observed amplitude of a linear combination depends on the spherical harmonics of the component modes (see Eq. (7) and formulae (8) and (9) in Kurtz et al. 2015). However, in the case of two radial pulsation components, the spherical harmonics become constants; that is, the amplitudes of the combination peaks must always be smaller than those of the components. Applying this to our RRab stars, in four of the five stars in our sample,
  cannot be a radial mode frequency, because it has a smaller amplitude than the amplitude of its linear combination with f0 (see Col. 5 in Table 1)3, and thus
  cannot be identified with f2.
By comparing the amplitude ratios of the f68 and f59 (or  and
and  ) frequencies, that is, A68/A59 (or
  /A2) in Tables 1–A.2, we see that this ratio for RRc stars tends to be higher (∼2.9) than for RRab stars (∼1.4). Harmonics of the
  or f68 frequencies also appear in some cases (see e.g. V346 Lyr, V1510 Cyg, or Gaia DR2 4628067852624828672).
We carried out linear non-adiabatic (LNA) calculations to identify the parameter range in which second overtone pulsation is excited and to examine the proximity of the RRab stars of our sample to this region. This calculation was performed with the Budapest-Florida code Yecko et al. (1998), using the RR Lyrae convective parameter set of Kovács et al. (2024). The input parameters for the calculation are pulsating mass (M), effective temperature (Teff), bolometric luminosity (Lbol), and the hydrogen (X) and metal (Z) mass fractions. M ∈ [0.3, 0.9] with 0.05 M⊙ steps, L ∈ [35, 80] with 2 L⊙ steps, and Teff ∈ [6000, 7400] K with 50 K steps and for three metallicites: Z = 0.0001, 0.0003, and 0.0011. Also, X was chosen by assuming a primordial helium content (Y = 0.2465 Planck Collaboration XIII 2016).
To place the studied stars in this parameter grid, the effective temperatures were determined by comparing the spectroscopic Teff of Nemec et al. (2013) to the Gaia and 2MASS colour–Teff relations4 of Casagrande et al. (2021) and the statistical Teff − [Fe/H] relation of Jurcsik (1998). To obtain the bolometric luminosities, we calculated absolute K and V magnitudes using the period–luminosity and period–Wasenheit (K, V − K and J − K) relations (Cusano et al. 2021) with the extinction data of Schlafly & Finkbeiner (2011) and the bolometric corrections of Bessell et al. (1998). Pulsation mass (M) was determined through interpolation with the observed period on the LNA model grid using the other parameters. This method gives similar results to the PLMTZ relations of Marconi et al. (2015), while ensuring that the non-linear calculation has a period that is as close to linear as possible. These parameters can be found in Table 2.
We looked for cases where the linear growth rate of the second overtone η2 > 0; that is, where it is an excited mode. We show these results on the 150M − L (Kolláth et al. 2011) versus Teff plane in Fig. 2. In this 150M − L projection, the luminosity increases in the negative direction while the mass increases in the positive direction. We can see in Fig. 2 that to have excitation for the second overtone, the star needs a relatively large mass and/or low luminosity (150M − L > 66), while the temperature region is also higher than those of the studied stars. We note that this region is different from the ‘typical’ 2O pulsation region of RR Lyrae stars; that is, it is shifted towards higher temperatures. The frequency ratio of the studied stars in the models are (f2 − f0)/f0 ≈ 0.73 ± 0.03. Which is not consistent with the observed f68.
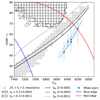 |
Fig. 2. Position of the observed stars on the T–(150M − L) plane. Light blue circles with error bars show the stars from Table 2. The hatched area shows where the second overtone is excited. The different patterns indicate the different metallicites. The dotted, dashed, and solid black curves correspond to those models that have the ratio (f2 − f0)/f0 = 0.686 for the linear grids with metallicities Z = 0.0001, Z = 0.003, and Z = 0.0011, respectively. The blue and the red solid curves are the first overtone blue and the fundamental red edges of the instability strip with M = 0.65 M⊙ for reference as given by Marconi et al. (2015). Grey squares denote models with |2f1 − f0 − f2|< 0.005 resonance. |
Non-linear effects might also produce additional frequencies, such as resonant mode pulsations (Kolláth et al. 2011). Although a full mode selection analysis requires large numbers of non-linear calculations, which is unfeasible at present, we can check one possible resonant region for f68 signals: Soszyński et al. (2016) suggested the 2f1O = fF + f2O resonance as an explanation for anomalous RRd stars. We show the models of these resonances in Fig. 2 with grey squares, where |2f1O − fF − f2O|< 0.005. We note that indeed this resonance region crosses f68 regions for lower metallicities, although the sample stars are not in this region.
5. Conclusions
In the present Letter, we show that the additional frequencies in non-Blazhko RRab stars produce Fourier patterns that are similar to the f68 frequencies known for RRc stars. The former explanation for these structures of RRab stars based on the frequencies of the second radial overtone modes f2 is unlikely because (i) the amplitudes of the linear combination frequencies of radial modes cannot be higher than the amplitudes of the component frequencies, and (ii) the model calculations for all stars show that their measured physical parameters are very far from the range that allows a second overtone pulsation. We find a link between the additional patterns of some RRab and RRc stars, but unfortunately with a frequency that is not yet explained, nor even known to be pulsation in origin.
Because of the different sensitivity of the two detectors, the Kp and TESS magnitudes are slightly different, but this is not relevant in our analysis.
The amplitude ratios given in Table 1 are accurate to at least a few percent; i.e. it is not possible to reverse the ratios due to observation noise.
We used the Colte module for this purpose.
Acknowledgments
This paper includes data collected by the Kepler and TESS missions. Funding for the missions is provided by the NASA Science Mission Directorate. The research was partially supported by the ‘SeismoLab’ KKP-137523 Élvonal and NN-129075 grants of the Hungarian Research, Development and Innovation Office (NKFIH).
References
- Baglin, A., Auvergne, M., Barge, P., et al. 2006, in The CoRoT Mission Pre-Launch Status– Stellar Seismology and Planet Finding, eds. M. Fridlund, A. Baglin, J. Lochard,&L. Conroy, ESA SP, 1306, 33 [Google Scholar]
- Balona, L. A., Catanzaro, G., Crause, L., et al. 2013, MNRAS, 432, 2808 [CrossRef] [Google Scholar]
- Benkő, J. M., & Szabó, R. 2015, ApJ, 809, L19 [CrossRef] [Google Scholar]
- Benkő, J. M., Kolenberg, K., Szabó, R., et al. 2010, MNRAS, 409, 1585 [CrossRef] [Google Scholar]
- Benkő, J. M., Plachy, E., Szabó, R., Molnár, L., & Kolláth, Z. 2014, ApJ, 213, 31 [Google Scholar]
- Benkő, J. M., Szabó, R., Derekas, A., & Sódor, Á. 2016, MNRAS, 463, 1769 [CrossRef] [Google Scholar]
- Benkő, J. M., Jurcsik, J., & Derekas, A. 2019, MNRAS, 485, 5897 [CrossRef] [Google Scholar]
- Benkő, J. M., Plachy, E., Netzel, H., et al. 2023, MNRAS, 521, 443 [Google Scholar]
- Bessell, M. S., Castelli, F., & Plez, B. 1998, A&A, 333, 231 [NASA ADS] [Google Scholar]
- Bódi, A., Szabó, P., Plachy, E., Molnár, L., & Szabó, R. 2022, PASP, 134, 014503 [CrossRef] [Google Scholar]
- Borucki, W. J., Koch, D., Basri, G., et al. 2010, Science, 327, 977 [Google Scholar]
- Buchler, J. R., & Kolláth, Z. 2011, ApJ, 731, 24 [NASA ADS] [CrossRef] [Google Scholar]
- Casagrande, L., Lin, J., Rains, A. D., et al. 2021, MNRAS, 507, 2684 [NASA ADS] [CrossRef] [Google Scholar]
- Chadid, M. 2012, A&A, 540, A68 [NASA ADS] [CrossRef] [EDP Sciences] [Google Scholar]
- Chadid, M., Benkő, J. M., Szabó, R., et al. 2010, A&A, 510, A39 [NASA ADS] [CrossRef] [EDP Sciences] [Google Scholar]
- Cusano, F., Moretti, M. I., Clementini, G., et al. 2021, MNRAS, 504, 1 [NASA ADS] [CrossRef] [Google Scholar]
- Dziembowski, W. A. 2016, Commun. Konkoly Obs. Hungary, 105, 23 [NASA ADS] [Google Scholar]
- Dziembowski, W. A., & Cassisi, S. 1999, Acta. Astron., 49, 371 [NASA ADS] [Google Scholar]
- Gruberbauer, M., Kolenberg, K., Rowe, J. F., et al. 2007, MNRAS, 379, 1498 [NASA ADS] [CrossRef] [Google Scholar]
- Howell, S. B., Sobeck, C., Haas, M., et al. 2014, PASP, 126, 398 [Google Scholar]
- Jurcsik, J. 1998, A&A, 333, 571 [NASA ADS] [Google Scholar]
- Kolenberg, K., Szabó, R., Kurtz, D. W., et al. 2010, ApJ, 713, L198 [NASA ADS] [CrossRef] [Google Scholar]
- Kolláth, Z., Molnár, L., & Szabó, R. 2011, MNRAS, 414, 1111 [CrossRef] [Google Scholar]
- Kovács, G. 2009, in Stellar Pulsation: Challenges for Theory and Observation, eds. J. A. Guzik, & P. A. Bradley, Am. Inst. Phys. Conf. Ser., 1170, 261 [CrossRef] [Google Scholar]
- Kovács, G. B., Nuspl, J., & Szabó, R. 2024, MNRAS, 527, L1 [Google Scholar]
- Kurtz, D. W., Shibahashi, H., Murphy, S. J., Bedding, T. R., & Bowman, D. M. 2015, MNRAS, 450, 3015 [NASA ADS] [CrossRef] [Google Scholar]
- Lenz, P., & Breger, M. 2005, Commun. Asteroseismol., 146, 53 [Google Scholar]
- Marconi, M., Coppola, G., Bono, G., et al. 2015, ApJ, 808, 50 [Google Scholar]
- Molnár, L., Kolláth, Z., Szabó, R., et al. 2012, ApJ, 757, L13 [CrossRef] [Google Scholar]
- Molnár, L., Szabó, R., Moskalik, P. A., et al. 2015, MNRAS, 452, 4283 [CrossRef] [Google Scholar]
- Molnár, L., Plachy, E., Klagyivik, P., et al. 2017, Eur. Phys. J. Web Conf., 160, 04008 [CrossRef] [EDP Sciences] [Google Scholar]
- Molnár, L., Bódi, A., Pál, A., et al. 2022, ApJ, 258, 8 [Google Scholar]
- Moskalik, P., Smolec, R., Kolenberg, K., et al. 2015, MNRAS, 447, 2348 [NASA ADS] [CrossRef] [Google Scholar]
- Nemec, J. M., Smolec, R., Benkő, J. M., et al. 2011, MNRAS, 417, 1022 [NASA ADS] [CrossRef] [Google Scholar]
- Nemec, J. M., Cohen, J. G., Ripepi, V., et al. 2013, ApJ, 773, 181 [CrossRef] [Google Scholar]
- Netzel, H., & Kolenberg, K. 2021, MNRAS, 508, 3508 [CrossRef] [Google Scholar]
- Netzel, H., & Smolec, R. 2019, MNRAS, 487, 5584 [NASA ADS] [CrossRef] [Google Scholar]
- Netzel, H., & Smolec, R. 2022, MNRAS, 515, 3439 [NASA ADS] [CrossRef] [Google Scholar]
- Netzel, H., Smolec, R., & Dziembowski, W. 2015, MNRAS, 451, L25 [NASA ADS] [CrossRef] [Google Scholar]
- Netzel, H., Molnár, L., Plachy, E., & Benkő, J. M. 2023, A&A, 677, A177 [NASA ADS] [CrossRef] [EDP Sciences] [Google Scholar]
- Olech, A., & Moskalik, P. 2009, A&A, 494, L17 [NASA ADS] [CrossRef] [EDP Sciences] [Google Scholar]
- Paegert, M., Stassun, K. G., Collins, K. A., et al. 2021, arXiv e-prints [arXiv:2108.04778] [Google Scholar]
- Plachy, E., & Szabó, R. 2021, Front. Astron. Space Sci., 7, 81 [NASA ADS] [CrossRef] [Google Scholar]
- Planck Collaboration XIII. 2016, A&A, 594, A13 [NASA ADS] [CrossRef] [EDP Sciences] [Google Scholar]
- Ricker, G. R., Winn, J. N., Vanderspek, R., et al. 2015, J. Astron. Telesc. Instrum. Syst., 1, 014003 [Google Scholar]
- Schlafly, E. F., & Finkbeiner, D. P. 2011, ApJ, 737, 103 [Google Scholar]
- Smolec, R. 2016, in 37th Meeting of the Polish Astronomical Society, eds. A. Różańska, & M. Bejger, 3, 22 [Google Scholar]
- Smolec, R., Prudil, Z., Skarka, M., & Bakowska, K. 2016, MNRAS, 461, 2934 [NASA ADS] [CrossRef] [Google Scholar]
- Sódor, Á., Hajdu, G., Jurcsik, J., et al. 2012, MNRAS, 427, 1517 [CrossRef] [Google Scholar]
- Soszyński, I., Smolec, R., Dziembowski, W. A., et al. 2016, MNRAS, 463, 1332 [Google Scholar]
- Szabó, R., Kolláth, Z., Molnár, L., et al. 2010, MNRAS, 409, 1244 [CrossRef] [Google Scholar]
- Szabó, R., Benkő, J. M., Paparó, M., et al. 2014, A&A, 570, A100 [NASA ADS] [CrossRef] [EDP Sciences] [Google Scholar]
- Udalski, A., Szymański, M. K., & Szymański, G. 2015, Acta. Astron., 65, 1 [NASA ADS] [Google Scholar]
- Walker, G., Matthews, J., Kuschnig, R., et al. 2003, PASP, 115, 1023 [Google Scholar]
- Yecko, P. A., Kollath, Z., & Buchler, J. R. 1998, AAP, 336, 553 [NASA ADS] [Google Scholar]
- Zalian, C., Chadid, M., Vernin, J., Abe, L., & Agabi, A. 2016, MNRAS, 456, 192 [NASA ADS] [CrossRef] [Google Scholar]
Appendix A: TESS and K2 RRc stars showing f68 frequency patterns
Non-Blazhko TESS RRc stars showing f68 additional frequencies.
Non-Blazhko RRc stars of the K2 mission showing f68 additional frequencies.
All Tables
All Figures
|
Fig. 1. Residual spectra of non-Blazhko RRab and RRc stars after the dominant pulsation frequency and its harmonics are prewhitened from the data. The top four panels show the Kepler RRab stars of Table 1, while the bottom five panels illustrate the spectra of RRc stars. The blue dotted and red dashed lines show the positions of the (prewhitened) harmonics and the possible positions of the additional frequencies, respectively. The frequency identification at the top of the figure refers to the RRc stars with f68 frequencies (shown in the bottom five panels), but a similar structure is also seen in our RRab stars (in the top four panels). |
| In the text | |
|
Fig. 2. Position of the observed stars on the T–(150M − L) plane. Light blue circles with error bars show the stars from Table 2. The hatched area shows where the second overtone is excited. The different patterns indicate the different metallicites. The dotted, dashed, and solid black curves correspond to those models that have the ratio (f2 − f0)/f0 = 0.686 for the linear grids with metallicities Z = 0.0001, Z = 0.003, and Z = 0.0011, respectively. The blue and the red solid curves are the first overtone blue and the fundamental red edges of the instability strip with M = 0.65 M⊙ for reference as given by Marconi et al. (2015). Grey squares denote models with |2f1 − f0 − f2|< 0.005 resonance. |
| In the text | |
Current usage metrics show cumulative count of Article Views (full-text article views including HTML views, PDF and ePub downloads, according to the available data) and Abstracts Views on Vision4Press platform.
Data correspond to usage on the plateform after 2015. The current usage metrics is available 48-96 hours after online publication and is updated daily on week days.
Initial download of the metrics may take a while.