Fig. 4
Download original image
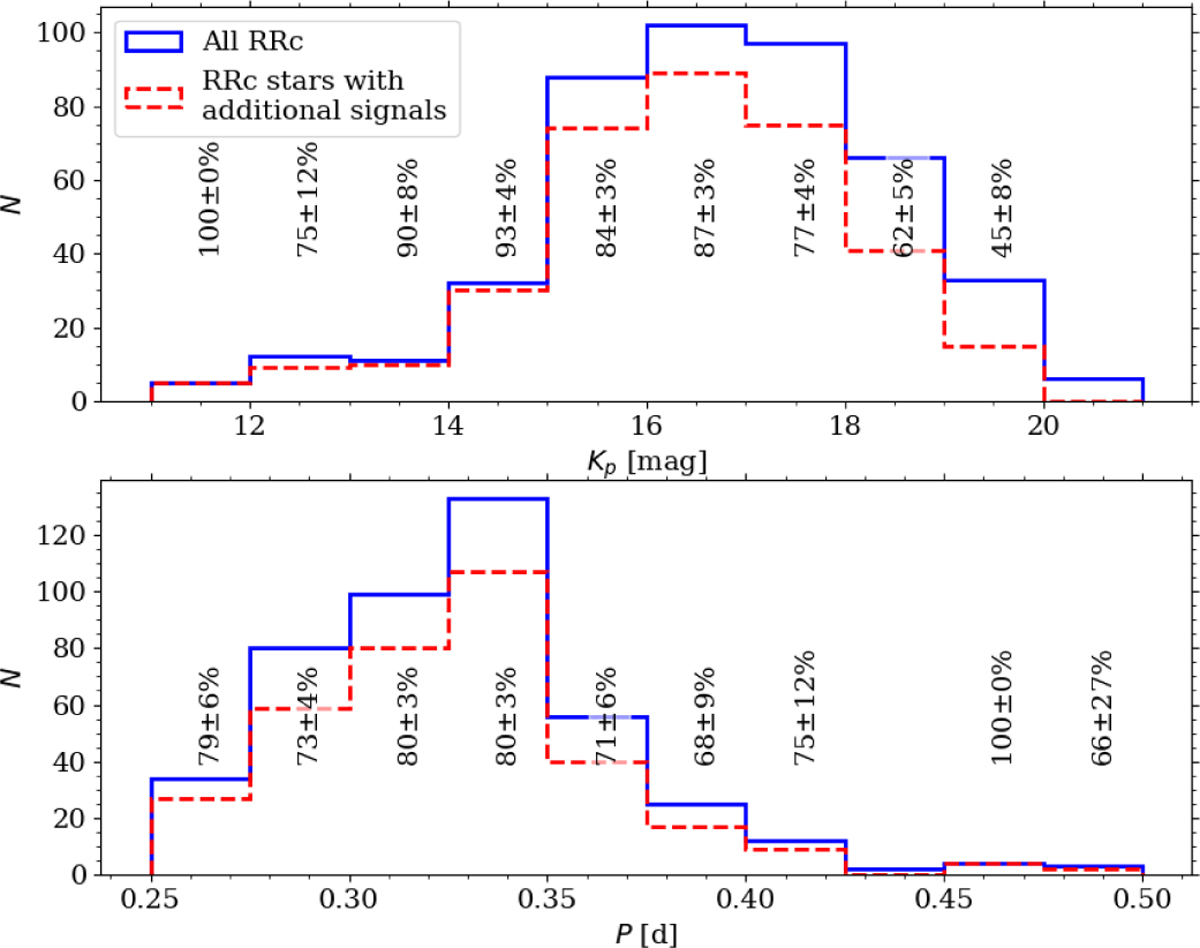
Distribution of observed brightness in Kp band (top panel) and first-overtone period (bottom panel) for stars classified as RRc (blue solid line). With a red dashed line, we plotted the distributions for RRc stars in which we detected additional low-amplitude signals. We also provide the incidence rate of RRc stars with the additional signals for each bin of both distributions. The error was calculated assuming Poisson distribution (see e.g. Alcock et al. 2003).
Current usage metrics show cumulative count of Article Views (full-text article views including HTML views, PDF and ePub downloads, according to the available data) and Abstracts Views on Vision4Press platform.
Data correspond to usage on the plateform after 2015. The current usage metrics is available 48-96 hours after online publication and is updated daily on week days.
Initial download of the metrics may take a while.