Fig. 27
Download original image
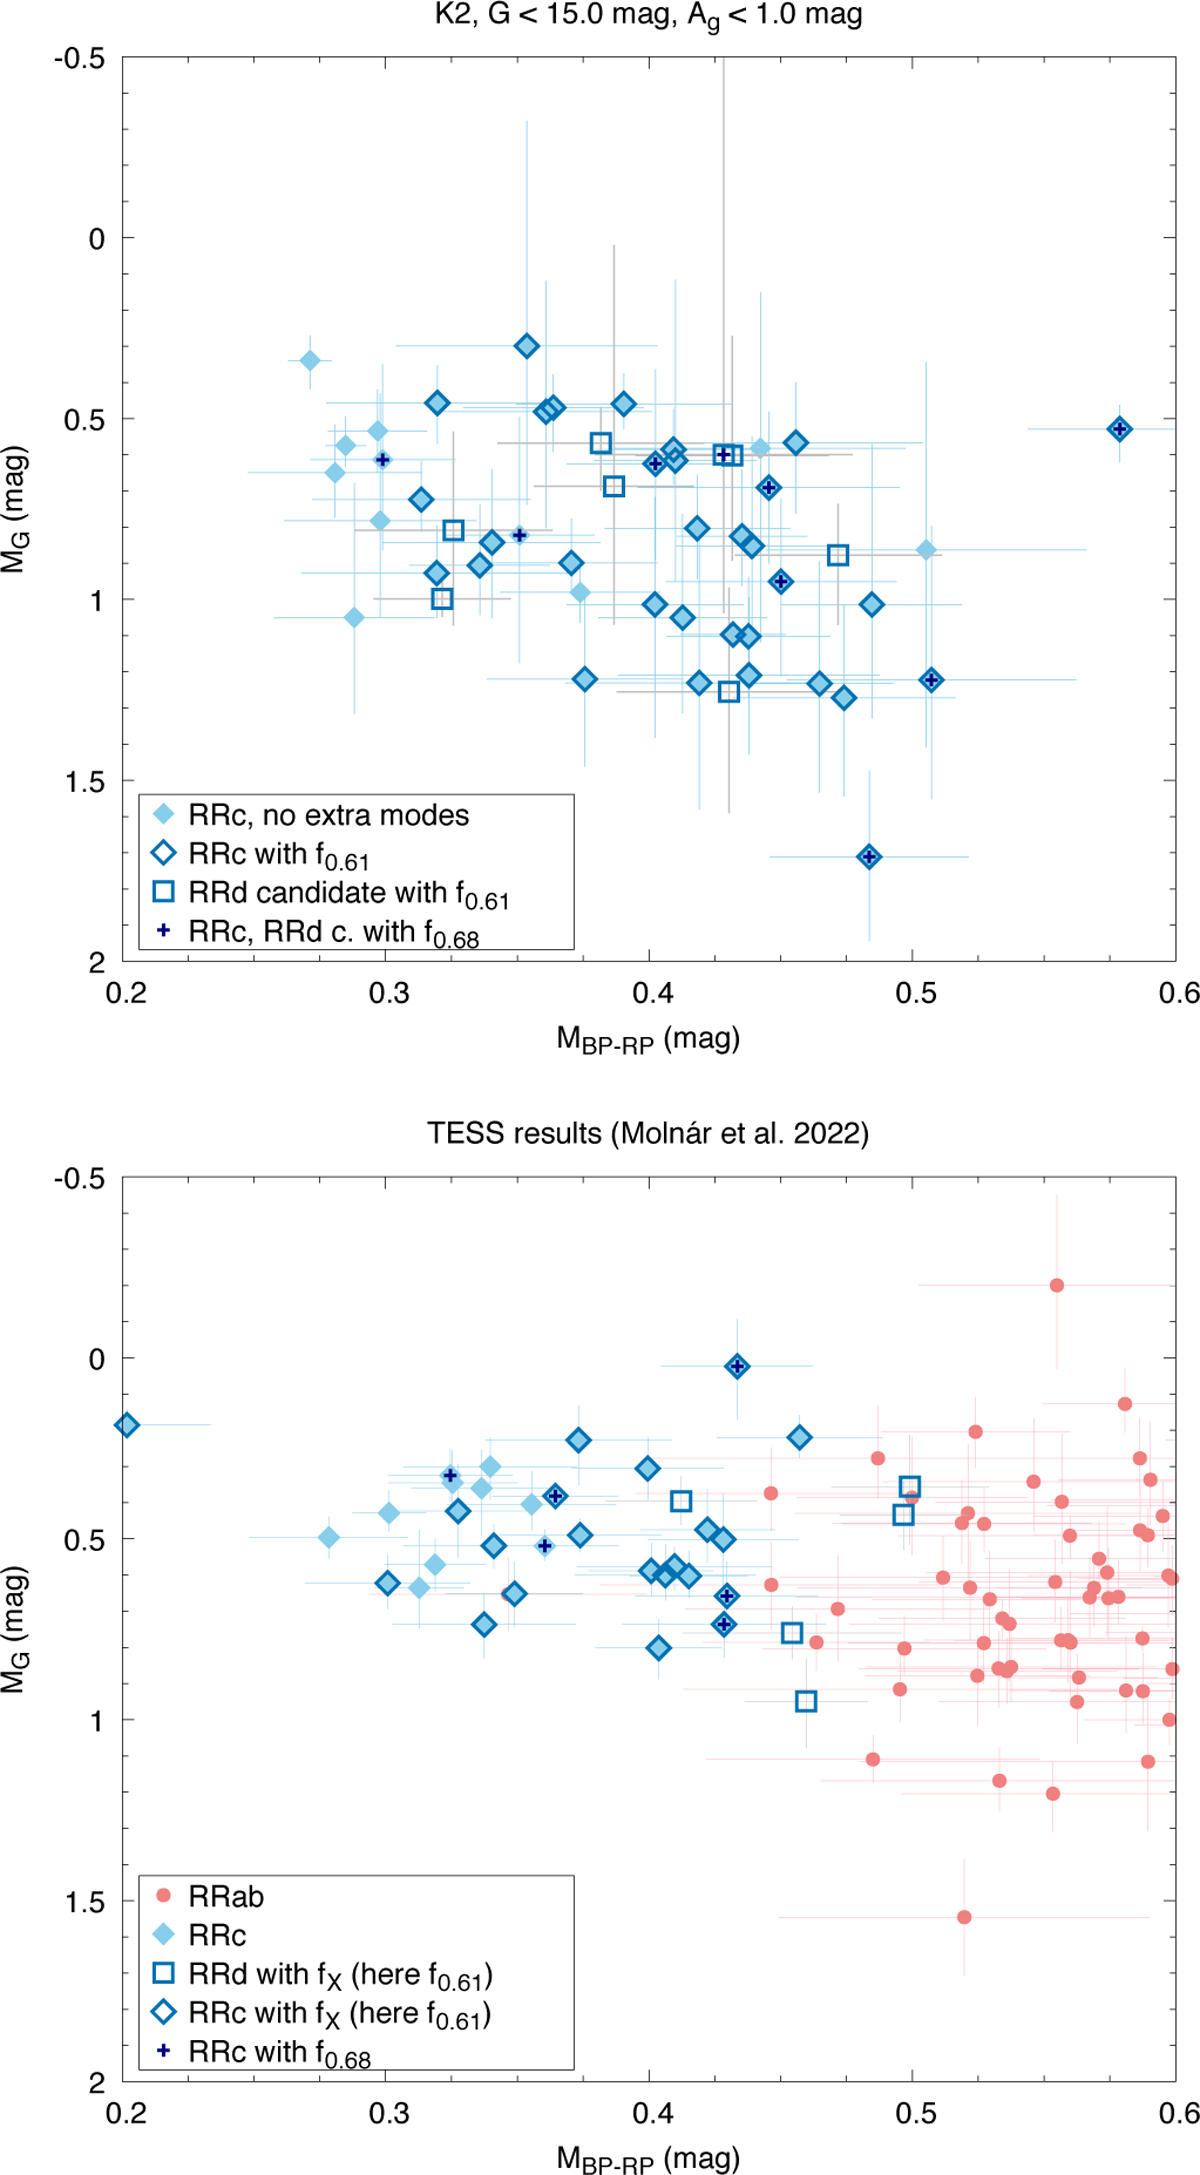
Color-magnitude diagrams. Top panel: Color-magnitude diagram of 53 stars from the bright end of the sample. Presence of additional modes are marked with dark outlines (f0.61) and crosses (f0.68). The RRd candidate stars are marked with squares. Bottom panel: CMD of the TESS observations published by Molnár et al. (2022), for comparison. Here, RRab stars are indicated with red symbols.
Current usage metrics show cumulative count of Article Views (full-text article views including HTML views, PDF and ePub downloads, according to the available data) and Abstracts Views on Vision4Press platform.
Data correspond to usage on the plateform after 2015. The current usage metrics is available 48-96 hours after online publication and is updated daily on week days.
Initial download of the metrics may take a while.