Fig. 29
Download original image
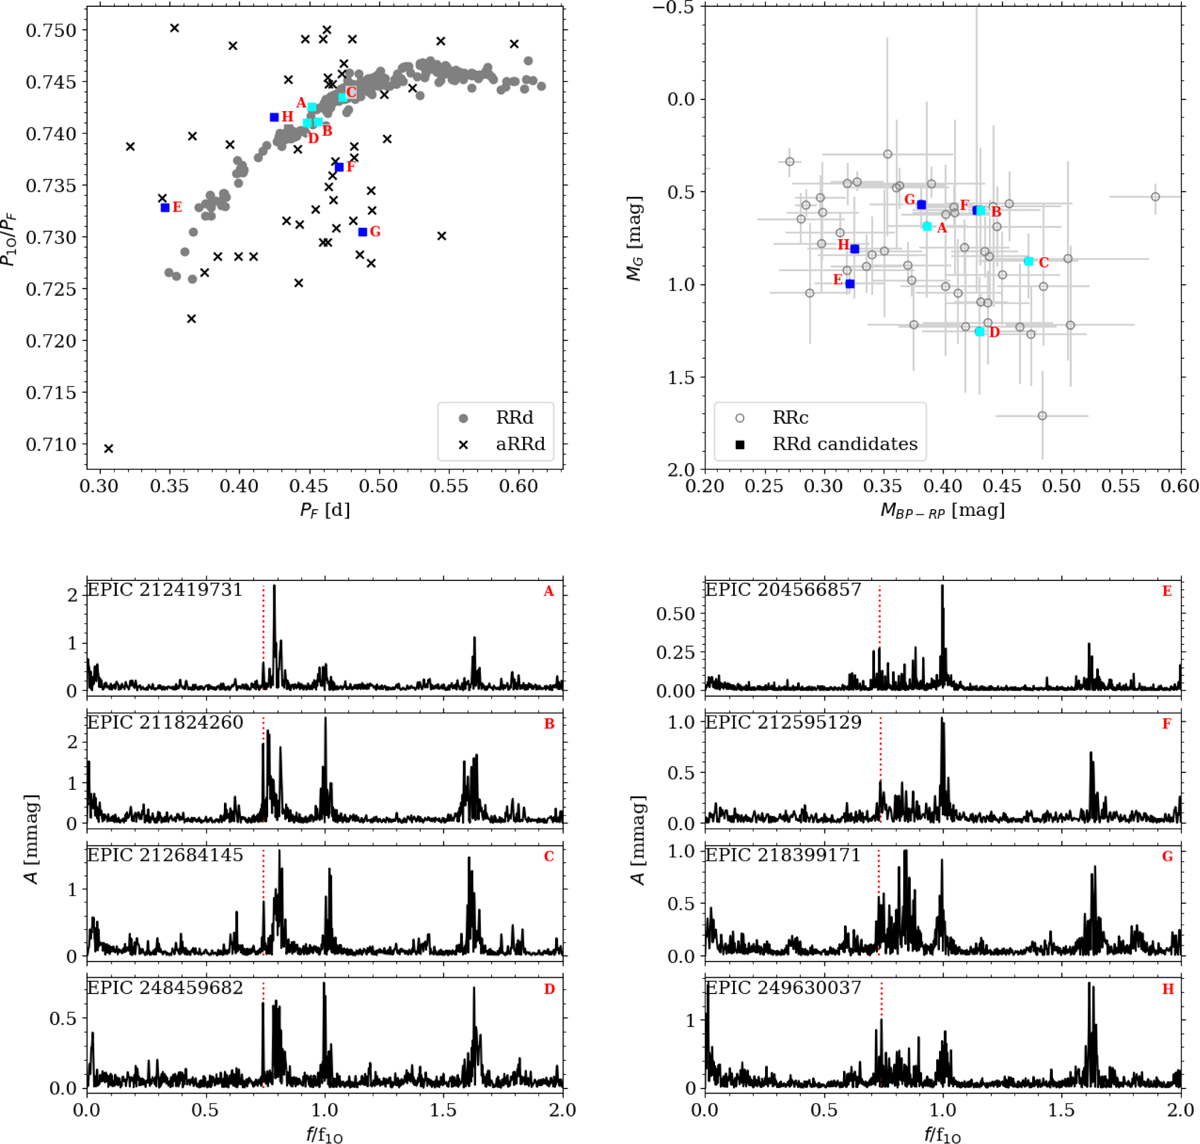
Petersen diagram, color-magnitude diagram, and frequency spectra for eight RRd candidates. Top-left panel: Petersen diagram showing an RRd sequence (gray points), anomalous RRd stars (black crosses), and RRd candidates that fit the RRd sequence (cyan squares) and that have a slightly atypical period ratio (blue squares). Top-right panel: Color-magnitude diagram for RRc stars (black open circles, see also Fig. 27) and RRd candidates. Bottom-left panel: Frequency spectra of four RRd candidates that fit the RRd sequence (cyan squares in the top panels) after prewhitening with the first overtone and its harmonics. The horizontal axis is scaled with the first-overtone frequency. The signal forming period ratio fitting the RRd sequence is marked with a red dashed line. Bottom-right panel: Same as the bottom-left panel but for RRd candidates that deviate from the RRd sequence (plotted with blue squares in the top panels). The EPIC number is provided in the top-left corner of each panel with a frequency spectrum. Stars in the different panels are identified with a letter in the top-right corner of the frequency spectra plots as well as close to their corresponding points in the top two panels.
Current usage metrics show cumulative count of Article Views (full-text article views including HTML views, PDF and ePub downloads, according to the available data) and Abstracts Views on Vision4Press platform.
Data correspond to usage on the plateform after 2015. The current usage metrics is available 48-96 hours after online publication and is updated daily on week days.
Initial download of the metrics may take a while.