Fig. 9
Download original image
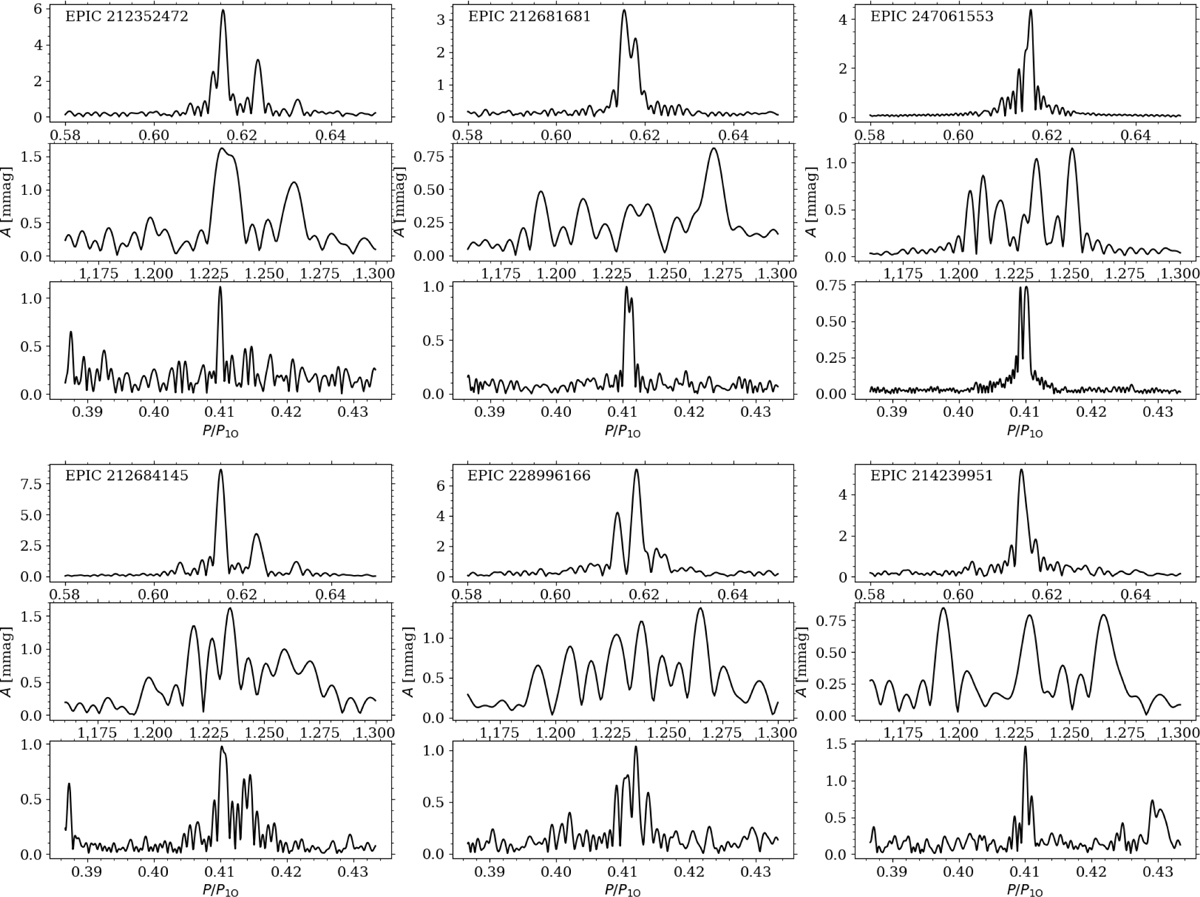
Frequency spectrum examples for six RR0.61 stars. For each star, the top, middle, and lower panels show the frequency ranges corresponding to the f0.61, 0.5f0.61, and 1.5f0.61 signals, respectively. The horizontal axis is scaled with the first-overtone periods. The EPIC numbers are provided in the upper-left corner of the top panel.
Current usage metrics show cumulative count of Article Views (full-text article views including HTML views, PDF and ePub downloads, according to the available data) and Abstracts Views on Vision4Press platform.
Data correspond to usage on the plateform after 2015. The current usage metrics is available 48-96 hours after online publication and is updated daily on week days.
Initial download of the metrics may take a while.