Fig. 28
Download original image
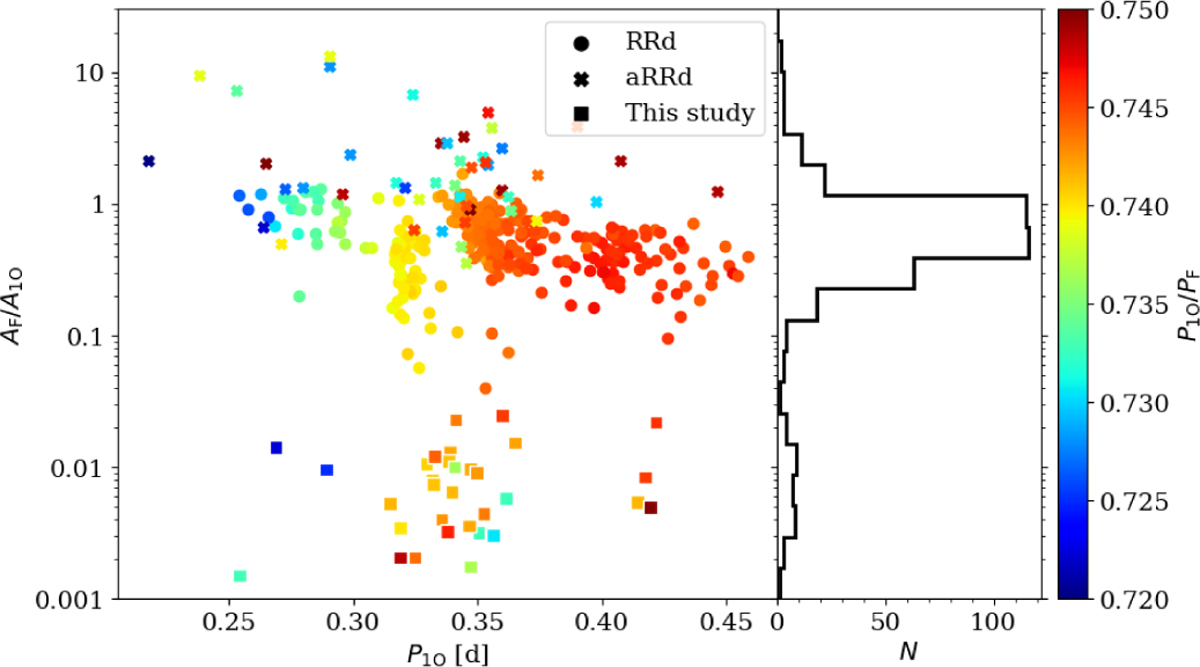
Amplitude ratio of Fourier first-overtone amplitude and the amplitude of the additional signal for RRd candidates (see text for details). The period ratio of the two frequencies is plotted with different colors as indicated in the legend. The RRd candidates are plotted with squares. We also included RRd and aRRd stars from the Galactic bulge, which are plotted with circles and crosses, respectively (Soszyński et al. 2019). Right panel: Distribution of the amplitude ratio.
Current usage metrics show cumulative count of Article Views (full-text article views including HTML views, PDF and ePub downloads, according to the available data) and Abstracts Views on Vision4Press platform.
Data correspond to usage on the plateform after 2015. The current usage metrics is available 48-96 hours after online publication and is updated daily on week days.
Initial download of the metrics may take a while.