Open Access
Fig. 11
Download original image
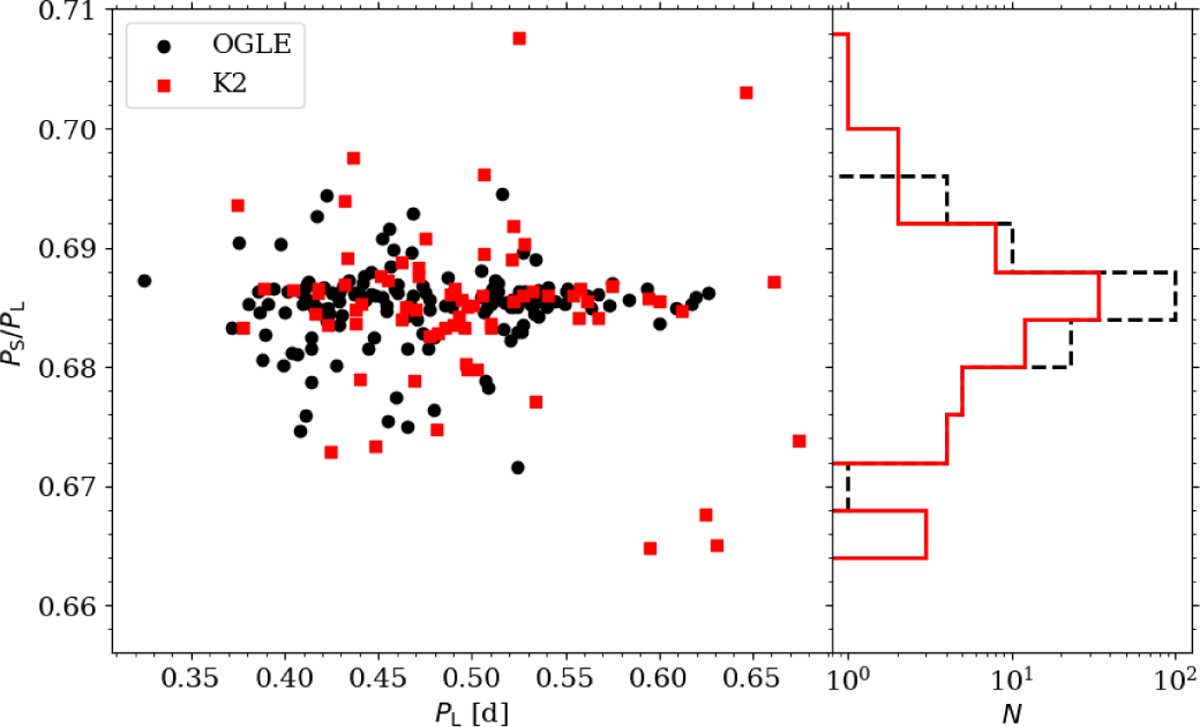
Petersen diagram for RR0.68 stars. Stars detected in the K2 data are plotted with red squares. Stars from the OGLE sample are plotted with black circles. Right panel: histogram of period ratios for the two samples.
Current usage metrics show cumulative count of Article Views (full-text article views including HTML views, PDF and ePub downloads, according to the available data) and Abstracts Views on Vision4Press platform.
Data correspond to usage on the plateform after 2015. The current usage metrics is available 48-96 hours after online publication and is updated daily on week days.
Initial download of the metrics may take a while.