| Issue |
A&A
Volume 674, June 2023
|
|
|---|---|---|
| Article Number | A193 | |
| Number of page(s) | 13 | |
| Section | Planets and planetary systems | |
| DOI | https://doi.org/10.1051/0004-6361/202345915 | |
| Published online | 22 June 2023 | |
Spin of protoplanets generated by pebble accretion: Influences of protoplanet-induced gas flow
1
Department of Earth and Planetary Sciences, Tokyo Institute of Technology,
Ookayama, Meguro-ku, Tokyo
152-8551,
Japan
e-mail: This email address is being protected from spambots. You need JavaScript enabled to view it.
2
Earth-Life Science Institute, Tokyo Institute of Technology,
Ookayama, Meguro-ku, Tokyo
152-8550,
Japan
Received:
16
January
2023
Accepted:
20
March
2023
Abstract
Context. In the pebble accretion model, protoplanets accrete millimeter-to-centimeter-sized particles (pebbles). When a protoplanet grows, a dense gas envelope forms around it. The envelope affects accretion of pebbles and, in particular, the spin angular momentum transfer at the collision to the planet.
Aims. We aim to investigate the spin state of a protoplanet during the pebble accretion influenced by the gas flow in the gravitational potential of the protoplanet and how it depends on the planetary mass, the headwind speed, the distance from the host star, and the pebble size.
Methods. We performed nonisothermal three-dimensional hydrodynamical simulations in a local frame to obtain the gas flow around the planet. We then numerically integrated three-dimensional orbits of pebbles under the obtained gas flow. Finally, assuming uniform spatial distribution of incoming pebbles, we calculated net spin by summing up specific angular momentum that individual pebbles transfer to the protoplanet at impacts.
Results. We find that a protoplanet with the envelope acquires prograde net spin rotation regardless of the planetary mass, the pebble size, and the headwind speed of the gas. This is because accreting pebbles are dragged by the envelope that commonly has prograde rotation. As the planetary mass or orbital radius increases, the envelope is thicker and the prograde rotation is faster, resulting in faster net prograde spin. When the dimensionless thermal mass of the planet, m = RBondi/H, where RBondi and H are the Bondi radius and the disk gas scale height, is larger than a certain critical mass (m ≳ 0.3 at 0.1 au or m ≳ 0.1 at 1 au), the spin rotation exceeds the breakup one.
Conclusions. The predicted spin frequency reaches the breakup one at the planetary mass miso,rot ~ 0.1 (a/1 au)−1/2 (where a is the orbital radius), suggesting that the protoplanet cannot grow beyond miso,rot. It is consistent with the Earth’s current mass and could help the formation of the Moon with a giant impact on a fast-spinning proto-Earth.
Key words: planets and satellites: formation / planets and satellites: atmospheres / protoplanetary disks
© The Authors 2023
 Open Access article, published by EDP Sciences, under the terms of the Creative Commons Attribution License (https://creativecommons.org/licenses/by/4.0), which permits unrestricted use, distribution, and reproduction in any medium, provided the original work is properly cited.
This article is published in open access under the Subscribe to Open model. This email address is being protected from spambots. You need JavaScript enabled to view it. to support open access publication.
1 Introduction
Many of the solid bodies (terrestrial planets and minor bodies) in the Solar System rotate in the prograde directions; in other words, the direction of their spin coincides with the direction of their orbits (Warner et al. 2009). When targeting asteroids larger than 150 km in diameter, which are considered less susceptible to post-formation dynamics and collisions (Bottke et al. 2005; Steinberg & Sari 2015), and planets, their spin vectors are anisotropic and the preference of prograde spins is statistically significant (Visser et al. 2020).
While gas giants generally acquire prograde spin due to gas accretion from circumplanetary disks that usually rotate in prograde directions (Machida et al. 2008), how terrestrial and icy planets acquired their spin is unclear. For instance, in the classical planetesimal accretion model, planets do not generally achieve sufficient spin angular velocities (Ida & Nakazawa 1990; Lissauer & Kary 1991; Dones & Tremaine 1993a; Lissauer et al. 1997), except when the planetesimal disks have a partial gap around the protoplanet orbit (Ohtsuki & Ida 1998). This is because the contribution of the planetesimals to the spin cancels out, resulting in a smaller rotation rate than observed. An alternative model for the origins of planet spins is the giant-impact model (Dones & Tremaine 1993b), which is the current paradigm. In this approach, the rotation is dominated by a single impact of a relatively large projectile, and thus the rotation is not canceled out as it is in the planetesimal accretion model. Indeed, planets formed predominantly through giant impacts generally have a large spin frequency comparable to the breakup frequency (Kokubo & Ida 2007; Miguel & Brunini 2010). However, this is not consistent in terms of the direction of spin axes. When a single giant impact determines the direction of rotation, the spin axis directions should follow an isotropic distribution. While the spin distribution of the terrestrial planets in the Solar System has statistical uncertainty, the preference for prograde rotation is extended down to asteroids. It is more natural to assume that there was a mechanism that made the initial rotations of solid bodies more likely to be prograde in the Solar System.
In recent years, pebble accretion has attracted a lot of attention as a new model of planetary formation (Ormel & Klahr 2010; Lambrechts & Johansen 2012). In this model, millimeter-to-centimeter-sized particles called “pebbles’, which easily couple with the gas, work as the building blocks of planets. This model, as well as the planetesimal accretion model, can explain the anisotropy of the spin vector because the averaged rotation vector has only the vertical component due to the plane symmetry of the protoplanetary disk. Thus, the question is whether pebble accretion can spin up the planet much more than planetesimal accretion.
Johansen & Lacerda (2010) were the first to investigate the spinning-up of solid bodies by pebble accretion. The authors performed hydrodynamical simulations of gas and pebbles with a ~102 km-sized solid body, in which pebbles are treated as Lagrangian particles. They considered the case where the pebble-to-gas ratio is ~l. Due to the back-reaction from the pebbles through gas drag, the gas motion becomes turbulent. A prograde circumplanetary accretion disk forms, resulting in the prograde spin rotation of the accreting solid body. Although the results potentially explain the trend for the preferred prograde rotation of the Solar System bodies, they assumed a specific situation with the high pebble-to-gas ratio.
Visser et al. (2020) studied the link between pebble accretion and the spin rotation of solid bodies with ~10–103 km in diameter under a variety of disk conditions and pebble parameters. Assuming an unperturbed sub-Keplerian shear flow, the authors computed the pebble trajectories. They found that the absolute values of the net spin angular momentum of the solid bodies can be much larger in the case of pebble accretion than in the planetesimal accretion. Though in certain regions of their parameter space the net rotation can be retrograde, the contribution to the prograde rotation is dominant in most regions in their parameter space, which is consistent with observations of the spin distribution of relatively large asteroids.
Although the results of these two previous studies are applicable when considering the spin rotation of solid bodies of ≲ 103 km in diameter, their results cannot be applied for ≳ 103 km-sized protoplanets. For larger mass objects such as terrestrial planets in the Solar System and super-Earths, the influences of the protoplaneťs gravity on the surrounding gas cannot be neglected.
Recent three-dimensional (3D) hydrodynamical simulations show complex gas flows around embedded protoplanets (Ormel et al. 2015b; Fung et al. 2015; Cimerman et al. 2017; Lambrechts & Lega 2017; Kurokawa & Tanigawa 2018; Kuwahara et al. 2019; Béthune & Rafikov 2019; Fung et al. 2019; Moldenhauer et al. 2021, 2022). The structure of the gas flow is characterized by i) the horseshoe flow ahead of and behind the protoplaneťs orbital motion, ii) the streams closely passing the protoplanet with the inflow from the polar region and the outflow from the midplane region, and iii) the weak interacting streams passing by the Keplerian shear flow in the distant region. When the Bondi radius is larger than the physical radius of the protoplanet, an envelope or a primordial atmosphere is formed by the protoplaneťs gravitational potential. The envelope has a higher density than in the unperturbed regions and rotates in the prograde direction due to the Coriolis force. As suggested in Kuwahara & Kurokawa (2020a,b), the protoplanet-induced gas flow can alter the trajectories of pebbles and thus affects angular momentum transfer from the accreting pebbles.
In this study, we investigated the specific angular momentum (SAM) transfer from pebbles to a protoplanet via impacts, numerically integrating the pebble trajectories one by one under the influence of the protoplanet-induced gas flow. Summing up the contributions from accreting pebbles, we derived the spin rotation state of the protoplanet as a function of the protoplanet mass, the pebble size, and the headwind speed.
The structure of this paper is as follows. Our numerical models and methods are explained in Sect. 2. We show the results of hydrodynamical simulations, orbital calculations, and spin calculations in Sect. 3. Section 4 provides discussions on comparisons with observations and possible applications to planet and moon formation theory. A summary is presented in Sect. 5.
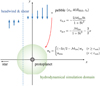 |
Fig. 1 Schematic picture of orbital calculation of pebbles. The starting point of pebbles is (xs, |ys| = 40 RHill, zs). The x- and z-coordinates of the starting point of pebbles, xs and zs, are parameters. The green circle area represents the hydrodynamical simulation domain with radius rout. We used the gas velocity obtained from the hydrodynamical simulation to calculate the gas drag force acting on the pebble within rout. Outside rout, the gas velocity is assumed to be the speed of the sub-Keplerian shear flow. |
2 Methods
In our simulation, we first performed 3D local hydrodynamical simulations of the disk gas flow under the planetary gravitational potential (Sect. 2.2). Then, we performed 3D orbital calculations of pebbles taking account of the aerodynamical drag from the obtained gas flow in the local coordinates co-rotating with the planet (Sect. 2.3). We calculated the net SAM of the planetary spin by summing the SAM transferred from individual pebbles at impacts (Sect. 2.4).
2.1 Scaling
In this paper, we use the local coordinates (x, y, z) co-rotating with a protoplanet orbiting a host star at the radius a, where x, y, and z are the radial, azimuthal, and vertical directions, respectively (Fig. 1). We normalized lengths of the coordinates (x, y, z), times, and gas densities by the disk scale height, H, the reciprocal of the planetary orbital frequency,  , where G and M* are the gravitational constant and the host star mass, and the unperturbed gas density at a, ρdisk, respectively. Accordingly, velocities were normalized by the sound speed, cs = HΩK. Following Ormel et al. (2015a), we adopted the mass scaling factor,
  . In this dimensionless unit system, the dimensionless planetary mass is defined as
 (1)
(1)
where Mp is the mass of the protoplanet and  is the Bondi radius of the protoplanet, which represents a typical radius of a gravitationally bound gas envelope around the protoplanet. In terms of m, the Hill radius is expressed by (Kurokawa & Tanigawa 2018)
 (2)
(2)
To convert the normalized masses to dimensional ones, the aspect ratio of the disk, H/a (in other words, the disk temperature distribution), needs to be specified. For simplicity, we used the radially optically thin limit,
 (3)
(3)
where L* and L⊙ are the stellar and the solar luminosity, respectively (Hayashi 1981). With this temperature distribution, the aspect ratio is given by H/a ≃ 0.033 (a/1 au)1/4 (L*/1 L⊙)1/8. In this case, the dimensional planetary mass can be described by (Kurokawa & Tanigawa 2018)
 (4)
(4)
where M⊙ is the solar mass. The normalized planetary masses considered in this study are m = 0.001, 0.003, 0.01, 0.03, 0.1, and 0.3. Assuming M* = 1 M⊙ and L* = 1 L⊙, we show the relation between m and dimensional planetary masses in Fig. 2.
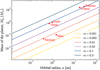 |
Fig. 2 Relationship between dimensionless planetary masses and dimensional ones in the case of the radially optically thin limit temperature distribution of the disks around the solar mass host star. Each line represents the dimensionless planetary mass as a function of the orbital radius. Different colors correspond to different m. The red dots represent the Solar System planets. |
2.2 Three-dimensional hydrodynamical simulations
We performed 3D hydrodynamical simulations of the gas influenced by the gravity of the protoplanet until the system reached a steady state, and we used these results in the following pebble trajectory calculations (Sect. 2.3). Our methods of hydrodynamical simulations are the same as those of Kurokawa & Tanigawa (2018) and Kuwahara & Kurokawa (2020a,b), except for the ranges of the planetary masses, the smoothing lengths, and the sizes of the inner boundary. We performed hydrodynamical simulations in spherical polar coordinates centered at the protoplanet, assuming a compressible and inviscid fluid of an ideal gas. We use the Athena++ code1 (White et al. 2016; Stone et al. 2020). The parameters of hydrodynamical simulations are summarized in Table 1.
We set an inner boundary of the computational domain at the normalized physical radius of the protoplanet, rin = Rp/H, where Rp is the dimensional physical radius;
 (5)
(5)
 (6)
(6)
where ρp is the bulk density of the protoplanet (Kuwahara & Kurokawa 2020a,b). We performed the simulations with rin = 3 × 10⁻² m1/3 and 3 × 10⁻³ m1/3, corresponding to a = 0.1 au and 1 au in the case of M* = 1 M⊙ and ρp = 5 g cm−3 (Eq. (5); for details, see the results in Sect. 3.7).
The nondimensional gas velocity at the outer boundary of the hydrodynamical simulation domain, rout, is set by the unperturbed gas velocity in the local frame,
 (7)
(7)
where ℳhw = υhw/cs is the Mach number of the headwind of the gas. The headwind velocity, υhw, represents the deviation from the Keplerian velocity due to the radial pressure gradient,
 (8)
(8)
where υK = aΩK is the Keplerian velocity and P is the pressure of the gas. In the optically-thin limit disks, the Mach number of the headwind is ℳhw ≃ 0.05 (a/1 au)1/4. We consider ℳhw = 0.03 as a fiducial parameter (Table 1). The dependence on the Mach number of the headwind is investigated in Sect. 3.5.
The dimensionless continuity, Euler’s, and energy conservation equations are described as follows:
 (9)
(9)
 (10)
(10)
![Mathematical equation: $\matrix{ { {{{\partial E} \over {\partial t}} + \nabla } \cdot \left[ {{{\bf{\upsilon }}_{\rm{g}}}\left( {E + P} \right)} \right] = {\rho _{\rm{g}}}{{\bf{\upsilon }}_g} \cdot \left( {{{\bf{F}}_{{\rm{cor}}}} + {{\bf{F}}_{{\rm{tid}}}} + {{\bf{F}}_{{\rm{hw}}}} + {{\bf{F}}_{\rm{p}}}} \right)} \hfill \cr {\quad \quad \quad \quad \quad \quad \quad \quad \,\,\,\,\,\,\,\, - {{U\left( {{\rho _{\rm{g}}},T} \right) - U\left( {{\rho _{\rm{g}}},{T_0}} \right)} \over \beta },} \hfill \cr } $](/articles/aa/full_html/2023/06/aa45915-23/aa45915-23-eq14.png) (11)
(11)
where ρg is the gas density. The internal energy density, U, and the total energy density, E, are given by
 (12)
(12)
 (13)
(13)
where γ is the specific heat ratio. We assume γ = 1.4. The last term in Eq. (11) is the radiative cooling implemented by using the β cooling model, in which the temperature T varies on the dimensionless timescale β toward the background temperature T0 (e.g., Gammie 2001). We adopted β = (m/0.1)2 (Kurokawa & Tanigawa 2018).
The right sides of Eqs. (10) and (11) include external force terms: the Coriolis force, Fcor = −2ez × υg, the tidal force, Ftid = 3xex − zez, and the global pressure force due to the sub-Keplerian motion of the gas, Fhw = −2ℳhwex. The protoplanet gravitational force Fp is given by (Ormel et al. 2015b):
![Mathematical equation: ${{\bf{F}}_{\rm{p}}} = - \nabla \left( {{m \over {\sqrt {{r^2} + r_{{\rm{sm}}}^2} }}} \right)\left\{ {1 - \exp \left[ { - {1 \over 2}{{\left( {{t \over {{t_{{\rm{inj}}}}}}} \right)}^2}} \right]} \right\},$](/articles/aa/full_html/2023/06/aa45915-23/aa45915-23-eq17.png) (14)
(14)
where  is the distance from the protoplanet and rsm is the normalized smoothing length. We assume rsm = 0 for most of the simulations, but we also test the cases of rsm = 0.1 m and rsm = 0.2 m in several runs (Table 1 and Sect. 3.6). Following Ormel et al. (2015a), we gradually inserted the protoplanet gravity at the injection time, tinj = 0.5, in order to avoid shock formation. The resolution of our simulations are 128 logarithmically spaced cells in the radial, 64 cells in the polar, and 128 cells in the azimuthal direction.
Hydrodynamical simulations.
2.3 Three-dimensional orbital calculation of pebbles
Following Kuwahara & Kurokawa (2020a,b), we calculated the trajectories of pebbles influenced by the protoplanet-induced gas flow in the frame co-rotating with the protoplanet (Fig. 1) using a fifth-order Runge-Kutta-Fehlberg variable step scheme (RKF45; Fehlberg 1969). The dimensionless equation of motion for a pebble with position r = (x, y, z) and velocity υ = (υx, υy, υz) are described by (Ormel & Klahr 2010; Visser et al. 2020; Kuwahara & Kurokawa 2020a,b):
 (15)
(15)
The first-to-third terms on the right side of Eq. (15) are the Coriolis and tidal forces, the gravitational force of the protoplanet, and the gas drag force acting on the pebble, respectively. Assuming the balance between the turbulent diffusion and the vertical tidal force, we omitted the z-component of the tidal force, -zez, in Eq. (15) (Kuwahara & Kurokawa 2020a). The dimensionless stopping time, called the Stokes number, is defined by
 (16)
(16)
where the stopping time, tstop, for a pebble with the physical radius, s, and the internal density, ρ•, is given by
 (17)
(17)
The mean free path of the gas is given by lmfp = μmH/ρgσmol = 1.44 (a/1 au)11/4cm for the Minimum-Mass Solar Nebula (MMSN) model (Hayashi 1981) with μ, mH, and σmol being the mean molecular weight, μ = 2.34, the mass of a proton, and the molecular collision cross-section, σmol = 2 × 10⁻¹⁵ cm2 (Chapman & Cowling 1970; Weidenschilling 1977a; Nakagawa et al. 1986). We assumed St = 10−3−100 as the initial Stokes number.
As shown in Eq. (17), the gas drag law changes at s ~ lmfp. Since  , when the disk gas density is low enoug h to satisfy s ≲ lmfp, the drag force increases with ρg. In other words, St is inversely proportional to ρg. This drag regime is called the Epstein regime. As a pebble approaches a protoplanet and enters its gas envelope, the drag force is stronger (St becomes smaller) and the pebble is more susceptible to gas drag. When ρg becomes high enough to satisfy s ≳ lmfp, the drag law is switched to the Stokes regime. Since the Stokes drag force is independent of ρg
  , the Stokes number remains constant once the gas drag law switches to the Stokes regime.
If ρg already satisfies the condition for the Stokes regime in the regions far from the protoplanet, for example in the inner region of the disk (≲ 1 au for the MMSN model; Lambrechts & Johansen 2012), St is kept constant even when the pebble enters the gas envelope of the protoplanet. In this case, we do not need to specify the background gas density. On the other hand, in the case starting from the Epstein regime, St varies along the pebble trajectory and thus the background gas density needs to be specified to identify where the gas drag regime changes.
We investigated two limiting cases: one in which only the Stokes regime is adopted, and the other in which only the Epstein regime is adopted. We bracketed intermediate cases for simplicity. This approach leaves the background gas density as a free parameter, and thus we do not lose generality. As shown later in Sect. 3.4, the net SAM transferred to the protoplanet is similar between these two limiting cases as a function of St, implying that the rate of the angular momentum transfer obtained in this study is robust.
The gas velocity, υg, is switched at the outer boundary of the hydrodynamical simulation domain, rout (Kuwahara & Kurokawa 2020a,b):
 (18)
(18)
where υsim is the gas velocity obtained from the hydrodynamical simulations2. We confirmed that the connection at r = rout has only minor effect on trajectories of pebbles; the velocities of pebbles at the boundary are nearly identical to their unperturbed velocities (see Eqs. (22) and (23) given below; Kuwahara & Kurokawa 2020a,b; Kuwahara et al. 2022).
The normalized equation of motion (Eq. (15)) is formally characterized by only two parameters, m and St defined by Eqs. (1) and (16). However, the gas flow field (υg) depends on Rp/H and accordingly on a (Eq. (5)), in particular within the Bondi radius. We will discuss the a-dependence in Sect. 3.7.
Initial conditions of the orbital integrations are given as follows. We adopted the initial y as |ys| = 40 RHill/H (Ida & Nakazawa 1989). We integrated the orbits of pebbles in the ranges of the initial x and z (xs and zs) broad enough to cover all the collision bands with the protoplanet. We resolved the collision bands with the interval of xs as ∆xs = 0.002 wacc(0), which have on the order of 10−5−10−3 H. The width of the accretion window is defined as
 (19)
(19)
where xmax and xmin are the two ends of the collision band at a given z (Kuwahara & Kurokawa 2020a,b). Although the SAM transfer to the protoplanet sensitively depends on xs (described later in Sect. 3.3), we ensure that this interval has high enough resolution to estimate the net SAM. We also resolve the collision bands in the vertical direction with ∆zs = 0.05 bx, where bx is the maximum impact parameter of accreted pebbles in the unperturbed flow (Ormel & Kobayashi 2012):
![Mathematical equation: ${b_x} = {b_{x,0}}\exp \left[ { - {{\left( {{{{\rm{St}}} \over 2}} \right)}^{0.65}}} \right],$](/articles/aa/full_html/2023/06/aa45915-23/aa45915-23-eq26.png) (20)
(20)
where bx,0 is described as (Ormel & Klahr 2010; Lambrechts & Johansen 2012; Guillot et al. 2014; Ida et al. 2016; Sato et al. 2016)
 (21)
(21)
Owing to the symmetry of the system, we only considered zs ≥ 0.
The x- and y-components of the initial velocity of the pebble are given by the following drift equations (Weidenschilling 1977b; Nakagawa et al. 1986):
 (22)
(22)
 (23)
(23)
The initial velocity of the pebble in the vertical direction is 0.
The orbital calculation ends when a pebble reaches the protoplanet’s surface (r < rin) or leaves the computational domain (|y| > 40 RHill/H). However, we find that these termination conditions are not sufficient because some pebbles are trapped in the horseshoe region or continue to circulate around the protoplanet. To reduce the computational time, we added the additional termination conditions for these cases. In the former case, the calculation is terminated after the y-directional turns outside the Hill radius are detected five times. In the latter case, the calculation is terminated after the y-directional turns inside the Bondi radius are detected 50 times and the effective Stokes number falls below St (ρg/ρg,∞)−1 ≤ 10−4 in the Epstein drag case, where ρg,∞ is the gas density outside the computational domain.
2.4 Pebble-to-planet angular momentum transfer
When a pebble collides with the protoplanet, we assume that the impact angular momentum is 100% transferred to the protoplanet’s spin. Because of the plane symmetry of the disk, the x and y components of the cumulative angular momentum should cancel each other out. Thus, we only computed the z component of the impact SAM, which is given by (Dones & Tremaine 1993a)
 (24)
(24)
where the second term in the right side of Eq. (24) is a correction term due to the co-rotating frame (e.g., Dones & Tremaine 1993a). In general, the first term can be either positive or negative, while the second term is always positive. The first and second terms in Eq. (24) for a single impact are  and
and  , respectively. When the z-component of the angular momentum does not significantly cancel over many pebble impacts, the ratio of the second term to the first term in Eq. (24) is
  (Eq. (6)). Then, the second term contribution is negligible. The net SAM transferred to the protoplanet, 〈lz〉), is calculated by (Dones & Tremaine 1993a)
 (25)
(25)
where the flux of pebbles entering the collision bands, F(xs, zs), is given by
 (26)
(26)
The pebble density distribution in the z-direction, ρpeb, is assumed to be
![Mathematical equation: ${\rho _{{\rm{peb}}}}\left( z \right) = {{{\sum _{{\rm{peb}}}}} \over {\sqrt {2\pi } {H_{{\rm{peb}}}}}}\exp \left[ { - {1 \over 2}{{\left( {{z \over {{H_{{\rm{peb}}}}}}} \right)}^2}} \right],$](/articles/aa/full_html/2023/06/aa45915-23/aa45915-23-eq36.png) (27)
(27)
where Σpeb is the surface density of pebbles in the disk and Hpeb is the scale height of pebbles (Dubrulle et al. 1995; Cuzzi et al. 1993; Youdin & Lithwick 2007):
 (28)
(28)
where α is the dimensionless turbulent parameter in the disk (Shakura & Sunyaev 1973). We assumed α = 10−3. Because Σpeb terms in the numerator and denominator in Eq. (25) cancel each other out, we do not need to give a specific value of Σpeb.
When the mass and the physical radius of the planet are  and
and  , the SAM for a grazing impact with free-fall velocity is
  . Assuming that the planet bulk density ρp is constant, lz,esc is proportional to
  . When the net specific mean angular momentum,
  , is always proportional to
  , namely when
  is a constant, the spin angular momentum acquired during the growth of the protoplanet up to the physical radius Rp is given by
 (29)
(29)
where  is the breakup frequency. Using the spin angular velocity ω at Rp and assuming that the protoplanet is a sphere of a uniform density, the spin angular momentum is expressed by
 (30)
(30)
From Eqs. (29) and (30), we obtain
 (31)
(31)
at Rp. This means that the protoplaneťs rotation reaches the breakup frequency if pebbles constantly transfer 〈lz〉 ≳ 0.47 lz,esc on average to the protoplanet in the course of its growth.
3 Results
In this section, we present the results obtained by the numerical methods described in Sect. 2. First, we show the results of hydrodynamical simulations in Sect. 3.1. In Sect. 3.2, we show the trajectories of individual pebbles. Section 3.3 shows the SAM transferred by the individual pebbles to the protoplanet. We present the net SAM that the protoplanet acquires as a function of the dimensionless planetary mass and Stokes number of the pebbles in Sect. 3.4, which is our main result. Sections 3.5–3.7 show the dependence on the headwind speed, the smoothing length, and the orbital radius, respectively.
3.1 Protoplanet-induced gas flow
Figure 3a shows an example of a protoplanet-induced flow at the midplane. The result is obtained from the m0100-01au run. The Mach number of the headwind of the gas is ℳhw = 0.03. As shown in previous studies (Ormel et al. 2015b; Kuwahara et al. 2019), protoplanet-induced gas flow near the midplane is characterized by the shear streamlines at |x| ≳ 0.2 and the horseshoe streamlines at |x| ≲ 0.2 (Fig. 3a). The key point in this study is the planetary envelope within the Bondi radius of the planet. The envelope is characterized by circular streamlines around the planet, which rotates in the prograde direction due to the Coriolis force. The prograde rotation of the envelope has a significant effect on pebble trajectories (Sect. 3.2). Figure 3b shows the vertical structure of the protoplanet-induced gas flow at x = 0. The gas from the disk flows in at high latitudes of the Bondi sphere and exits through the midplane.
We note that the Bondi radius is smaller than the physical radius of the protoplanet and the protoplanet does not have an envelope in the cases of the m0001-01au and m0003-01au runs.
3.2 Pebble trajectories
We calculated the trajectories of pebbles influenced by the protoplanet-induced gas flow. Figure 4 shows two typical collision orbits at the midplane in the protoplanet-induced gas flow field obtained from m0100-01au run. In Fig. 4, we assume the Stokes gas drag that is not dependent on the gas density. The Stokes number of pebbles is set to be St = 10−3. To maintain consistency with the hydrodynamical simulation, we assumed ℳhw = 0.03 for the orbital calculation (Eqs. (22) and (23)). The blue and red lines represent the trajectories of pebbles coming from (xs, ys, zs) = (0.312, 40 RHill/H, 0) and (xs, ys, zs) = (−0.333, −40 RHill/H, 0), respectively. Inside the Hill sphere (RHill = 0.32H), the pebbles tend to be gravitationally attracted to the protoplanet. The pebbles give prograde spin rotation to the protoplanet, because they fall onto the protoplanet in counter-clockwise spirals due to the prograde rotation of the envelope.
Figure 5 shows 3D views of the trajectories of the pebbles projected to the x–y, x–z, and y–z planes. The Stokes number of pebbles is St = 10−3. We also assumed the Stokes drag in this orbital calculation. The blue and red lines are trajectories of pebbles coming from ys = 40 RHill/H and ys = −40 RHill/H, respectively. The initial positions of these pebbles are (xs, zs) = (0.307, 0.18) and (xs, zs) = (−0.3275, 0.18). The pebbles coming from high altitudes maintain a constant altitude before entering the Hill sphere. This is because the z component of the tidal force is excluded from the simulations (Sect. 2.3). As shown in the y-z plane projection, when the pebbles approach |y| ~ RBondi/H = 0.1, they sharply descend toward the protoplanet. After the pebbles are caught in the envelope, they suffer strong drag from the gas envelope and accrete onto the protoplanet (Fig. 4), which contributes to the prograde spin of the protoplanet.
Orbits that contribute to the prograde rotation are found in broad parameter ranges of m and St. While some orbits transfer retrograde angular momentum to the protoplanet, prograde collisions always dominate, except when the planetary mass is small (m ≪ 1) and (or) the Stokes number is large (St ≳ 1). As m decreases, the size of the envelope decreases. No envelope forms when RBondi ≲ Rp, corresponding torn m ≲ 1.6 × 10⁻⁴(a/1 au)−3/23. For St ≳ 1, pebble motions are not significantly affected by the gas drag.
The envelope-influenced prograde orbits are more pronounced when we adopt the Epstein gas drag, because the gas density increases steeply toward the planetary surface. In the Epstein drag regime, the effective Stokes number is proportional to  , leading to the strong gas drag force acting on the pebbles within the envelope. When ρg increases and the mean free path of the gas becomes smaller than the pebble size, the drag law switches from the Epstein to the Stokes regime (Eq. (17)). This switch is expected to occur in the vicinity of protoplanets with high gas densities, which limits further increase of the gas drag force. In this study, the switch of the gas drag law is neglected for simplicity.
We note that pebbles could ablate in the high-density lower envelope (Mordasini et al. 2015; Alibert 2017). In this case, pebbles do not directly impact the planetary surface and their angular momentum is deposited to the lower envelope. In this study, assuming that the angular momentum deposited in the lower envelope, which is likely coupled to the solid part of the planet, would be eventually carried to the solid part, we simply integrate the pebble orbits down to the planetary surface without ablation to evaluate the resultant planetary spin (also see Sect. 4.4).
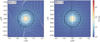 |
Fig. 3 Flow structure around a protoplanet at (a) z = 0 (the midplane of the disk) and (b) x = 0. The result is obtained from the m0100-01au run. The white-filled circle at the center represents the protoplanet, and the black dashed circle represents the Bondi radius. The black arrows represent the direction of the gas flow. The white solid lines represent the gas streamlines. The color contours represent the gas density. |
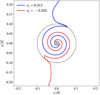 |
Fig. 4 Trajectories of pebbles at the midplane region of the disk influenced by the protoplanet-induced gas flow. We set zs = 0. The blue and red lines correspond to the trajectories of pebbles approaching from the top and bottom of this panel, respectively. The Stokes number of the pebble is set to St = 10−3. The gray circle at the center represents the protoplanet, and the black dashed line represents the Bondi radius. |
3.3 Angular momentum transfer of individual pebbles
Figure 6 shows the heat maps of the SAM transferred by accreted pebbles influenced by the protoplanet-induced gas flow obtained from m0100-01au run. Panels a to d show the results with different Stokes numbers (St = 10−3−100). The red and blue colors indicate the positive and negative SAM that contributes to the prograde and retrograde spins, respectively. When St = 100, there is no accretion band at x < 0 (Fig. 6d).
As shown in Figs. 6a,b, where St = 10−3 and 10−2, pebbles transfer an almost constant positive SAM regardless of their initial positions. As mentioned in Sect. 3.2, pebbles are strongly affected by the prograde rotation of the envelope and circulate around the protoplanet many times before hitting the planetary surface. During this accretion process, the information on the pebbles’ initial positions is lost, and the SAM is independent of the initial positions of pebbles.
Figure 6d, where St = 100, shows that there are prograde and retrograde spin contributions. Pebbles coming from near the edges of the accretion band have positive SAM, while those from the central part of the accretion band have negative SAM. Such orbital patterns are also found by Visser et al. (2020), which investigated the spin of smaller mass bodies without the envelope (m ~ 10−9−10−3). When the Stokes number is large, St = 100, the effect of the prograde envelope on the pebble motion is small, so the impact points on the planetary surface continuously shift from the prograde side to the retrograde side, or vice versa, as the initial positions change.
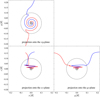 |
Fig. 5 Trajectories of pebbles influenced by the protoplanet-induced gas flow field obtained by the m0100-01au run. These three panels show the same results of orbital calculations, which are projections to the xy-, xz-, and yz-planes, respectively. The blue line represents the trajectory of a pebble with the initial position (xs, ys, zs) = (0.307, 40 RHill/H, 0.18), and the red line represents the trajectory of a pebble with the initial position (xs, ys, zs) = (−0.3275, −40 RHill/H, 0.18). The Stokes number of the pebble is set to St = 10−3. The gray circle at the center represents the protoplanet, and the black dashed line represents the Bondi radius. |
3.4 Net angular momentum transfer
Using the data of the SAM transferred by individual pebbles, we calculated the net SAM from Eq. (25). Figure 7 shows the net SAM transferred to the protoplanet as a function of St for the different planetary mass, m. The orbital radius is 0.1 au. Figure 7a shows the results with unperturbed shear flow of the gas for a comparison. Figures 7b,c show the results in the planet-induced gas flow where we assumed the Stokes and the Epstein gas drag regimes, respectively. In the Epstein drag case (Fig. 7c), the Stokes number represents the value at the staring position where the gas flow is identical to the unperturbed shear flow.
In the case of unperturbed shear flow, the dependence on planetary mass is very weak. The overall trend is that as a pebble’s Stokes number increases, the net SAM acquired by the protoplanet also increases. When the planetary mass and the Stokes number are small (m ≲ 0.003 and St ≲ 10−2), the net SAM transferred to the protoplanet has the negative value. The spin rotation is hardly accelerated to exceed the critical breakup frequency represented by the gray dashed line.
We found that the spin of the protoplanets generated by pebble accretion influenced by the protoplanet-induced gas flow is always prograde regardless of the assumed planetary mass and the Stokes number (Figs. 7b,c). We first focus on Fig. 7b, where we adopt the Stokes gas drag regime. The striking feature is that for pebbles with St ≲ 0.1, the net SAM transferred to the protoplanet is an increasing function of the planetary mass. This is because the azimuthal velocity of the gas envelope increases with the planetary mass. The pebbles with small St spiral onto the planetary surface after they are sufficiently dragged by the gas envelope to acquire prograde rotations (Fig. 4). The enhancement of the spin rotation is much greater than in the case of unperturbed shear flow. In particular, when m ≳ 0.1, the expected spin frequency is close to or even higher than the breakup one for a wide range of Stokes numbers. For pebbles with St ≳ 0.1, because the effect of gas drag by the envelope is weak, the expected spin is strongly prograde, as in the case of the unperturbed shear flow.
In the Epstein gas drag regime, the net SAM transferred to the protoplanet does not differ significantly from that in the Stokes regime (Fig. 7c). Although the effective Stokes number of pebbles decreases as they approach the planetary surface (especially for m = 0.1 and 0.3 with massive envelopes), in reality the drag law for the pebbles is expected to switch to the Stokes regime in the region where the gas density is sufficiently high. Thus, the results shown in Fig. 7c represent a limiting case for extremely effective gas drag in the high-density regions. We note that pebbles with the smaller Stokes number circulate around the protoplanet many times in several cases, and it takes a very long time for these pebbles to reach the planetary surface. In this study, as described in Sect. 2.3, we terminated orbital calculations for such pebbles before they reached the planetary surface in order to reduce the computational cost. For these pebbles, we assumed that they would eventually accrete to the protoplanet with the terminal velocity and provide the SAM expressed by
 (32)
(32)
where υϕ,atm is the ϕ component of the azimuthally averaged gas envelope velocity at the equator of the protoplanet obtained from the hydrodynamical simulation. The parameters for which we used this estimation to calculate the net SAM are shown as dashed lines in Fig. 7.
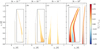 |
Fig. 6 Heat maps of the initial positions of the accreted pebbles with St = 10−3, 10−2, 10−1 and 100 under the influence of the protoplanet-induced gas flow. The gas flow field is obtained from m0100-01au run. The colors indicate the SAM transferred by individual pebbles to the protoplanet, with red contributing to prograde spin and blue contributing to retrograde spin. The two islands in panels a, b, and c correspond to the accretion bands of pebbles coming from the different y directions. We note that due to the low pebble density at the high altitude, the contribution of pebbles coming from high altitude becomes negligible as the Stokes number increases. |
3.5 Dependence on headwind speed
As mentioned in Sect. 2.3, the basic equation given by Eq. (15) includes a simulation parameter of the normalized headwind velocity, ℳhw. So far, we have fixed the Mach number of the headwind of the gas, ℳhw = 0.03. Figure 8 shows the dependence of the net SAM transferred to the protoplanet on the Mach number of the headwind. These results are obtained from the simulations with m = 0.1 at 0.1 au in the protoplanet-induced gas flow fields with different ℳhw (m0100-01au, m0100-01au-Lhw, and m0100-01au-Hhw). These results show that the dependence on the headwind is very weak, regardless of the assumed gas drag regime. The results in Fig. 8 for different ℳhw almost completely overlap with each other.
As described in Sects. 3.2–3.4, the strong prograde spin is caused by the drag from the prograde rotation of the envelope. Pebbles often circulate around the protoplanets many times, losing the information of the initial conditions. Because the density and velocity of the envelope are hardly affected by the headwind, the ℳhw dependence is very weak.
3.6 Dependence on smoothing length
Ideally, a smoothing length should be set to rsm = 0 to resolve the surface of the planet. Up to this point, we only considered the case of rsm = 0. We confirmed that the azimuthal velocity of the envelope reached the steady state with rsm = 0. However, we found that the small but nonzero inward radial gas flow occurs at the region close to the inner boundary, which means that the hydrostatic equilibrium is not established in this region. This unphysical flow pattern could be eliminated by introducing the smoothing length (Ormel et al. 2015b), but the smoothing for the gravitational potential of the planet would affect the azimuthal velocity of the envelope (Ormel et al. 2015b), and hence it would affect the SAM transferred to the protoplanet. In this section, we investigate the dependence on the smoothing length.
Figure 9 shows the dependence on the smoothing length of the planetary gravitational potential (Eq. (14)). These results are calculations based on the hydrodynamical simulations with m = 0.1 at 0.1 au with different smoothing lengths: rsm = 0, 0.1 m, and 0.2 m: m0100-01au, m0100-01au-sm01, and m0100-01au-sm02. The normalized physical radius is rin = Rp/H ≃ 0.014 for m = 0.1 at 0.1 au. We found that as the smoothing length increases, the net SAM decreases. Although the smoothing length is comparable to or smaller than rin, it affects the envelope azimuthal velocity (Ormel et al. 2015a). Larger rsm reduces the azimuthal velocity of the pebble during its spiral accretion process due to the slower rotation of the envelope gas, resulting in smaller angular momentum transferred to the protoplanet. The weak dependence of the smoothing length for relatively large St is also consistent with this argument.
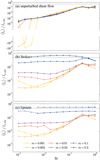 |
Fig. 7 Dependence of net SAM transferred to the protoplanet on the planetary mass (m) and the Stokes number (St), for the unperturbed shear flow with the Stokes drag (panel a), the protoplanet-induced gas flow with the Stokes drag (panel b), and that with the Epstein drag (panel c). The orbital radius is a = 0.1 au. Different colors represent different planetary masses (m). The solid lines represent cases in which the pebbles accrete over the entire collision band, and the dashed lines represent cases in which some or all pebbles did not accrete and the orbital calculation is interrupted (in other words, dashed lines include the data obtained from Eq. (32)). The horizontal gray dashed line at the top of each panel represents the net SAM that corresponds to the breakup frequency. |
3.7 Dependence on the orbital radius of the protoplanet
The equation of motion for pebbles is formally parameterized only by m and St (Eq. (15)). However, the dimensionless physical radius of the protoplanet, Rp/H, depends on a as Rp/H ∝ т1/3/а (Eq. (5)). Therefore, the a dependence is equivalent to the dependence on the normalized physical radius in this study. As discussed below, rin = Rp/H affects the rotation velocity of the planetary envelope and, consequently, the SAM transferred to the protoplanet.
Figure 10 shows the a dependence of the net SAM transferred to the protoplanet. These results are based on the hydrodynamical simulations with a = 0.1 au and lau for m = 0.01 and 0.03 (m0010-01au-sm01, m0010-1au-sm01, m0030-01au-sm01 and m0030-1au-sm01 runs). The solid and dash-dotted lines represent the results for a = 0.1 au and 1 au, respectively. We found that the net SAM generally increases with a. This trend, as well as other results shown in the earlier sections, originates from the envelope. When the normalized physical radius of the protoplanet is small, that is, the orbital distance is large, the gas envelope near the protoplanet’s surface rotates in a deeper gravitational potential, leading to the faster rotation of the envelope. Our hydrodynamical simulations show that the azimuthal velocity of the gas envelope is roughly υϕ,atm ∞ r−1. Other literature also shows a similar r dependence (Ormel et al. 2015a,b). Thus, at the planet surface (r = rin), the impact SAM lz ~ rin υϕ,atm is independent of rin for pebbles with St ≪ 1. The net SAM transferred to the protoplanet normalized by lz,esc is  , because
  . This explains that the net SAM at 1 au is a few times larger than that at 0.1 au for St ≪ 1 (Fig. 10)4. Since the influence of the envelope is weaker for the large Stokes number, the differences in υg and 〈lz〉/lz,esc are smaller when St ≳ 0.1.
As described in Sect. 3.4, the spin frequency exceeds the breakup one when m ≳ 0.3 at 0.1 au (Fig. 7). Figure 10 and the above argument imply that the spin frequency would reach the breakup one when m ≳ 0.1 in the case of 1 au.
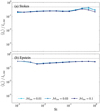 |
Fig. 8 Dependence of net SAM transferred to the protoplanet on the Mach number of the headwind. The dimensionless mass, orbital radius, and smoothing length are m = 0.1, а = 0.1 au and rsm = 0, respectively. Different colors represent different Mach numbers. Colored dashed lines represent the data using Eq. (32). Panel a: results for the Stokes regime. Panel b: results for the Epstein regime. |
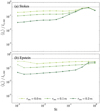 |
Fig. 9 Dependence of net SAM transferred to the protoplanet on the smoothing length. The dimensionless mass, orbital radius, and Mach number of the headwind are m = 0.1, a = 0.1 au and ℳhw = 0.03, respectively. Different colors represent different smoothing lengths. Colored dashed lines represent the data using Eq. (32). Panel a: results for the Stokes regime. Panel b: results for the Epstein regime. |
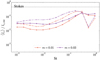 |
Fig. 10 Dependence of net SAM transferred to the protoplanet on the orbital radius of the protoplanet. We adopted the Stokes gas drag regime. The solid and dash-dotted lines correspond to the cases of a = 0.1 au and 1 au, respectively. The Mach number of the headwind is ℳhw = 0.03, and the smoothing length is rsm = 0.1 m. Different colors represent different planetary masses. |
4 Discussion
4.1 Pebble isolation mass
Our results show that the net SAM transferred from pebbles becomes larger as the protoplanet grows (Fig. 7). Based on the discussion in Sect. 3.7, we introduce the following empirical formula. The spin angular velocity of the protoplanet’s rotation exceeds the breakup frequency when the planetary mass reaches
 (33)
(33)
Since the centrifugal force due to the fast spin exceeds the planetary gravity near the equator when ω > ωcrit, the protoplanets would be less likely to grow beyond miso,rot. We refer to miso,rot as the rotation-induced isolation mass. From Eq. (33), the dimensional rotation-induced isolation mass can be described by
 (34)
(34)
where we assumed the solar mass and luminosity.
It has been considered that the planetary growth via pebble accretion is inhibited when the planet grows enough to open up a partial gap in a disk. A pressure bump at the outer edge of the gap prevents pebbles from drifting inward of the planet (Lambrechts et al. 2014; Bitsch et al. 2018; Ataiee et al. 2018). The critical planetary mass for the gap, called the pebble isolation mass (Miso), is estimated to be (Bitsch et al. 2018)
![Mathematical equation: ${M_{{\rm{iso,gap}}}} \simeq 25\,{\left( {{{{H \mathord{\left/ {\vphantom {H a}} \right. \kern-\nulldelimiterspace} a}} \over {0.05}}} \right)^3}\left[ {0.34{{\left( {{3 \over {{\rm{log}}\,10\,\alpha }}} \right)}^4} + 0.66} \right]\,{M_ \oplus }.$](/articles/aa/full_html/2023/06/aa45915-23/aa45915-23-eq55.png) (35)
(35)
Assuming H/a ≃ 0.033 (a/1 au)1/4 and а = 10−3 Eq. (35) is rewritten as
 (36)
(36)
In our dimensionless unit, Eq. (36) can be described by (Kuwahara & Kurokawa 2020b)
 (37)
(37)
The rotation-induced isolation mass (Eq. (33)), miso,rot ~ 0.1 (a/1 au)−1/2, is smaller than the conventional pebble isolation mass for a wide range of the disk (≳ 0.03 au). Equation (33) imposes a severe constraint on the in situ formation of planets via pebble accretion. For instance, the formation of super-Earths at a ≲ 0.1 au would be possible only through collisions between protoplanets after the disk gas dispersal or migration from the outer disk regions after they already grow to the super-Earth sizes.
For m > miso,rot, the pebbles scattered by the fast spin may stay in the planetary envelope as a planetary ring. The fate of the pebble ring is beyond the scope of this paper and is left for future work.
4.2 Comparison to the planets in the Solar System
We compare our results to the terrestrial and icy planets of the Solar System. To maintain consistency with Sects. 2 and 3, we continue to assume the optically-thin limit temperature distribution of the disk around the solar-mass host star (Eq. (3)) and discuss the rotation of the planets based on Figs. 2 and 7.
We first focus on the terrestrial planets in the Solar System. The rotation-induced isolation mass, Miso,rot, is consistent with the current masses of Earth and Venus, while the current masses of Mercury and Mars are smaller than Miso,rot by an order of magnitude (Table 2). Because the conventional pebble isolation mass (Miso,gap) is too large to be consistent with the Earth and Venus (Table 2), an external contingent effect such as the truncation of pebble flux by proto-Jupiter’s core must be considered (e.g., Kruijer et al. 2017). The rotation-induced isolation mass may be helpful in explaining the current masses of the Earth and Venus.
Next, we focus on the ice giants. The current masses of Uranus and Neptune are several times larger than Miso,rot (Table 2). Due to the high-speed rotation generated by pebble accretion influenced by the protoplanet-induced gas flow, the growth of the protoplanets would halt at a few Earth masses. These protoplanets may experience giant impacts during disk dispersal, leading to the formation of icy giants in the outer region of the disk. Actually, the spin axis of Uranus and the orbital plane of its moon systems are tilted by 98 degrees, strongly suggesting that Uranus underwent an giant impact in its final formation stage (e.g., Ida et al. 2020).
The current spin angular velocity of the Mercury, Venus, Earth, Mars, Uranus, and Neptune are +1.0 × 10⁻³, −2.5 × 10⁻⁴, +5.9 × 10⁻², +6.8 × 10⁻², −1.7 × 10⁻¹, and +1.6 × 10⁻¹ ωcrit; the positive (negative) value means that the planet has a prograde (retrograde) spin. Because the spin of Mercury may have been influenced by the solar tide (Colombo 1965), it is not compared with our theoretical prediction. The spin angular momentum of the Earth has been transferred to the Moon’s orbital angular momentum by the tidal orbital expansion over 4.5 Gyr, and so the total angular momentum of the Earth-Moon system should be considered. The converted Earth-Moon’s effective angular velocity is ≃0.29 ωcrit.
Our result predicts ω ~ ωcrit for the Earth. It is high enough to achieve the large angular momentum of the Earth-Moon’s angular momentum, although 2/3 of the angular momentum must be lost by some mechanisms to be comparable to the current value. For Mars, ω ~ 0.1ωcrit is predicted, which is consistent with the current Mars spin.
The major problem in our results is that a planet’s rotation cannot be retrograde. Several bodies in the Solar System rotate in the retrograde direction, such as Pallas, Hygiea, and Venus (Warner et al. 2009). The existence of retrograde-rotating asteroids (≲500 km) can be explained by the absence of the envelope (Visser et al. 2020). For the case of Venus, the influence of the envelope should be considered, but Venus could be marginally influenced by the solar tide (Leconte et al. 2015), which is not considered in this study. Although the nonisothermal hydrodynamical simulations with the viscosity of the fluid and the dust opacity show a weak retrograde motion of the gas within the Hill sphere (Lambrechts & Lega 2017), considering the effect of the viscosity or opacity is beyond the scope of this study.
Orbital radii and masses of terrestrial and icy planets, and the conventional isolation masses and rotation-induced isolation masses at the corresponding orbital radii.
4.3 Moon formation
Our results indicate that an Earth-mass planet at ~1 au has fast spin rotation if it is formed through pebble accretion influenced by the protoplanet-induced gas flow, which has an interesting implication for the formation of the Moon. The giant impact hypothesis is the current standard model for the Moon formation (e.g., Benz et al. 1986; Ida et al. 1997; Canup & Asphaug 2001). Because the giant-impact hypothesis assumes that an oblique impact by a Mars-sized body, it also explains the large angular momentum of the Earth-Moon system. However, it has difficulty accounting for the Moon’s stable isotope ratios that are identical to the Earth’s ones even with the up-to-date high resolution measurements (e.g., Wiechert et al. 2001). The SPH simulations of giant impacts predict that the Moon is composed mainly of materials from the impactor (Canup & Asphaug 2001; Canup 2004, 2008), which is expected to have different isotope ratios from those of the Earth.
To reconcile this inconsistency, Ćuk & Stewart (2012) proposed a model that combines the giant-impact hypothesis and the classical fission hypothesis. If a Ganymede-to-Mercury-mass body impacts the primordial Earth that was already spinning fast with a period as short as 2.3 h (corresponding to ω ≃ 0.61 ωcrit), the Moon is formed mainly from the Earth’s mantle in a fissionlike manner. Our results suggest that the proto-Earth could have acquired such a sufficiently fast rotation by pebble accretion, providing the initial state of (Ćuk & Stewart (2012)’s model.
4.4 Caveats
In our simulations, we ignored several physical processes for simplicity. Here, we list a few physical processes that could affect our results.
The first point is the back-reaction from the pebbles to the gas. Because the gas flow was obtained by the independent hydrodynamical simulations, the back-reaction was neglected. We have shown that pebble motions are significantly changed in the planetary envelope when the Stokes number of the pebbles is small. It implies that a large amount of angular momentum is transferred from the gas envelope to the pebbles and the envelope rotation may be slowed down. The effect of the back-reaction depends on the efficiency of the atmospheric recycling. In our nonisothermal hydrodynamical simulations, the envelope is isolated from the surrounding disk gas, which is consistent with the previous studies (Cimerman et al. 2017; Lambrechts & Lega 2017; Kurokawa & Tanigawa 2018). The isolation of the envelope is caused by the buoyancy, which originated from the entropy gradient (Kurokawa & Tanigawa 2018). This suggests that the atmospheric recycling is inefficient, but the efficiency of the atmospheric recycling under nonisothermal conditions is a controversial issue (Moldenhauer et al. 2021, 2022). Under isothermal conditions, efficient recycling is allowed due to the absence of buoyancy (Ormel et al. 2015b; Fung et al. 2015; Kuwahara et al. 2019; Béthune & Rafikov 2019). If the recycling is fast enough, the effect of the back-reactions can be neglected. Second, we did not consider viscosity of the gas and associated angular momentum exchange between the gas and the protoplanet. A protoplanet grown by pebble accretion would be expected to already have relatively fast rotation (Visser et al. 2020; Visser & Brouwers 2022). The gas velocity field around the protoplanet may change depending on the extent to which the envelope rotation is locked to the protoplanet’s spin. This effect may only occur fairly close to the planet’s surface, but it could be an important factor because it is the last part of a pebble’s orbit before accretion. The third is the ablation that we mention in Sect. 3.2. While the angular momentum exchange between the pebbles and the envelope through gas drag is large in the uppermost layer near the Bondi radius, as shown in Fig. 4, the deposited angular momentum would be transferred to disk regions outside the Bondi radius. On the other hand, the angular momentum deposited to the bottom layer, where pebbles would suffer ablation, is likely to be transferred to the solid part of the planet rather than to the disk region outside the Bondi radius. It suggests that the effect of ablation is negligible. However, more detailed studies are needed to confirm this point.
5 Summary
We investigated how pebble accretion induces the spin of a protoplanet under the influence of the protoplanet-induced gas flow. We performed 3D hydrodynamical simulations of the gas flow around the protoplanet in a local frame. Using the simulated gas velocity (and gas density) field, we numerically integrated the equation of motion of pebbles. We calculated the spin angular momentum per unit mass transferred from individual pebbles to the protoplanet at the collisions. The main results are summarized as follows:
An isolated envelope forms around a protoplanet with ≳103 km in size or ≳ 10−3M⊕ in mass, which rotates in the prograde direction due to the Coriolis force. Pebbles are dragged by the envelope and usually end up with prograde oblique impacts to the protoplanet;
The protoplanet acquires the prograde rotation via pebble accretion influenced by the protoplanet-induced gas flow, regardless of the assumed planetary mass, the Stokes number, the Mach number of the headwind, and the orbital distance of the protoplanet. This is because the prograde contribution from pebbles dominates due to the prograde rotation of the envelope;
As planetary mass increases, the density and rotation velocity of the envelope increase, resulting in greater SAM transfer to the protoplanet. The spin frequency of the protoplanet will exceed the breakup frequency when the dimensionless thermal mass of the planet reaches the rotation-induced isolation mass, miso,rot ≃ 0.1 (a/1 au)−1/2, suggesting that the protoplanet does not grow any further via pebble accretion. The rotation-induced isolation mass could be significantly smaller than the conventional pebble isolation mass.
It is a robust conclusion that an Earth-mass planet at a ~ 1 au acquires fast prograde spin with near-breakup angular velocity (ωcrit) if the planet grows predominantly through pebble accretion under the influence of the protoplanet-induced gas flow. The Earth’s mass is consistent with miso,rot and the predicted spin frequency is comparable to ωcrit, allowing Moon formation in a fission-like manner.
Acknowledgements
We are grateful to an anonymous referee for a very careful and constructive review. We thank Athena++ developers: James M. Stone, Kengo Tomida and Christopher White. This work has profited immensely from discussion with Takayuki Tanigawa, Takanori Sasaki and Satoshi Okuzumi. Numerical computations were in part carried out on Cray XC50 at the Center for Computational Astrophysics at the National Astronomical Observatory of Japan. This work was supported by JSPS KAKENHI Grant numbers 20J20681 and 21H04512.
References
- Alibert, Y. 2017, A&A, 606, A69 [NASA ADS] [CrossRef] [EDP Sciences] [Google Scholar]
- Ataiee, S., Baruteau, C., Alibert, Y., & Benz, W. 2018, A&A, 615, A110 [NASA ADS] [CrossRef] [EDP Sciences] [Google Scholar]
- Benz, W., Slattery, W. L., & Cameron, A. G. W. 1986, Icarus, 66, 515 [NASA ADS] [CrossRef] [Google Scholar]
- Bitsch, B., Morbidelli, A., Johansen, A., et al. 2018, A&A, 612, A30 [NASA ADS] [CrossRef] [EDP Sciences] [Google Scholar]
- Bottke, W. F., Durda, D. D., Nesvorný, D., et al. 2005, Icarus, 175, 111 [Google Scholar]
- Béthune, W., & Rafikov, R. R. 2019, MNRAS, 488, 2365 [Google Scholar]
- Canup, R. M. 2004, Icarus, 168, 433 [NASA ADS] [CrossRef] [Google Scholar]
- Canup, R. M. 2008, Icarus, 196, 518 [NASA ADS] [CrossRef] [Google Scholar]
- Canup, R. M., & Asphaug, E. 2001, Nature, 412, 708 [Google Scholar]
- Chapman, S., & Cowling, T. G. 1970, The Mathematical Theory of Non-uniform Gases. An Account of the Kinetic Theory of Viscosity, Thermal Conduction and Diffusion in Gases (Cambridge University Press) [Google Scholar]
- Cimerman, N. P., Kuiper, R., & Ormel, C. W. 2017, MNRAS, 471, 4662 [Google Scholar]
- Colombo, G. 1965, Nature, 208, 575 [NASA ADS] [CrossRef] [Google Scholar]
- Ćuk, M., & Stewart, S. T. 2012, Science, 338, 1047 [CrossRef] [Google Scholar]
- Cuzzi, J. N., Dobrovolskis, A. R., & Champney, J. M. 1993, Icarus, 106, 102 [NASA ADS] [CrossRef] [Google Scholar]
- Dones, L., & Tremaine, S. 1993a, Icarus, 103, 67 [NASA ADS] [CrossRef] [Google Scholar]
- Dones, L., & Tremaine, S. 1993b, Science, 259, 350 [NASA ADS] [CrossRef] [Google Scholar]
- Dubrulle, B., Morfill, G., & Sterzik, M. 1995, Icarus, 114, 237 [Google Scholar]
- Fehlberg, E. 1969, Low-order Classical Runge-Kutta Formulas with Stepsize Control and Their Application to Some Heat Transfer Problems (National Aeronautics and Space Administration), 315 [Google Scholar]
- Fung, J., Artymowicz, P., & Wu, Y. 2015, ApJ, 811, 101 [Google Scholar]
- Fung, J., Zhu, Z., & Chiang, E. 2019, ApJ, 887, 152 [NASA ADS] [CrossRef] [Google Scholar]
- Gammie, C. F. 2001, ApJ, 553, 174 [Google Scholar]
- Guillot, T., Ida, S., & Ormel, C. W. 2014, A&A, 572, A72 [NASA ADS] [CrossRef] [EDP Sciences] [Google Scholar]
- Hayashi, C. 1981, Progr. Theor. Phys. Suppl., 70, 35 [Google Scholar]
- Ida, S., & Nakazawa, K. 1989, A&A, 224, 303 [NASA ADS] [Google Scholar]
- Ida, S., & Nakazawa, K. 1990, Icarus, 86, 561 [NASA ADS] [CrossRef] [Google Scholar]
- Ida, S., Canup, R. M., & Stewart, G. R. 1997, Nature, 389, 353 [NASA ADS] [CrossRef] [Google Scholar]
- Ida, S., Guillot, T., & Morbidelli, A. 2016, A&A, 591, A72 [NASA ADS] [CrossRef] [EDP Sciences] [Google Scholar]
- Ida, S., Ueta, S., Sasaki, T., & Ishizawa, Y. 2020, Nat. Astron., 4, 880 [Google Scholar]
- Johansen, A., & Lacerda, P. 2010, MNRAS, 404, 475 [NASA ADS] [Google Scholar]
- Kokubo, E., & Ida, S. 2007, ApJ, 671, 2082 [NASA ADS] [CrossRef] [Google Scholar]
- Kruijer, T. S., Burkhardt, C., Budde, G., & Kleine, T. 2017, PNAS, 114, 6712 [NASA ADS] [CrossRef] [Google Scholar]
- Kurokawa, H., & Tanigawa, T. 2018, MNRAS, 479, 635 [Google Scholar]
- Kuwahara, A., & Kurokawa, H. 2020a, A&A, 633, A81 [NASA ADS] [CrossRef] [EDP Sciences] [Google Scholar]
- Kuwahara, A., & Kurokawa, H. 2020b, A&A, 643, A21 [NASA ADS] [CrossRef] [EDP Sciences] [Google Scholar]
- Kuwahara, A., Kurokawa, H., & Ida, S. 2019, A&A, 623, A179 [NASA ADS] [CrossRef] [EDP Sciences] [Google Scholar]
- Kuwahara, A., Kurokawa, H., Tanigawa, T., & Ida, S. 2022, A&A, 665, A122 [NASA ADS] [CrossRef] [EDP Sciences] [Google Scholar]
- Lambrechts, M., & Johansen, A. 2012, A&A, 544, A32 [NASA ADS] [CrossRef] [EDP Sciences] [Google Scholar]
- Lambrechts, M., & Lega, E. 2017, A&A, 606, A146 [NASA ADS] [CrossRef] [EDP Sciences] [Google Scholar]
- Lambrechts, M., Johansen, A., & Morbidelli, A. 2014, A&A, 572, A35 [NASA ADS] [CrossRef] [EDP Sciences] [Google Scholar]
- Leconte, J., Wu, H., Menou, K., & Murray, N. 2015, Science, 347, 632 [NASA ADS] [CrossRef] [Google Scholar]
- Lissauer, J. J., & Kary, D. M. 1991, Icarus, 94, 126 [NASA ADS] [CrossRef] [Google Scholar]
- Lissauer, J. J., Berman, A. F., Greenzweig, Y., & Kary, D. M. 1997, Icarus, 127, 65 [NASA ADS] [CrossRef] [Google Scholar]
- Machida, M. N., Kokubo, E., ichiro Inutsuka, S., & Matsumoto, T. 2008, ApJ, 685, 1220 [NASA ADS] [CrossRef] [Google Scholar]
- Miguel, Y., & Brunini, A. 2010, MNRAS, 406, 1935 [Google Scholar]
- Moldenhauer, T. W., Kuiper, R., Kley, W., & Ormel, C. W. 2021, A&A, 646, L11 [NASA ADS] [CrossRef] [EDP Sciences] [Google Scholar]
- Moldenhauer, T. W., Kuiper, R., Kley, W., & Ormel, C. W. 2022, A&A, 661, A142 [NASA ADS] [CrossRef] [EDP Sciences] [Google Scholar]
- Mordasini, C., Mollière, P., Dittkrist, K. M., Jin, S., & Alibert, Y. 2015, Int. J. Astrobiol., 14, 201 [NASA ADS] [CrossRef] [Google Scholar]
- Nakagawa, Y., Sekiya, M., & Hayashi, C. 1986, Icarus, 67, 375 [Google Scholar]
- Ohtsuki, K., & Ida, S. 1998, Icarus, 131, 393 [NASA ADS] [CrossRef] [Google Scholar]
- Ormel, C. W., & Klahr, H. H. 2010, A&A, 520, A43 [NASA ADS] [CrossRef] [EDP Sciences] [Google Scholar]
- Ormel, C. W., & Kobayashi, H. 2012, ApJ, 747, 115 [NASA ADS] [CrossRef] [Google Scholar]
- Ormel, C. W., Kuiper, R., & Shi, J.-M. 2015a, MNRAS, 446, 1026 [NASA ADS] [CrossRef] [Google Scholar]
- Ormel, C. W., Shi, J.-M., & Kuiper, R. 2015b, MNRAS, 447, 3512 [Google Scholar]
- Sato, T., Okuzumi, S., & Ida, S. 2016, A&A, 589, A15 [NASA ADS] [CrossRef] [EDP Sciences] [Google Scholar]
- Shakura, N. I., & Sunyaev, R. A. 1973, A&A, 24, 337 [NASA ADS] [Google Scholar]
- Steinberg, E., & Sari, R. 2015, AJ, 149, 124 [NASA ADS] [CrossRef] [Google Scholar]
- Stone, J. M., Tomida, K., White, C. J., & Felker, K. G. 2020, ApJS, 249, 4 [NASA ADS] [CrossRef] [Google Scholar]
- Visser, R. G., & Brouwers, M. G. 2022, A&A, 663, A164 [NASA ADS] [CrossRef] [EDP Sciences] [Google Scholar]
- Visser, R. G., Ormel, C. W., Dominik, C., & Ida, S. 2020, Icarus, 335, 113380 [NASA ADS] [CrossRef] [Google Scholar]
- Warner, B. D., Harris, A. W., & Pravec, P. 2009, Icarus, 202, 134 [NASA ADS] [CrossRef] [Google Scholar]
- Weidenschilling, S. J. 1977a, MNRAS, 180, 57 [Google Scholar]
- Weidenschilling, S. J. 1977b, Ap&SS, 51, 153 [Google Scholar]
- White, C. J., Stone, J. M., & Gammie, C. F. 2016, ApJS, 225, 22 [NASA ADS] [CrossRef] [Google Scholar]
- Wiechert, U., Halliday, A. N., Lee, D.-C., et al. 2001, Science, 294, 345 [CrossRef] [Google Scholar]
- Youdin, A. N., & Lithwick, Y. 2007, Icarus, 192, 588 [NASA ADS] [CrossRef] [Google Scholar]
For m = 0.03 and 0.1, to avoid numerically artificial vortices, we used a smaller simulation domain of r < 0.6 rout (see Kuwahara & Kurokawa 2020a,b, for the discussion).
Johansen & Lacerda (2010) considered the solid body with m ~ 10−6 and found that a prograde accretion disk formed around the body under the influence of the strong back-reaction from pebbles to gas. They reported that the prograde accretion disk is completely dominated by pebbles; thus, the accretion disk in Johansen & Lacerda (2010) is different from the gas envelope rotating in a prograde manner considered in this study.

All Tables
Orbital radii and masses of terrestrial and icy planets, and the conventional isolation masses and rotation-induced isolation masses at the corresponding orbital radii.
All Figures
|
Fig. 1 Schematic picture of orbital calculation of pebbles. The starting point of pebbles is (xs, |ys| = 40 RHill, zs). The x- and z-coordinates of the starting point of pebbles, xs and zs, are parameters. The green circle area represents the hydrodynamical simulation domain with radius rout. We used the gas velocity obtained from the hydrodynamical simulation to calculate the gas drag force acting on the pebble within rout. Outside rout, the gas velocity is assumed to be the speed of the sub-Keplerian shear flow. |
| In the text | |
|
Fig. 2 Relationship between dimensionless planetary masses and dimensional ones in the case of the radially optically thin limit temperature distribution of the disks around the solar mass host star. Each line represents the dimensionless planetary mass as a function of the orbital radius. Different colors correspond to different m. The red dots represent the Solar System planets. |
| In the text | |
|
Fig. 3 Flow structure around a protoplanet at (a) z = 0 (the midplane of the disk) and (b) x = 0. The result is obtained from the m0100-01au run. The white-filled circle at the center represents the protoplanet, and the black dashed circle represents the Bondi radius. The black arrows represent the direction of the gas flow. The white solid lines represent the gas streamlines. The color contours represent the gas density. |
| In the text | |
|
Fig. 4 Trajectories of pebbles at the midplane region of the disk influenced by the protoplanet-induced gas flow. We set zs = 0. The blue and red lines correspond to the trajectories of pebbles approaching from the top and bottom of this panel, respectively. The Stokes number of the pebble is set to St = 10−3. The gray circle at the center represents the protoplanet, and the black dashed line represents the Bondi radius. |
| In the text | |
|
Fig. 5 Trajectories of pebbles influenced by the protoplanet-induced gas flow field obtained by the m0100-01au run. These three panels show the same results of orbital calculations, which are projections to the xy-, xz-, and yz-planes, respectively. The blue line represents the trajectory of a pebble with the initial position (xs, ys, zs) = (0.307, 40 RHill/H, 0.18), and the red line represents the trajectory of a pebble with the initial position (xs, ys, zs) = (−0.3275, −40 RHill/H, 0.18). The Stokes number of the pebble is set to St = 10−3. The gray circle at the center represents the protoplanet, and the black dashed line represents the Bondi radius. |
| In the text | |
|
Fig. 6 Heat maps of the initial positions of the accreted pebbles with St = 10−3, 10−2, 10−1 and 100 under the influence of the protoplanet-induced gas flow. The gas flow field is obtained from m0100-01au run. The colors indicate the SAM transferred by individual pebbles to the protoplanet, with red contributing to prograde spin and blue contributing to retrograde spin. The two islands in panels a, b, and c correspond to the accretion bands of pebbles coming from the different y directions. We note that due to the low pebble density at the high altitude, the contribution of pebbles coming from high altitude becomes negligible as the Stokes number increases. |
| In the text | |
|
Fig. 7 Dependence of net SAM transferred to the protoplanet on the planetary mass (m) and the Stokes number (St), for the unperturbed shear flow with the Stokes drag (panel a), the protoplanet-induced gas flow with the Stokes drag (panel b), and that with the Epstein drag (panel c). The orbital radius is a = 0.1 au. Different colors represent different planetary masses (m). The solid lines represent cases in which the pebbles accrete over the entire collision band, and the dashed lines represent cases in which some or all pebbles did not accrete and the orbital calculation is interrupted (in other words, dashed lines include the data obtained from Eq. (32)). The horizontal gray dashed line at the top of each panel represents the net SAM that corresponds to the breakup frequency. |
| In the text | |
|
Fig. 8 Dependence of net SAM transferred to the protoplanet on the Mach number of the headwind. The dimensionless mass, orbital radius, and smoothing length are m = 0.1, а = 0.1 au and rsm = 0, respectively. Different colors represent different Mach numbers. Colored dashed lines represent the data using Eq. (32). Panel a: results for the Stokes regime. Panel b: results for the Epstein regime. |
| In the text | |
|
Fig. 9 Dependence of net SAM transferred to the protoplanet on the smoothing length. The dimensionless mass, orbital radius, and Mach number of the headwind are m = 0.1, a = 0.1 au and ℳhw = 0.03, respectively. Different colors represent different smoothing lengths. Colored dashed lines represent the data using Eq. (32). Panel a: results for the Stokes regime. Panel b: results for the Epstein regime. |
| In the text | |
|
Fig. 10 Dependence of net SAM transferred to the protoplanet on the orbital radius of the protoplanet. We adopted the Stokes gas drag regime. The solid and dash-dotted lines correspond to the cases of a = 0.1 au and 1 au, respectively. The Mach number of the headwind is ℳhw = 0.03, and the smoothing length is rsm = 0.1 m. Different colors represent different planetary masses. |
| In the text | |
Current usage metrics show cumulative count of Article Views (full-text article views including HTML views, PDF and ePub downloads, according to the available data) and Abstracts Views on Vision4Press platform.
Data correspond to usage on the plateform after 2015. The current usage metrics is available 48-96 hours after online publication and is updated daily on week days.
Initial download of the metrics may take a while.