Fig. 7
Download original image
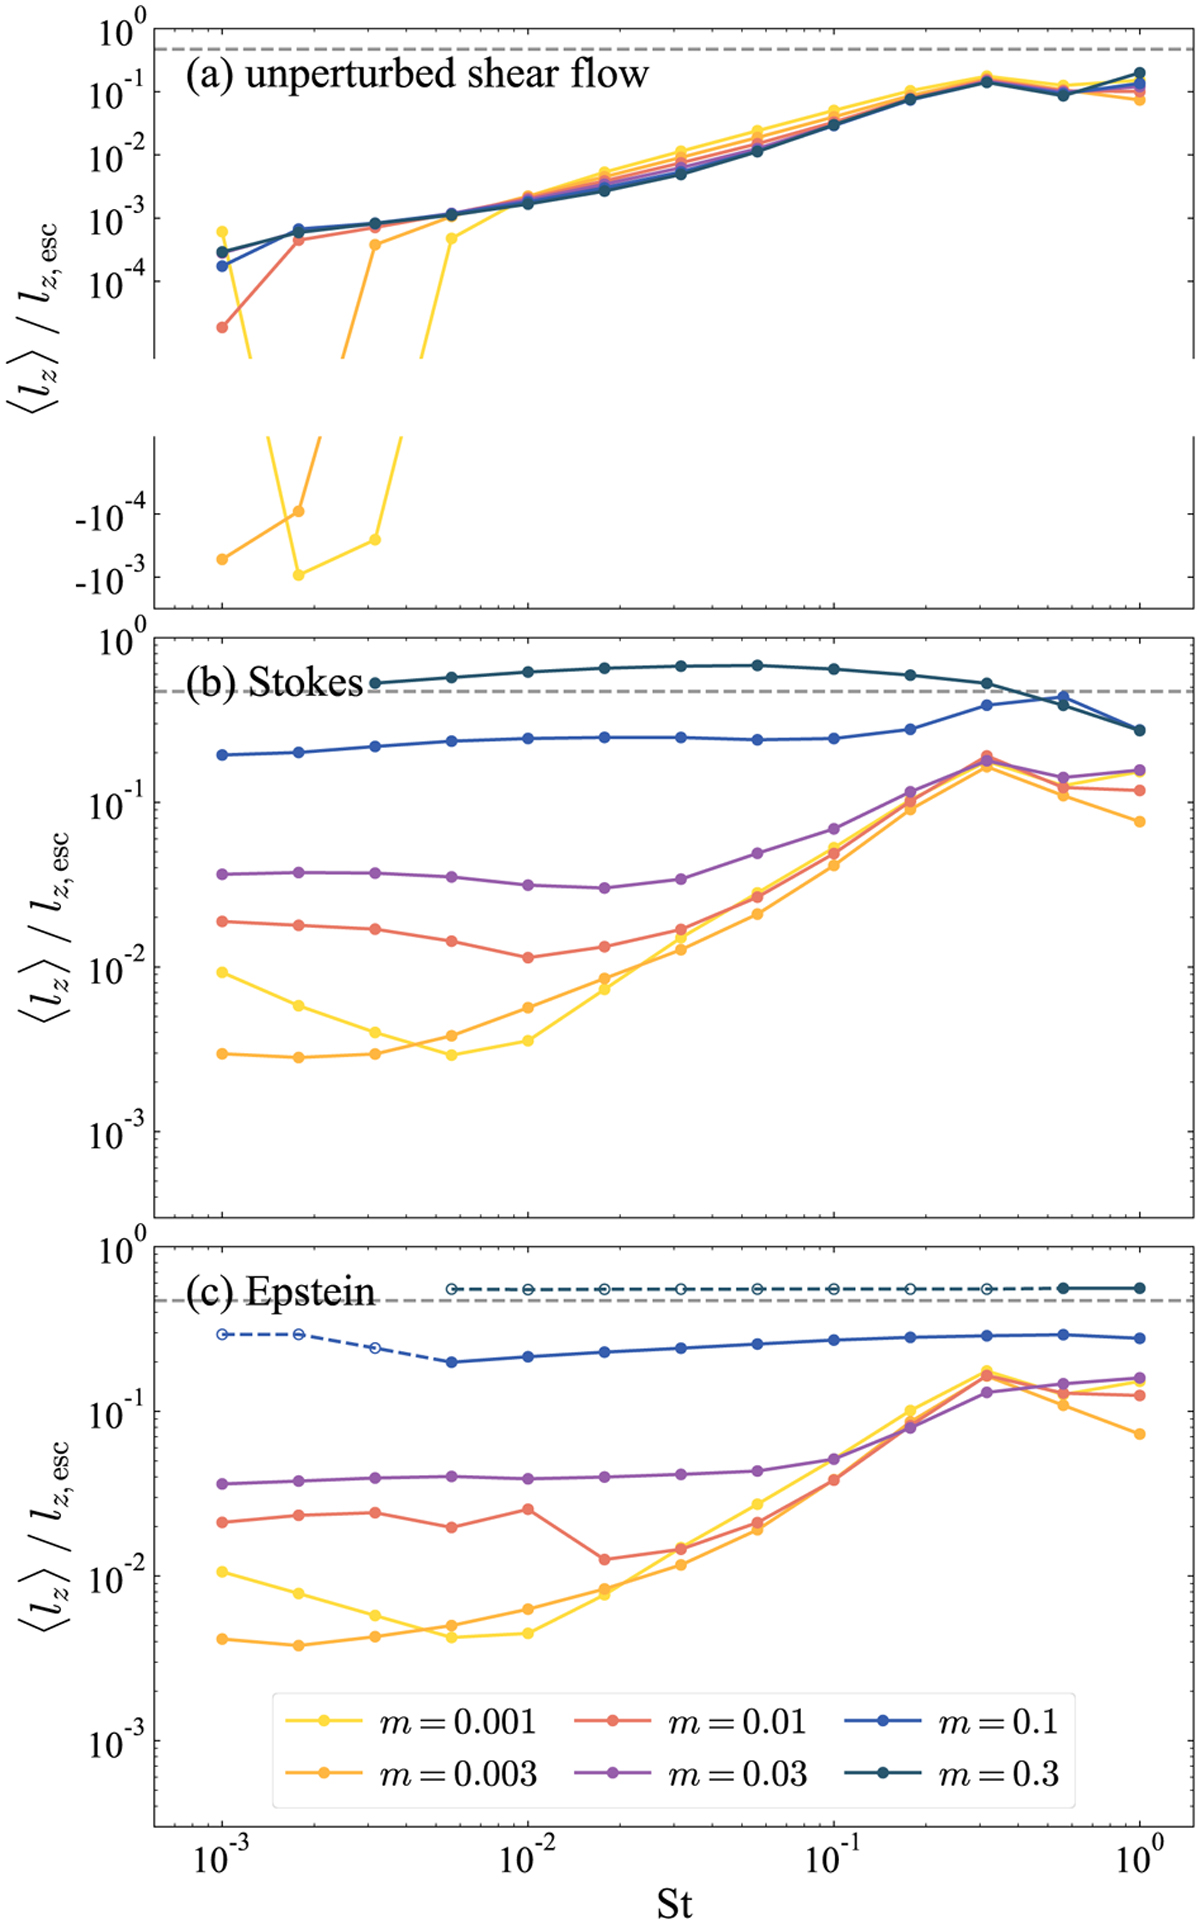
Dependence of net SAM transferred to the protoplanet on the planetary mass (m) and the Stokes number (St), for the unperturbed shear flow with the Stokes drag (panel a), the protoplanet-induced gas flow with the Stokes drag (panel b), and that with the Epstein drag (panel c). The orbital radius is a = 0.1 au. Different colors represent different planetary masses (m). The solid lines represent cases in which the pebbles accrete over the entire collision band, and the dashed lines represent cases in which some or all pebbles did not accrete and the orbital calculation is interrupted (in other words, dashed lines include the data obtained from Eq. (32)). The horizontal gray dashed line at the top of each panel represents the net SAM that corresponds to the breakup frequency.
Current usage metrics show cumulative count of Article Views (full-text article views including HTML views, PDF and ePub downloads, according to the available data) and Abstracts Views on Vision4Press platform.
Data correspond to usage on the plateform after 2015. The current usage metrics is available 48-96 hours after online publication and is updated daily on week days.
Initial download of the metrics may take a while.