Fig. 4
Download original image
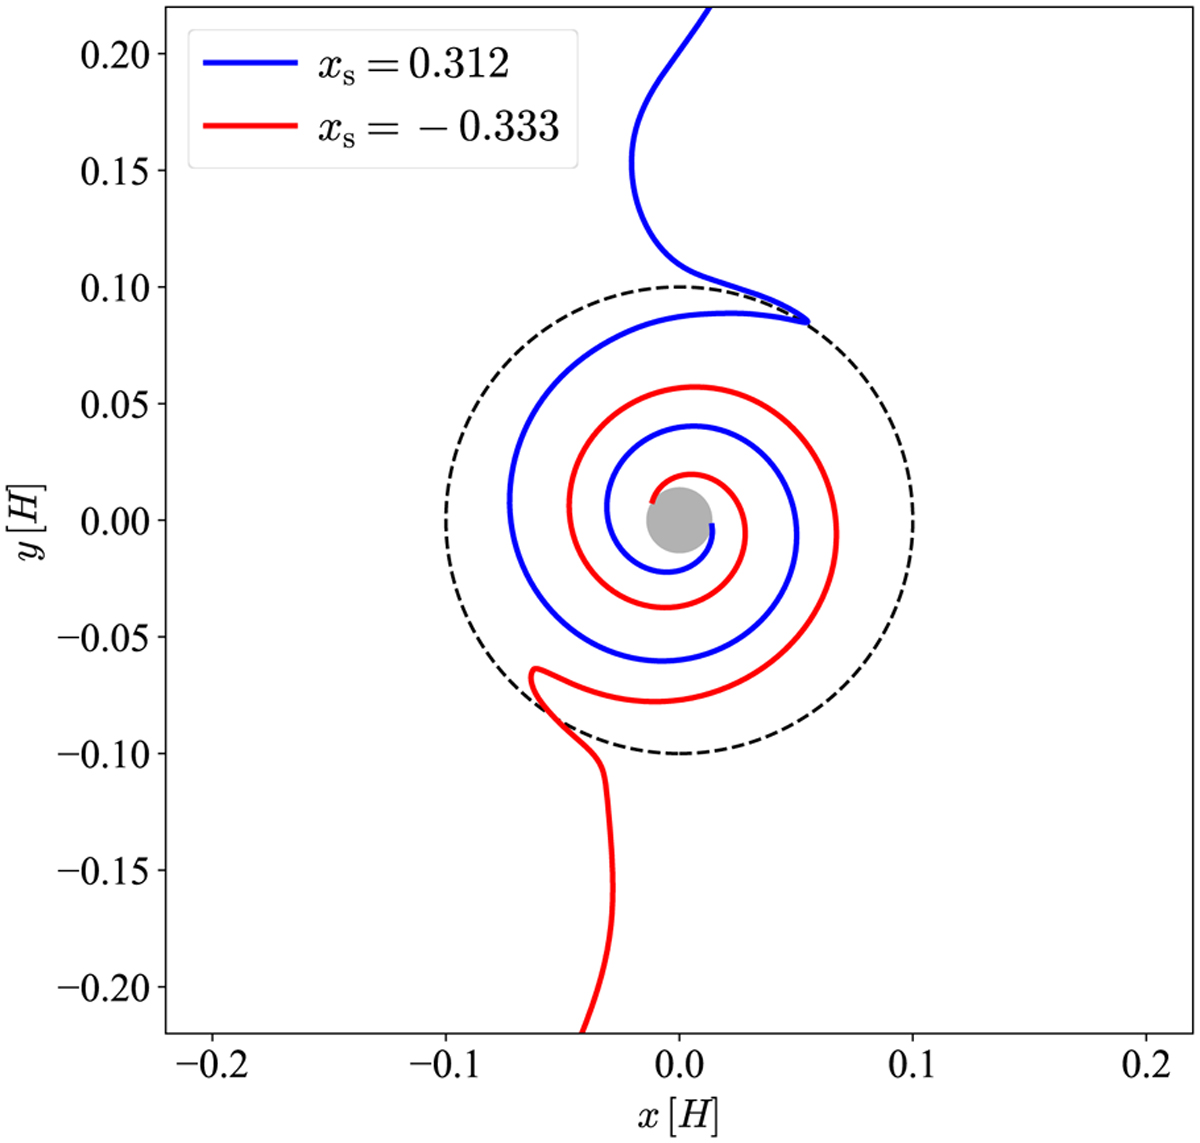
Trajectories of pebbles at the midplane region of the disk influenced by the protoplanet-induced gas flow. We set zs = 0. The blue and red lines correspond to the trajectories of pebbles approaching from the top and bottom of this panel, respectively. The Stokes number of the pebble is set to St = 10−3. The gray circle at the center represents the protoplanet, and the black dashed line represents the Bondi radius.
Current usage metrics show cumulative count of Article Views (full-text article views including HTML views, PDF and ePub downloads, according to the available data) and Abstracts Views on Vision4Press platform.
Data correspond to usage on the plateform after 2015. The current usage metrics is available 48-96 hours after online publication and is updated daily on week days.
Initial download of the metrics may take a while.