| Issue |
A&A
Volume 673, May 2023
|
|
|---|---|---|
| Article Number | A77 | |
| Number of page(s) | 19 | |
| Section | Interstellar and circumstellar matter | |
| DOI | https://doi.org/10.1051/0004-6361/202245637 | |
| Published online | 10 May 2023 | |
The ALMA view of MP Mus (PDS 66): A protoplanetary disk with no visible gaps down to 4 au scales★
1
Institute of Astronomy, University of Cambridge,
Madingley Road,
Cambridge
CB3 0HA,
UK
e-mail: This email address is being protected from spambots. You need JavaScript enabled to view it.
2
European Southern Observatory,
3107,
Alonso de Córdova,
Vitacura, Santiago,
Chile
3
European Southern Observatory,
Karl-Schwarzschild-Str. 2,
85748
Garching bei München,
Germany
4
Departamento de Física, Universidad de Santiago de Chile,
Av. Victor Jara
3659,
Santiago,
Chile
5
Millennium Nucleus on Young Exoplanets and their Moons (YEMS),
Chile
6
Center for Interdisciplinary Research in Astrophysics and Space Exploration (CIRAS), Universidad de Santiago de Chile,
Estación Central,
Chile
7
Université Grenoble Alpes, CNRS, IPAG,
38000
Grenoble,
France
8
Department of Physics and Astronomy, University of Victoria,
Victoria,
BC V8P 5C2,
Canada
9
Instituto de Física y Astronomía, Facultad de Ciencias, Universidad de Valparaíso,
Av. Gran Bretaña
1111,
Valparaíso,
Chile
10
Núcleo Milenio de Formación Planetaria – NPF,
Valparaíso,
Chile
11
Instituto de Astrofísica, Universidad Andres Bello,
Fernandez Concha 700,
Las Condes, Santiago RM,
Chile
12
Joint ALMA Observatory,
Avenida Alonso de Córdova 3107,
Vitacura, Santiago,
Chile
13
Astronomy Department, University of California,
Berkeley,
CA 94720-3411,
USA
14
Department of Astronomy and Institute for Astrophysical Research, Boston University,
725 Commonwealth Avenue,
Boston,
MA 02215,
USA
15
Observatorio Astronómico Nacional (OAN, IGN),
Calle Alfonso XII 3,
28014
Madrid,
Spain
16
Jet Propulsion Laboratory, California Institute of Technology,
4800 Oak Grove Drive,
Pasadena,
CA 91109,
USA
Received:
7
December
2022
Accepted:
17
February
2023
Abstract
Aims. We aim to characterize the protoplanetary disk around the nearby (d ~ 100 pc), young solar analog MP Mus (PDS 66) and to reveal any signs of planets or ongoing planet formation in the system.
Methods. We present new ALMA observations of MP Mus at 0.89 mm, 1.3 mm, and 2.2 mm with angular resolutions of ~1″, 0.05″, and 0.25″, respectively. These data probe the dust and gas in the disk with unprecedented detail and sensitivity.
Results. The disk appears smooth down to the 4 au resolution of the 1.3 mm observations, in contrast with most disks observed at comparable spatial scales. The dust disk has a radius of 60±5 au, a dust mass of 0.14-0.06+0.11 MJup, and a millimeter spectral index <2 in the inner 30 au, suggesting optically thick emission from grains with a high albedo in this region. Several molecular gas lines are also detected extending up to 130±15 au, similar to small grains traced by scattered light observations. Comparing the fluxes of different CO isotopologues with previous models yields a gas mass of 0.1–1 MJup, implying a gas-to-dust ratio of 1–10. We also measured a dynamical stellar mass of Mdyn = 1.30±0.08 M⊙ and derived an age of 7–10 Myr.
Conclusions. The survival of large grains in an evolved disk without gaps or rings is surprising, and it is possible that existing substructures remain undetected due to optically thick emission at 1.3 mm. Alternatively, small structures may still remain unresolved with the current observations. Based on simple scaling relations for gap-opening planets and gap widths, this lack of substructures places upper limits to the masses of planets in the disk as low as 2 M⊕−0.06 MJup at r > 40 au. The lack of millimeter emission at radii r > 60 au also suggests that the gap in scattered light between 30 and 80 au is likely not a gap in the disk density, but a shadow cast by a puffed-up inner disk.
Key words: accretion, accretion disks / protoplanetary disks / planets and satellites: formation / stars: individual: MP Mus / stars: pre-main sequence / techniques: interferometric
Reduced images and datacubes are also available at the CDS via anonymous ftp to cdsarc.cds.unistra.fr (130.79.128.5) or via https://cdsarc.cds.unistra.fr/viz-bin/cat/J/A+A/673/A77
© The Authors 2023
 Open Access article, published by EDP Sciences, under the terms of the Creative Commons Attribution License (https://creativecommons.org/licenses/by/4.0), which permits unrestricted use, distribution, and reproduction in any medium, provided the original work is properly cited.
This article is published in open access under the Subscribe to Open model. This email address is being protected from spambots. You need JavaScript enabled to view it. to support open access publication.
1 Introduction
Our theories of planet formation are largely informed by observations of protoplanetary disks in young, nearby star-forming regions. Both surveys and studies of individual systems have built a general understanding of properties such as the disk typical lifetimes, accretion rates, masses, and sizes (e.g., see Manara et al. 2022; Miotello et al. 2022; Pascucci et al. 2022, and other Protostars and Planets VII chapters for a recent review of the field), all of which are crucial to characterize the timescales and environment in which planets form. In recent years, the improved angular resolution and sensitivity of instruments and observatories such as the Spectro-Polarimetric High-contrast Exoplanet REsearch instrument (SPHERE) and the Atacama Large Millimeter/submillimeter Array (ALMA) have also revealed gaps, rings, and other substructures to be very common in protoplanetary disks (e.g., Long et al. 2018; Andrews et al. 2018a; Avenhaus et al. 2018), providing new clues about planet-disk interactions and the underlying population of newborn planets.
Although a large portion of our knowledge of protoplanetary disk properties comes from statistical analysis of large samples, there are a few individual sources that particularly impacted in our understanding of planet formation. Perhaps the most iconic example of such a system is TW Hya, which hosts what is arguably the most and best studied protoplanetary disk to date. A combination of different factors make TW Hya a unique cornerstone in the study of planet formation. At a distance of only 60 pc (Gaia Collaboration 2021), it is significantly closer than the nearest (140–400 pc) star-forming regions such as Taurus, Ophiuchus, Lupus, Chamaeleon, Upper Scorpius or the Orion Molecular Cloud. Its proximity and almost face-on orientation allow for very detailed studies of the disk structure: high angular resolution observations of the gas and dust components have revealed, among other features, a concentric system of rings and gaps (including an inner gap as small as 1 au, Andrews et al. 2016), a clump of dust at ~50 au which may be associated with circumplanetary material (Tsukagoshi et al. 2019), a spiral structure in its gas component (Teague et al. 2019), and shadows in scattered light moving azimuthally across the disk surface, probably cast by the inner disk (Debes et al. 2017). It is also one of the few protoplanetary disks for which a detection of hydrogen deuteride (HD) is available, allowing for a CO-independent estimate of its mass (Bergin et al. 2013) and dust-to-gas mass ratio (Macías et al. 2021), as well as the only disk in which line polarization has been measured (Teague et al. 2021). Its 0.6 M⊙ stellar mass also makes it a great target to better understand the early stages of the Solar System. TW Hya greatly exemplifies the potential of nearby protoplanetary disks for planet formation studies.
Within 100 pc, the only other gas-rich disk around a single star is MP Muscae (MP Mus, PDS 66), a K1V star (Mamajek et al. 2002) located at 97.9±0.1 pc (Gaia Collaboration 2021). It was originally identified as a classical T Tauri star by Gregorio-Hetem et al. (1992) and first believed to belong to the ~ 17 Myr old Lower Centaurus-Crux association (Mamajek et al. 2002), but later studies of its kinematic properties and parallax showed it to be a member of the younger, 3–5 Myr old ϵ Chamaeleon (ϵ Cha) association (Torres et al. 2008; Murphy et al. 2013; Dickson-Vandervelde et al. 2021). The source is still accreting weakly (Pascucci et al. 2007; Ingleby et al. 2013) at its estimated age of 7–10 Myr, and it hosts a gas-rich disk extending up to 130 au (Kastner et al. 2010). The spectral energy distribution (SED) and mid-IR spectra of the system have also been studied (Schütz et al. 2005; Bouwman et al. 2008; Cortes et al. 2009), revealing signs of grain growth in the disk. More recently, Wolff et al. (2016) and Avenhaus et al. (2018) presented scattered light observations from the Gemini Planet Imager (GPI) and the SPHERE instrument, which revealed a drop in the disk brightness between 60–80 au. If this drop corresponds to a gap in the disk surface density, then it could be produced by the gravitational influence of one or multiple planets, representing an excellent source to study recently formed planets in a nearby system. With a stellar mass of 1.3 M⊙, MP Mus may be the nearest analog to the young Solar System.
Despite the obvious interest of MP Mus and many of its aspects already being well characterized, it still remains comparatively unexplored at millimeter wavelengths. Here we present ALMA observations of MP Mus, including 0.89 mm (Band 7), 1.3 mm (Band 6), and 2.2 mm (Band 4) continuum emission as well as several molecular gas lines. These observations, with an angular resolution down to 4 au at 1.3 mm, provide a wealth of new information and an unprecedented view of the system. We describe the ALMA observations as well as reprocessing of ancillary SPHERE data in Sect. 2. We then present the results and analysis in Sect. 3, and discuss their implications in Sect. 4. Finally, the main findings are summarized in Sect. 5.
2 Observations and data processing
2.1 ALMA observations
MP Mus was observed during ALMA Cycle 5 by three different programs at 0.89 mm (Band 7), 1.3 mm (Band 6), and 2.2 mm (Band 4). Project 2017.1.01687.S (P.I.: Álvaro Ribas) included observations in Bands 4 and 7, while both projects 2017.1.01167.S (P.I.: Sebastián Pérez, part of the Disks ARound TTauri Stars with ALMA (DARTTS-A) programme) and 2017.1.01419.S (P.I.: Claudio Cáceres) used Band 6. Observations with two antenna configurations exist in all cases except for the Band 7 data, for which only observations with a compact configuration are available. Also, two different executions of the Band 4 compact configuration were made. A summary of the different datasets used and the corresponding correlator configurations is available in Tables 1 and 2. We used the standard pipeline calibration provided by ALMA staff using CASA (McMullin et al. 2007) version 5.1.1-5, including water vapor radiometer and system temperature correction, as well as bandpass, amplitude, and phase calibrations. Some additional flagging was applied to the Band 6 and Band 7 data.
Continuum emission from the disk was clearly detected with a high signal to noise ratio (S/N) at the three wavelengths. Therefore, after pipeline calibration, we performed phase only self-calibration on each individual dataset using the mtmfs deconvolver, Briggs weighting, a robust value of 0.5, and nterms = 2. Channels with emission lines were excluded during this process. We then rescaled all the data in each band to a common flux value (as reference, we chose the flux of the observation closest in time to observations of the corresponding amplitude calibrator by the ALMA observatory), set their phase centers to that of a Gaussian fit to the data (i.e., centered on the peak of the disk emission), and then set them to a common coordinate to correct for pointing deviations and proper motion. In the case of the Band 6 observations, we also performed one final round of phase only self-calibration to the combined data to ensure that they were properly aligned. The self-calibration process improved the peak S/N by factors of 2–10, depending on the dataset.
2.2 SPHERE scattered light observations
MP Mus was observed in dual-beam polarimetric imaging mode (DPI, de Boer et al. 2020; van Holstein et al. 2020) with the InfraRed Dual-band Imager and Spectrograph (IRDIS) at SPHERE within the DARTTS-program. The data were taken in J-band and H-band and presented in Avenhaus et al. (2018, see this reference for details on the observational setup). We rereduced the DARTTS scattered light data with the reduction pipeline IRDAP1 (IRDIS Data reduction for Accurate Polarimetry, version 1.3.3, van Holstein et al. 2020), which uses a data-independent polarization model specific for the optical instrument to correct for instrumental polarization and crosstalk. The double-sum/double-difference technique provides the total intensity I and the linear polarization components Q and U (rotated by 45° with respect to each other) as data products. The total polarized intensity can be calculated from those components:
 (1)
(1)
However, in the case of a single central light source and single-scattering events, it is convenient to transform the polarized components to polar coordinates (Schmid et al. 2006; de Boer et al. 2020):
 (2)
(2)
Here, positive Qϕ is the polarization component perpendicular to the direction of the star. Positive Qϕ is expected to capture all stellar light that was polarized in single-scattering events with the additional benefit of a lower noise level than PI due to the lack of squared operations. On the other hand, significant signal in Uϕ or negative Qϕ can indicate regions where light is scattered more than once (Canovas et al. 2015) or where other, off-centered light sources contribute significantly to the scattering (Weber et al. 2023).
The reprocessing of the SPHERE observations does not differ significantly from the findings of Avenhaus et al. (2018), but it provides additional information about the angle and degree of linear polarization of the stellar halo. These results are discussed in Sect. 3.3.
Summary of ALMA observations.
Correlator configuration of the different ALMA projects used in this study.
3 Results
The new ALMA observations can be used to derive several parameters of the MP Mus system, including dust, gas, and stellar masses, its age, the spectral index of the millimeter continuum emission, and the overall morphology of the disk. The SPHERE observations provide additional information about the polarization level and the distribution of small grains in the system. The corresponding analysis is described throughout this section, and we provide a summary of the derived properties in Table 3.
Summary of results derived for MP Mus.
3.1 Dust continuum
3.1.1 Continuum images and fluxes
We synthesized continuum images at 0.89 mm, 1.3 mm, and 2.2 mm from the self-calibrated data described in Sect. 2 using the tclean algorithm with the mtmfs deconvolver and nterms = 2. For each dataset at 1.3 and 2.2mm, the extended and compact configurations were combined to produce the continuum images (in the particular case of the 1.3 mm data from project 2017.1.01419.S, the compact configuration was excluded since it was noisier and did not improve the image sensitivity). A robust value of 0.5 was used to synthesize the images to measure fluxes, resulting in beam sizes of 1.0″ ×0.82″, 0.12″ ×0.10″, and 0.39″ ×0.31″ at 0.89mm, 1.3 mm, and 2.2mm, respectively. The disk around MP Mus is clearly detected at all wavelengths (peak S/N values of several hundreds/thousands) and is well resolved in both the 1.3 mm and 2.2mm observations. We used aperture photometry to estimate continuum fluxes from these images, obtaining 370+40 mJy at 0.89 mm, 148+7 mJy at 1.3 mm, and 49+2 mJy at 2.2 mm (see Table 4). These uncertainties are largely dominated by absolute calibration and not the noise in the images. The emission at 1.3 mm and 2.2 mm extends up to 60 au (0.6″), as determined from the 3–5 σ contours. To ease the comparison with other studies, we also list the radii enclosing 68% and 90% of the total flux in Table 5. Based on the most compact antenna configuration in each band (Table 1), the maximum recoverable scales are ~1·0.8″, 2.9″, and 8.3″at 2.2mm, 1.3mm and 0.89mm, respectively2, which are significantly larger than the observed disk size. Therefore, the observations are likely recovering all the emission from the disk. We also produced images with a lower robust value of −0.5 to try to reveal small substructures, reaching angular resolutions of 0.89 × 0.66″, 0.06″ × 0.04″, and 0.25″ × 0.19″at 0.89 mm, 1.3 mm, and 2.2 mm (corresponding to ~75, 4, and 20 au at 98 pc). Interestingly, the disk appears smooth even at such resolutions, with no clear rings, gaps, or asymmetries. The continuum image at 1.3 mm is shown in Fig. 1, and the 0.89 mm and 2.2 mm observations can be found in Appendix A.
3.1.2 Disk dust mass
Assuming that the (sub)millimeter emission from the disk is optically thin and isothermal, the measured flux is linearly related to the dust mass (e.g., Beckwith et al. 1990):
 (3)
(3)
where Mdust is disk dust mass, Fv is the flux at the observed frequency v, d is the distance to the source, κv is the dust opacity at the frequency v, and Bv(Tdust) is the blackbody emission at the corresponding frequency and dust temperature Tdust. Since we have observations at three different frequencies, we can compute three dust mass values. We adopted standard values for the opacity and dust temperatures of κ230 GHz = 2.3 cm2 g−1 and Tdust = 20 K (e.g., Andrews & Williams 2005), and a distance of d = 98 pc (Gaia Collaboration 2021). For the observations at 0.89 mm and 2.2 mm, we computed the corresponding κv value using a power-law dependence of the opacity with frequency, that is, κv = κ230 GHz × (v/230 GHz)β, where β is between 0.0 and 0.6 for most protoplanetary disks (e.g., Tazzari et al. 2021, also in agreement with the β range of 0.1– 0.4 derived for MP Mus in Sect. 4.2). We bootstrapped the dust masses and their uncertainties by adopting uncertainties of 5K for Tdust and 20% for κ230 GHz, and a uniform distribution of β values between 0 and 0.6. The derived disk dust masses are  MJup,
MJup,  MJup, and
  MJup at 0.89 mm, 1.3 mm, and 2.2 mm (the reported values correspond to the median and the 16%, and 84% percentiles). These values are all compatible with each other, and we adopt a final dust mass value of
  MJup as the average of the three measurements.
3.1.3 1.3 mm continuum radial profile
To further investigate the presence (or lack) of substructures in the disk, we focused on the 1.3 mm continuum data since they have the highest angular resolution (~4 au in the case of the robust = −0.5 image). We first de-projected this image adopting a disk inclination of 32° and a position angle (PA) of 10° based on a Gaussian fit to the data, in full agreement with previous estimates from scattered light observations (e.g., Schneider et al. 2014; Wolff et al. 2016; Avenhaus et al. 2018). The averaged radial profile was then calculated as the median intensity within concentric annuli centered on the source. To reveal even smaller details in the disk, we also used the frank software (Jennings et al. 2020) to reconstruct the radial profile directly from the visibilities. frank calculates super-resolution radial profiles of protoplanetary disks assuming azimuthal symmetry, a condition which is met in the case of MP Mus. We tried different combinations of frank’s α and wsmooth hyperparameters and found no major differences in the resulting radial profile, so we adopted α = 1.3 and wsmooth = 10−3 for the analysis. A comparison of the observed visibilities and the frank fit is shown in Fig. B.1. The inclination and PA derived from frank are in complete agreement with the values adopted earlier. Both the profile extracted directly from the image and the one from frank reveal radially decreasing emission extending up to ~60 au, with changes in the slope at ~ 10 and 30 au as well as a plateau between 30 and 40 au, and bump in the outermost region which may suggest the presence of a low-contrast gap and small, barely resolved ring. However, no clear signatures of substructures are found down to a 4 au scale. We also produced a residual map by extending the radial profile from frank azimuthally, projecting the resulting image with the corresponding disk inclination and orientation, and convolving it with the observed beam before subtracting it from the observations. The residuals (Fig. 2) are all below the 5-σ level and do not reveal any azimuthal substructures. The resulting radial profiles are shown in Fig. 3.
ALMA continuum fluxes.
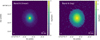 |
Fig. 1 ALMA images of MP Mus at 1.3 mm. These are displayed using both linear (left) and logarithmic (right) scales to emphasize details at different brightness levels. The 0.06″ × 0.04″ beam is shown at the bottom left corners as white ellipses. |
Disk radius encompassing 68% and 90% of the total flux.
3.1.4 (Sub)millimeter spectral indices
The spectral index (αmm) of optically thin (sub)millimeter emission from protoplanetary disks depends on the size of dust grains in them, and has been used in the past to investigate grain growth in disks in several star-forming regions (e.g., Ricci et al. 2010b,a; Ribas et al. 2017; Tazzari et al. 2021). Using the derived continuum fluxes, we computed three spectral indices in different wavelength ranges: α0.89−1.3 mm = 2.4±0.3, α1.3−2.2 mm = 2.12±0.11, and α0.89−2.2 mm = 2.25±0.13 (including the absolute calibration uncertainties of ALMA). These values were computed from the integrated fluxes and they reflect the average spectral index in the disk only, but the spectral index is expected to vary spatially as a result of factors such as radial changes in the optical depth and grains sizes. To investigate such spatial variations, we combined the resolved 1.3 mm and 2.2 mm observations to produce a resolved map of the spectral index. During this process, the most extended configuration of the available Band 6 data was excluded to avoid problems with very different coverage of the uv-plane at different bands. The 1.3 and 2.2 mm data were jointly imaged with the tclean algorithm, the mtmfs deconvolver, and nterms = 2, and we then used the resulting alpha image as the spectral index map. After various tests we adopted a robust parameter of 0.0 in this case, which yielded a beam of 0.2″ × 0.17″. The derived spectral index map and its radial profile are shown in Fig. 4. As expected, the value of α1.3−2.2 mm is not constant throughout the disk and increases as a function of radius, ranging from ~1.7 in the inner regions to ~3 in the outer parts of the disk. These results are discussed in further detail in Sect. 4.2.
3.2 Gas lines
3.2.1 Line cubes, fluxes, and morphology
The observations in this study cover multiple molecular gas emission lines, which were imaged using tclean after applying the self-calibration solutions and recentering derived in Sect. 2 and subtracting the corresponding continuum. We detected 12CO (3−2), 13CO (3−2), and CS (7−6) in Band 7, 12CO (2− 1), 13CO (2−1), and C180 (2−1) in Band 6, and DCO+ (2−1), DCN (2−1), and HC3N (16−15) in Band 4. HC15N (4−3) was also tentatively detected in the Band 7 data. We used CASA to produce the zero-th and first moments for each line, and applied Keplerian masking during the process to minimize noise from signal-free areas (e.g., Salinas et al. 2017). The moments and spectra for the12CO (2−1), 13CO (2−1), and C180 (2−1) are shown in Fig. 5, and similar figures for the remaining lines are provided in Appendix C. The line fluxes measured from the zeroth moments are listed in Table 6. We note that each project used different antenna and correlator configurations, so the spectral and spatial resolutions are different for each line (also listed in Table 6). In the case of the Band 6 observations, we only used the observations from project 2017.1.01419.S to generate the cubes (data from 2017.1.01167.S have a significantly higher angular resolution which results in a much lower sensitivity per channel, as well as a coarser spectral resolution). We also used different weighting depending on the line as a compromise between angular resolution and sensitivity: all lines in Band 4 as well as HC15N (4−3) in Band 7 were imaged with natural weighting to maximize the S/N, and the remaining lines were imaged using a robust value of 0.5.
The observations show gas emission at velocities from ~ −5 to 13 km s−1, and we measured a systematic velocity of 3.98±0.04 km s−1 (local standard of rest) using a Keplerian disk model (see Sect. 3.2.2), similar to previous estimates (e.g., Kastner et al. 2010). As shown in Figs. 5, C.1, and C.2, the emission shape of most lines is that of a full disk, that is, no clear gaps or rings are found. Exceptions are DCO+ (2−1), which shows a clear ring-like morphology with a gap radius of ~20 au (a morphology commonly observed for this line, e.g., Huang et al. 2017), and DCN (2−1) and HC15N (4−3), where the low S/N prevents any reliable estimate of their morphology. The gaseous disk extends up to 130 au (1.3″) in 12CO (2−1) based on the 3−5 σ contours, in agreement with previous studies using unresolved APEX observations of the 12CO (3−2) line (when corrected from the updated Gaia distance, Kastner et al. 2010). We also provide the radii encircling 68% and 90% of the total 12CO (2−1), 13CO (2−1), and C18O (2−1) emission in Table 5. The gas radius is ~twice that of the dust disk (60 au, Sect. 3.1) yielding a ratio of the gas and dust radii similar to those found for disks in Lupus (Ansdell et al. 2018; Sanchis et al. 2021). A comparison of the de-projected radial profiles of the continuum and 12CO (2−1) emission is shown in Fig. 3. We note that none of the ALMA projects used in this work aimed at studying the chemistry of MP Mus and yet these observations detected various molecular emission lines of multiple species, evidencing the large potential of this system for future astrochemical studies of protoplanetary disks.
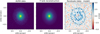 |
Fig. 2 ALMA 1.3 mm observations and model of MP Mus. The observed continuum emission (left) and the resulting image reconstructed from the frank radial profile (middle) are shown. The residuals (right) are displayed in units of the image RMS and are below the 5-σ level. |
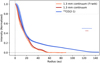 |
Fig. 3 Radial profiles of the 1.3 mm continuum and 12CO (2−1) emission of MP Mus. The continuum profile derived from the synthesized ALMA image is shown as a red line, and the orange line corresponds to the resulting profile from frank (Jennings et al. 2020). The profile for the 12CO (2−1) line is also shown as a blue line. The 1-σ uncertainties for the continuum and 12CO (2−1) are also plotted as red and blue shaded areas. In all cases, we adopted a disk inclination and PA of 32°and 10°. For comparison, the FWHM of the continuum and 12CO (2−1) beams are also shown as solid horizontal red and blue lines, respectively. |
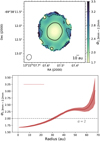 |
Fig. 4 Derived millimeter spectral index for MP Mus between 1.3 and 2.2 mm. Top: spectral index map. Only pixels with S/N > 5 are considered. The solid and dashed contours correspond to α1.3−2.2 mm of 2 and 2.5, respectively. The image beam is shown on the bottom left corner. Bottom: corresponding de-projected α1.3−2.2 mm radial profile and uncertainties (solid red line and area). The beam FWHM is shown as a horizontal red line. The dashed line marks the α = 2 transition. |
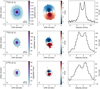 |
Fig. 5 ALMA Band 6 observations of CO isotopologues from the protoplanetary disk around MP Mus. The top, middle, and bottom rows correspond to 12CO (2−1), 13CO (2−1), and C18O (2−1), respectively. The zero-th (left column) and first (middle column) moments are shown, together with the 5σ contour of the 1.3 mm continuum as a black line. The corresponding spectra are displayed in the right column. |
3.2.2 Dynamical stellar mass and disk kinematics
Emission from gas lines experiences Doppler shifts due to the disk rotation, and can thus be used to estimate stellar masses independently of theoretical isochrones and stellar evolution models. For this purpose, we used the eddy software (Teague 2019) to model the first moment map of the 12CO (2−1) emission using a Keplerian rotation profile. This line was chosen as it offers the best compromise between S/N and the available spatial resolution. Only the extended configuration of 2017.1.01419.S was used for this purpose since the compact one is significantly noisier, but tests including this second observations yielded noisier but completely compatible results (as mentioned in Sect. 3.2.1, the observations from 2017.1.01167.S have a coarser spectral resolution and significantly less sensitivity per channel, so they were not included in this analysis). Given the high S/N of the observations, we imaged the line with a robust = 0.0 weighting (0.17″ × 0.15″ beam) to improve the angular resolution. The first moment map and its corresponding uncertainties were then calculated using the bettermoments software (Teague & Foreman-Mackey 2018). In Sect. 3.1.3, we derived a disk inclination and PA of 32°and 10°based on the dust continuum observations which have a significantly higher angular resolution, so we kept those values fixed during the fitting3. We performed various tests during this process, including the use of first moment maps computed with the CASA immoments task instead, down-sampling the map to the beam size to ensure that only spatially independent pixels are fit, masking the inner 0.3″of the disk, and modifying the disk inclination by ±1°to account for this uncertainty in the final results. In all cases, we obtain very similar stellar mass values for MP Mus, and adopt a final value of M* = 1.30±0.08 M⊙. This value is slightly higher than the 1.2 M⊙ value in the literature based on pre-main sequence (MS) evolutionary tracks (e.g., Mamajek et al. 2002), but in complete agreement when updating the luminosity with the new Gaia distance. This process also yields the aforementioned systemic velocity of 3.98±0.04 km s−1 (local standard of rest) for MP Mus. The 12CO (2−1) map used, model, and residuals are shown in Fig. 6.
The 12CO (2−1) data and moment maps show no obvious flaring, and the disk back surface is also not visible. This suggests a very flat morphology of the gaseous disk, in agreement with the results from the scattered light observations (Avenhaus et al. 2018). To further explore this, we also tested the elevated surface emission prescription from a tapered disk in eddy, which parametrizes the emission height as a function of radius following ![Mathematical equation: $z\left( r \right) = {z_0}{\left( {{r \mathord{\left/ {\vphantom {r {1}}} \right. \kern-\nulldelimiterspace} {1}}} \right)^\psi }\exp \left[ { - {{\left( {{r \mathord{\left/ {\vphantom {r {{r_{{\rm{tapper}}}}}}} \right. \kern-\nulldelimiterspace} {{r_{{\rm{tapper}}}}}}} \right)}^{{q_{{\rm{tapper}}}}}}} \right]$](/articles/aa/full_html/2023/05/aa45637-22/aa45637-22-eq11.png) (where z0 is the disk aspect ratio at 1″, ψ is the disk flaring, and rtapper and qtapper account for the disk tappering). This resulted in a stellar mass similar to that of the geometrically thin disk case, largely unconstrained values for ψ, rtapper and qtapper, and a z0 value of 0.1±0.1, showing that the disk is indeed significantly flat.
(where z0 is the disk aspect ratio at 1″, ψ is the disk flaring, and rtapper and qtapper account for the disk tappering). This resulted in a stellar mass similar to that of the geometrically thin disk case, largely unconstrained values for ψ, rtapper and qtapper, and a z0 value of 0.1±0.1, showing that the disk is indeed significantly flat.
There are two interesting features worth mentioning from the fitting of Keplerian rotation profiles. Firstly, the 12CO (2−1) first moment shows a tentative twist in the inner disk (i.e., change in the PA in the inner regions), and the residuals are structured and quite high in this area (up to ~1 km s−1). These residuals could indicate the presence of a warped, twisted, or misaligned inner disk (e.g., Marino et al. 2015; Casassus et al. 2015; Min et al. 2017; Benisty et al. 2018; Mayama et al. 2018; Bohn et al. 2022). Such structures can cast azimuthal shadows on the disk that can be detected in scattered light data, and Wolff et al. (2016) tentatively detected such a shadow in GPI observations of MP Mus. Later observations with SPHERE did not recover this feature, and Avenhaus et al. (2018) suggested that an imperfect correction of instrumental or interstellar polarization may create a similar effect. Alternatively, variability in the inner disk could also change the appearance of a shadow considering the 2 yr separation between both observations. The angle of linear polarization of the unresolved stellar signal derived from the SPHERE data (see Sect. 3.3) also suggests that the inner and outer disks are aligned. Secondly, we also find some localized residuals in the first moment at radii 50–100 au between PA 110-170° (Fig. 6). A detailed analysis of this structure is beyond the scope of this work, but its localized nature is suggestive of the velocity perturbations attributed to unseen planets in other systems (e.g., Pinte et al. 2018; Pérez et al. 2018; Teague et al. 2018). The emission in some other channels also displays tentative deviations from the expected Keplerian profile that are typically interpreted as such kinks (e.g., see the 12CO (2−1) NE emission in Fig. 7), but the sensitivity and resolution of our observations do not allow us to draw any conclusion. Further observations of the12 CO (2−1) and optically thinner tracers at higher spatial and spectral resolution are needed to better characterize the inner regions and possible deviations from Keplerian rotation in MP Mus.
Gas line detections and properties.
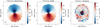 |
Fig. 6 Keplerian fit to the 12CO (2−1) line emission of MP Mus using eddy. The observed first moment (left), model (middle), and corresponding residuals (right) are shown. The 0.17″ × 0.15″ beam is shown on the bottom left corner. The area inside the black ellipse shown in the residuals was masked during the fit. The tentative localized residuals mentioned in the text are also marked with a red line. Only the extended configuration from 2017.1.01419.S was used for this analysis. |
3.2.3 Disk gas mass and gas-to-dust ratio
The bulk of mass in protoplanetary disks is in gaseous form. However, in contrast with the dust mass which can be derived (or at least approximated) from millimeter fluxes, such estimates are much more complex for the gas. A number of methods can be used for this purpose, but reliable gas mass measurement usually require detailed modeling using chemical networks, radiative transfer, a good knowledge of the disk structure, and resolved observations of multiple emission lines (together with a large number of assumptions regarding chemical abundances). Such a study is outside the scope of this work, but we can obtain some order-of-magnitude estimates by comparing the observed 13CO (2−1) and C18O (2−1) line luminosities (9.5 × 10⁴ Jy km s−1 pc2 and 2.5 × 10⁴ Jy km s−1 pc2, respectively) with model grids.
Williams & Best (2014) produced a suite of disk models with various properties and derived the resulting line fluxes for different CO lines. Their modeling did not include the selective photodissociation for the 13CO and C18O isotopologues and, instead, they included this effect by calculating half of their models with the usual CO abundances and the other half with a [C18O]/[13CO] ratio three times lower. Comparing the observed luminosities of 13CO (2−1) and C18O (2−1) in MP Mus with their grid of models (focusing on the M* = 1 M⊙ and inclination = 10°models since they are the closest to this system) results in gas masses between 3 × 10⁻⁴ M⊙ and 1 × 10⁻³ M⊙ for the cases without and with C18O depletion, respectively. Similarly, Miotello et al. (2016) investigated the dependence between disk masses and the luminosities of various CO lines for different disk properties using a grid of models including chemical modeling. Comparing the derived line luminosities with their grid of models (see Fig. 7 in Miotello et al. 2016) places the gas mass of MP Mus between 10−4 and 10−3 M⊙, depending on whether isotope-selective processes are considered or not.
Although these models are not specifically tailored to MP Mus, these general comparisons suggest that its total gas mass is Mdisk = 1 × 10⁻⁴−10−3 M⊙ (0.1–1 MJup). Taken at face value and combined with the dust mass estimate in Sect. 3.1.2, this implies a global gas-to-dust ratio of 1–10, lower than the standard value of 100 in the ISM. We note that these values are derived using the global dust and gas masses but, since the dust disk is considerably smaller than the gas one, this implies an even lower gas-to-dust ratio in the area where both gas and large dust grains are present. MP Mus then joins the increasing number of sources with a gas-to-dust ratio below 100, which recent ALMA surveys have shown to be common in protoplanetary disks: as an example, Miotello et al. (2017) found that 23 out of 34 disks surveyed in the Lupus star-forming region showed gas-to-dust ratios below 10. Traditionally, these values are interpreted as a signpost of disk evolution, where this ratio decreases over time as gas dissipates in the disk while dust grains remain. Such a scenario is reasonable for an evolved and flat disk such as MP Mus. However, another possible explanation is that the CO abundance in disks is lower than expected and results in fainter line emission, as suggested by mass measurements based on HD for TW Hya, GM Aur and DM Tau (Bergin et al. 2013; McClure et al. 2016) and in Lupus using N2H+ (Anderson et al. 2022). Unfortunately, testing this hypothesis requires reliable gas mass estimates that are independent of the CO abundance, which are extremely challenging and not yet available for MP Mus. The actual reason for the low CO-based gas masses in disks is still an open question for planet formation theories.
3.3 Scattered light results
Avenhaus et al. (2018) presented the DPI data taken in J- and H-band within the DARTSS program. These data were reduced by minimizing the nonazimuthal component of the radiation field, as an accurate polarization model for the IRDIS instrument was not available at the time. In contrast, we employed the instrument-specific polarization model used within the IRDAP pipeline, which allowed us to subtract instrumental polarization and polarization crosstalk from the image without any assumption about the data. Besides the scattered light of the disk, the image then still contains a background level of polarization and some unresolved polarization carried within the stellar halo. IRDAP measures the background polarization in regions where the signal intensity is at noise level and subtracts this background from the entire image. To estimate the stellar polarization, we measured Q and U from the stellar halo in image areas seemingly free of disk-scattered light (in an annulus mask of 1.72″–2.08″ distant to the star). Then, we can calculate the degree of polarization (DoLP) within the stellar halo and its angle of linear polarization (AoLP):
 (4)
(4)
 (5)
(5)
We found that the light carried in the stellar halo is polarized with a DoLP of 0.46+0.08% and with an AoLP of 98+8 deg east of north. Because direct stellar light is expected to be entirely unpolarized, a measurement of polarization from the isolated stellar halo indicates that there is an unresolved polarized signal within the star-centered point spread function (PSF) of the observation. This is typically attributed to parts of the observed light scattering off interstellar dust within the line-of-sight, or due to an unresolved disk component close to the star (e.g., Keppler et al. 2018; van Holstein et al. 2020). The measured AoLP of the unresolved polarization is perpendicular to the PA of the outer disk, consistent with a coplanar inner disk component. This is further consistent with the continuous disk around MP Mus, extending close to the central star as observed with ALMA for gas and dust. We subtracted the respective measured unresolved polarization from the Q- and U-components before calculating Qϕ.
Figure 7 shows the resulting Qϕ-image of MP Mus in H-band in logarithmic stretch and the comparison with the continuum and 12CO (2−1) from ALMA. We used the flux frames of the IRDIS observation to convert the observed polarized flux from counts to Jy arcsec−2, assuming an H-band magnitude of 7.64+0.02 (2MASS, Cutri et al. 2003). The final product is very similar to the presented image in Avenhaus et al. (2018). Figure 7 also compares the radial profile of Qϕ × r2 in H-band with those of the ALMA 1.3 mm and the 12CO (2−1) zeroth moment. The SPHERE image show a bright inner region (the inner ~20 au are attenuated due to the SPHERE coronagraph) and a decrease in intensity from 20 to 30 au. The emission then increases slowly up to 60 au and then rises faster in an outer ring centered at ~80 au, dropping below the noise level at 130 au, similar to the extent of the 12CO (2−1). The slight asymmetry of this outer ring suggests that the near side of the disk is to the east, the far side is west. This is consistent with promoted forward-scattering (e.g., Stolker et al. 2016), as the near side of the disk appears brighter than the far side (by a factor of ~1.5 on average).
Avenhaus et al. (2018) mentioned an azimuthally localized intensity decrease in the western half of the disk (PA ~ 270°). This feature is also present in our image. Its location at the far side of the disk, where signal-to-noise is lowest, makes it a very tentative detection. We further find that the disk’s brightest part is to the northeast of the star.
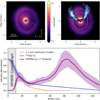 |
Fig. 7 Comparison of ALMA and SPHERE observations of MP Mus. Top left: Qϕ-image in H-band (λobs = 1.6 µm) taken with SPHERE/IRDIS. The colormap is shown in logarithmic stretch. The central blue circle masks the area covered by the coronagraph of the observation. Top right: comparison of the 1.3 mm continuum emission (orange contour), the SPHERE Qϕ H-band data (purple), and one of the 12CO (2−1) channels (blue). The 1.3 mm contour corresponds to the 5 RMS level, while only data above the corresponding 3 RMS levels are shown for the 12CO (2−1) and scattered light observations. Bottom: comparison of the radial profiles of the SPHERE Qϕ × r2 in H-band (purple line), the 1.3 mm continuum (orange line), and the 12CO (2−1) emission (blue line). The SPHERE coronagraph is also shown. |
4 Discussion
4.1 Comparison with stellar evolutionary models
The stellar mass M*,dyn = 1.30±0.08 M⊙ derived from the disk rotation (Sect. 3.2.2) is independent oftheoretical isochrones and evolutionary models, and offers an interesting comparison with such models. MP Mus is classified as a K1V star (Mamajek et al. 2002), corresponding to Teff values between 4900 and 5100 K in the spectral type (SpT)-Teff relations of Kenyon & Hartmann (1995) and Pecaut & Mamajek (2013). This temperature is also in agreement with the 5110 K value derived in the Gaia DR3 (Gaia Collaboration 2021). Its interstellar extinction AV has been measured in the range of 0.2–0.7 mag (Mamajek et al. 2002; Cortes et al. 2009). More recently, Asensio-Torres et al. (2021) derived values of 4600 K and 0.8 mag for this system from fitting the optical/near-IR SED, although this Teff value appears a bit too low for a K1 star based on the formerly mentioned SpT-Teff tables. We perform a similar process and fit the Tycho and 2MASS photometry using the BT-Settl photospheres (Allard et al. 2011, 2012) with Teff values between 4500 to 5500 in 100 K steps, AV values from 0 to 1 mag in 0.1 mag steps, and stellar luminosity values between 0.8−1.6 L⊙ in steps of 0.1 L⊙. Adopting a distance of d = 98 pc (Gaia Collaboration 2021) we derive values of Teff = 4900 K, AV = 0.6 mag, and L* = 1.3 L⊙. Such a Teff value is higher than the effective temperature in Asensio-Torres et al. (2021) and more comparable to those adopted in earlier studies. Alternatively, we also normalize 4900 and 5100 K photospheres to the observed 2MASS photometry using AV values of 0.2 and 0.7 mag, which yields stellar luminosities between 1.1 and 1.3 L⊙ (compatible with previous values when corrected for the updated distance from Gaia). We thus adopt Teff = 5000±100 K and L* = 1.2±0.1 L⊙ for MP Mus. Figure 8 shows its location in the corresponding HR diagram using the MESA Isochrones and Stellar Tracks (MIST, Dotter 2016; Choi et al. 2016). This results in a stellar mass and age of ~1.3 M⊙ and 7–10 Myr for the system. MP Mus is a confirmed member of the old ϵ Cha association based on its kinematic properties (e.g., Murphy et al. 2013; Dickson-Vandervelde et al. 2021). Murphy et al. (2013) assigned a 3–5 Myr age to that region (younger than our estimate), but the reanalysis of ϵ Cha by Dickson-Vandervelde et al. (2021) including Gaia data yielded an age of  Myr that is compatible with our results. A lower Teff such as the one proposed in Asensio-Torres et al. (2021) would result in a younger (but still compatible) age for MP Mus, although the dynamical stellar mass of ~1.3 M⊙ derived from the ALMA observations appears more difficult to reconcile with this lower Teff value.
The mass derived from the MIST tracks also appears fully compatible with the dynamical mass estimate. Given the good agreement between various recent pre-MS evolutionary models (Simon & Toraskar 2017), this result is not restricted to these tracks. Studies comparing dynamical stellar masses with predictions from evolutionary models without magnetic fields typically find the latter to underestimate masses by a significant amount, especially for low-mass stars (by 30%-80% for stellar masses <1.4 M⊙, e.g., Simon et al. 2019; Pegues et al. 2021). In contrast, evolutionary tracks including stellar magnetic fields (e.g., Feiden 2016) yield more compatible results with dynamical mass estimates. This discrepancy is usually attributed to starspots (e.g., Pegues et al. 2021; Flores et al. 2022), which become more relevant for late-type stars. Given the relatively high mass of MP Mus compared to the samples in the aforementioned works, the agreement between the dynamical mass estimate and the evolutionary tracks without magnetic fields used in our study is likely an indication that the effect of starspots in this system is moderate or negligible. We also notice that these works focused on younger sources (mostly in Taurus and Ophiuchus, with estimated ages of 1–2 Myr). Similar comparisons for larger samples of stars covering a range of masses and ages could help to further inform theoretical models of early stellar evolution.
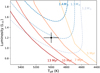 |
Fig. 8 Location of MP Mus (black dot) in the HR diagram. MIST mass tracks (1.2, 1.3, and 1.4 M⊙) and isochrones (5, 7, 10, and 13 Myr) are also shown (Dotter 2016; Choi et al. 2016). |
4.2 Grain growth and optically thick emission in MP Mus
Assuming optically thin emission and a sufficiently warm dust temperature for the emission to be in the Rayleigh-Jeans regime, αmm relates to the power law index of the dust opacity, κv ∝ vβ via αmm = 2 + β. β is sensitive to the maximum grain size (amax) of the dust size distribution (e.g., Natta & Testi 2004; Draine 2006; Testi et al. 2014): dust distributions with maximum grain sizes around or larger than 1 mm have opacity power-law indices β ≲ 1, while smaller grains have higher β values (ISM-like grains show β ~ 1 .7). The spectral indices measured in Sect. 3.1.4 then translate to average β values of ~0.1–0.4 and suggest the presence of mm-sized grains in MP Mus. Our results are very similar to those of Cortes et al. (2009), who found the millimeter spectral index of MP Mus between 3 mm and 12 cm to be α = 2.4±0.1, and first indicated the presence of large grains in the disk. Similar αmm values are found in disks in younger star-forming regions such as Taurus, Ophiuchus, Lupus, and Chamaeleon I (Ricci et al. 2010b,a; Ribas et al. 2017; Tazzari et al. 2021), but also in other evolved disks such as TW Hya, HD 98800B or TWA 3 (Macías et al. 2021; Ribas et al. 2018; Czekala et al. 2021). This implies that, despite grain drift and evolution, protoplanetary disks can retain a population of large grains during most of their lifetimes.
The spectral index map in Sect. 4 provides additional spatial information about the disk, and two of its features are worth discussing. First, α1.3−22 mm increases with radius, similar to many other sources observed at multiple (sub)millimeter wavelengths with enough angular resolution (e.g., Pérez et al. 2015; Carrasco-González et al. 2016; Tazzari et al. 2016; Dent et al. 2019; Macías et al. 2019, 2021). This is attributed to a combination of higher optical depths in the inner regions and to the inward drift of large grains due to gas drag (Weidenschilling 1977). Thus, this can be interpreted as additional evidence of grain growth and radial drift in the disk. It is also worth noticing that the disk radii at 1.3 mm and 2.2 mm are similar within the uncertainties. Although this interpretation is limited by the moderate angular resolution of the 2.2 mm observations (~20 au), if both radii are indeed similar this could suggest the presence of some mechanism preventing strong dust radial drift in the disk, since it would otherwise appear more compact at 2.2 mm than at 1.3 mm.
Maybe more interesting is the fact that MP Mus displays values α1.3−22 mm < 2 in its inner region (r < 30 au). Such values are below the spectral index of black body radiation, and they have been traditionally interpreted as indicators of additional emission mechanisms such as free-free radiation from ionized photoevaporative winds or stellar chromospheric activity (e.g., MacGregor et al. 2015; Macías et al. 2016). However, these processes usually become significant at wavelengths longer than those considered here. Cortes et al. (2009) also observed MP Mus at cm wavelengths and obtained only upper limits at 3 cm and 6 cm, suggesting a negligible contribution from a possible stellar wind. Alternatively, αmm < 2 values can also arise from optically thick emission from dust grains with high albedo (Miyake & Nakagawa 1993; Liu 2019; Zhu et al. 2019). Recently, ALMA has shown that spectral indices below 2 in the inner regions of disks are not unusual (e.g., Huang et al. 2018; Dent et al. 2019), and an integrated αmm value below 2 was also found in the circumbinary disk of the TWA 3 triple system (Czekala et al. 2021). The spectral index map of MP Mus is one more example of these cases, adding observational support to the idea that at least part of the emission from protoplanetary disks is optically thick even at ~2 mm, and that dust scattering needs to be considered at these wavelengths. In turn, this is yet another indication that dust masses derived from millimeter surveys may be underestimated, and explains why SED modeling of disks accounting for the disk structure and dust scattering results in systematically higher dust masses (Ballering & Eisner 2019; Ribas et al. 2020; Rilinger et al. 2023). The fact that these low αmm values are also found on evolved disks such as TW Hya or MP Mus shows that this effect could be significant throughout most of the disk lifetime.
4.3 Lack of millimeter substructures and comparison with TW Hya
The high angular resolution view of MP Mus presents a stark contrast with respect to most protoplanetary disks imaged at similar spatial resolutions to date: while the majority of disks display some substructures in high angular resolution millimeter observations (i.e., gaps, rings, spiral arms, asymmetries), MP Mus shows a smooth disk down to a 4au resolution, with the possible exception of a barely resolved outer ring at ~50 au. There are also no signs of an inner cavity, in agreement with the AoLP derived from the SPHERE observations (Sect. 3.3) as well as with previous modeling of its SED which suggested that the disk extends down to the dust sublimation radius (Cortes et al. 2009). The featureless appearance is even more puzzling when we consider its age (7–10 Myr), which is quite older than typical disk lifetimes. Without substructures acting as dust traps (e.g., Pinilla et al. 2012; Zhu et al. 2014), the gas drag would quickly deplete the disk of large grains on timescales much shorter than disk lifetimes (Weidenschilling 1977), so one of the following scenarios must be true for MP Mus: either its dust population comprises small (< 100 µm) dust grains only that are weakly affected by radial drift, or there are undetected or unresolved substructures in the disk that are stopping the inward migration of large grains.
In the first scenario, a population of smaller grains would have both a lower opacity at millimeter wavelengths and a steeper opacity power law index (e.g., Natta & Testi 2004; Testi et al. 2014; Tazzari et al. 2016). A significantly higher dust mass would be needed to both account for the observed fluxes and to maintain a spectral index of 2–2.5 in most of the disk, which in this case would be mostly due to optically thick emission. Although this explanation cannot be ruled out with the current data, it seems unlikely that the actual dust mass would be much higher than the measured value, as it would imply that MP Mus was originally very massive (possibly above the disk instability limit). Moreover, the disk size at millimeter wavelengths and those of the gas and scattered light observations would be difficult to reconcile with a population of small grains only. Additional high-resolution observations at other millimeter wavelengths covering a broader wavelength range are needed to perform a detailed modeling of the dust population in the disk (e.g., Macías et al. 2021) and to further investigate this possibility.
The second explanation for the survival of large grains in an evolved disk with apparently no substructures is that this conclusion is limited by the optical depth and/or angular resolution of the observations, that is, there are structures in the disk but they remain undetected or unresolved with the current observations. Structures narrower than 5 au have been found in some nearby disks such as TW Hya, HD 169142 and V4046 Sgr (Andrews et al. 2016; Pérez et al. 2019; Martinez-Brunner et al. 2022), although the last two also displayed much broader gaps in the dust distribution (and V4046 Sgr is a circumbinary disk). TW Hya probably provides the best comparison given its similarities with MP Mus: high angular resolution observations revealed a system of concentric rings and gaps with 1–5 au widths and varying amplitudes (Andrews et al. 2016). These authors argued that such structures may be common in disks, playing a fundamental role in their evolution and in the planet formation process. Figure 9 compares the radial profiles of MP Mus and TW Hya at 1.3 mm from Macías et al. (2021) after degrading the angular resolution of the latter to match the ~5 au of the MP Mus data. This comparison demonstrates that both profiles are significantly different, and it is still possible to identify several features in TW Hya at this resolution such as a flat profile in the inner region (caused by the central cavity) and two gaps at 25 and 40 au. On the other hand, a number of the known substructures in TW Hya are no longer visible in the profile, as could be the case for MP Mus. We note that gas rings with radial widths much smaller than their vertical extent are unstable (Ono et al. 2016; Dullemond et al. 2018), which limits how packed substructures can be. Given the flat appearance of MP Mus, realistic values for h/r are likely in the range of 0.03–0.07, which could allow for the presence of rings in the outer regions that are narrow or close enough to remain unresolved. This consideration is also relevant for the comparison with TW Hya: the stellar mass of MP Mus is ~twice that of TW Hya (1.3 M⊙ for MP Mus, and ~0.6 M⊙ in the case of TW Hya, Sokal et al. 2018), so its scale height is expected to be smaller (by a factor of ~  when ignoring the higher stellar luminosity of MP Mus). As a result, MP Mus may host narrower rings than TW Hya. In addition, Xu & Bai (2O22a,b) showed that within one broad gas pressure bump, two radial dust rings separated by a distance comparable or less than h may form, assisted by the dust back reaction to gas. This further promotes the possibility of having packed dust rings currently unresolved. Finally, high optical depths also limit our ability to identify gaps and rings in the system. As suggested by the map of spectral index, the inner 30 au of the disk appear to be optically thick, displaying α < 2 (Fig. 4). It is thus possible that the observed 1.3 mm continuum emission in these regions is coming from an elevated surface, preventing the detection of substructures in the midplane.
Overall, despite the high angular resolution and structureless appearance of MP Mus, the current data cannot discard small (<4 au) rings especially in the inner regions, or even larger ones if the disk is sufficiently optically thick. If undetected substructures are the explanation for the long-lived disk around MP Mus, then this system lends further support to the idea that small rings may be a common feature in disks. As proposed by Tripathi et al. (2017, 2018); Andrews et al. (2018b), if some of these rings are (partially) optically thick, they could help to explain the observed relation between the radii and millimeter luminosity of disks. Evolutionary disk models by Toci et al. (2021) also showed that the gas-to-dust radii ratios (RCO/Rdust) become >5 in very short timescales (<1 Myr) in the absence of mechanisms preventing radial drift, in clear conflict with the RCO/Rdust ~ 2 value found in MP Mus at 7–10 Myr. Given its proximity, ALMA observations of MP Mus at even better angular resolutions and longer wavelengths would aid in explaining the long lifetime of the system and exploring the frequency and properties of small structures in disks.
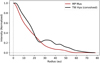 |
Fig. 9 Comparison of the radial profiles of MP Mus (red) and TW Hya (black) at 1.3 mm. The TW Hya data were taken from Macías et al. (2021), and convolved with a 0.08″Gaussian to match the resolution and distance of the MP Mus observations. The inner cavity and two of the known gaps gaps of TW Hya (at 25 and 45 au) are still visible in the case of TW Hya, in contrast with the smooth profile of MP Mus. |
4.4 Upper limits to the presence of planets
Planets with enough mass are expected to open gaps in the gas and dust distribution (e.g., Crida et al. 2006; Zhu et al. 2011; Dong & Fung 2017; Dong et al. 2018), although the properties of these gaps are highly dependent on the conditions in the disk. Deriving planetary masses from gap widths and contrasts requires detailed hydrodynamic models including many (uncertain) free parameters and is a quite degenerate process, but comparisons with results from different models provide some constraints on the maximum mass of planets in the MP Mus system based on the absence of visible substructures larger than >4 au in dust distribution. Here, we use the scaling relation between the planet Hill sphere (RH) and width of the gap (Δ, defined as the separation between the minimum brightness in a gap and the maximum brightness of the corresponding external ring) following Lodato et al. (2019). For disks with viscosity values α ≲ 0.01, these two quantities are related following:
 (6)
(6)
where Mp is the mass of the planet, M* is the mass of the star, r is the orbital radius of the planet, and k is a proportionality constant that depends on disk properties and ranges between ~4–8 for gaps observed in the millimeter (see Lodato et al. 2019, and references therein, where they adopt a value of k = 5.5). Assuming that we would have resolved widths Δ ≥ 4 au and the derived 1.30 M⊙ mass for MP Mus, Fig. 10 shows the corresponding upper limits for Mp at different radii for k = 4, 5.5, and 8. Based on this simple relation and further assuming that each gap is carved by a single planet, the lack of resolved gaps in these observations would imply that there are no planets more massive than 0.5–4 MJup at orbital radii r > 10 au (depending on the adopted value of k), and these constraints decrease to 0.05–0.5 MJup and 2 M⊕ − 0.06 MJup for r > 20 au and r > 40 au, respectively. We emphasize that this analysis assumes that any sufficiently large gap carved by planets would be visible in the 1.3 mm observations, but the high optical depth within the inner 30 au suggested by their α < 2 spectral index could hide such gaps (see Sect. 4.3). Therefore, the derived limits are likely underestimated, especially in the inner regions of the disk. Also, these limits only apply for r ≤ 60 au since that is the radial extent of the millimeter dust continuum emission.
The 1.3 mm radial profile obtained with frank shows a shallow plateau between 30 and 40 au, which could be interpreted as a low-contrast gap. Although it is not clear that this structure is an actual gap in the dust density distribution of the disk, here we also use Eq. (6) to calculate the mass of a hypothetical planet that could carve such a gap at that location. Assuming that the planet is at the center of the plateau (~35 au) and given the location of the outer bump (~45 au), the gap width would be ∆ = 10 au, and the corresponding planet mass is 0.2 MJup, 0.6 MJup, and 1.5 MJup for a value of k of 8, 5.5, and 4, respectively.
On the other hand, the drop in scattered light signal between 30 and 80 au visible in the scattered light radial profile (see Sect. 4.5) may indicate the presence of one or more massive planets outside the continuum emission, and studies based on scattered light data have placed different upper limits to their masses. Wolff et al. (2016) observed MP Mus with GPI and could reject the presence of a 3 MJup planet outside of 40 au with a 90% confidence for a 7 Myr disk. Similarly, SPHERE observations of MP Mus allowed Asensio-Torres et al. (2021) to place upper limits on the masses of possible companions4, now reaching a 5-σ limit of ~2.5–3 MJup at r ≥ 50 au. Asensio-Torres et al. (2021) also proposed that a planet located at 55 au may be the origin of this decrease in scattered light intensity. However, the lack of a wide gap at this location in the ALMA continuum observations suggests that the lower intensity of scattered light between 30– 80 au is not due to an actual gap in the disk surface density (see Sect. 4.5). Recently, the GAPlanetS survey (Follette et al. 2022) targeted several sources in Hα searching for accreting protoplanets in fourteen disks, but did not identify any potential candidate in the disk around MP Mus. If the lack of any clear rings and gaps in the 1.3 mm continuum is real and not due to the high optical depth of the disk in the inner regions, then this work and previous studies analyzing scattered light observations appear to rule out the presence of planets more massive than 3 MJup at radii r > 10– 15 au. If that is the case, the exoplanet population of a hypothetical planetary system around MP Mus may not be very different from that of the Solar System, making it an ideal laboratory for further planet formation studies given its proximity and age.
Finally, the millimeter observations in this work also place some constraints on the presence of circumplanetary disks outside of the dust disk (r > 60 au). The RMS of the 1.3 mm continuum image is 19 µJy beam−1, and thus we can reject the presence of point-like sources with fluxes ≥90 µJy in the dust-free region at a 5 σ confidence. There are two ~4 σ peaks at angular separations 1.4″ NE and 1.6″ SE from the source center (~140 and 160 au projected orbital radii) which lie outside the scattered light outer ring, but these are likely associated with noise. Converting these limits to disk masses involves many unknown quantities (see Isella et al. 2014, 2019), but we can compare the sensitivity limit of these data to the flux of the circumplanetary disk recently detected around PDS 70c (Isella et al. 2019; Benisty et al. 2021): considering its 86 µJy flux at 855 µm, an spectral index of 2.3, and the closer distance of MP Mus, a similar circumplanetary disk would have a flux of 42 µJy at 1.3 mm and would therefore remain undetected with our observations.
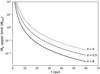 |
Fig. 10 Upper limits to the presence of planets in the disk around MP Mus as a function of radius. These upper limits are derived using Eq. (6) (Lodato et al. 2019) and the fact that no gaps with width Δ ≥ 5 au are detected in the disk. Three different values are used for the proportionality constant (k) linking the planet Hill radius and the corresponding gap width. |
4.5 The panchromatic view of MP Mus
The ALMA observations of MP Mus reveal a smooth disk in the millimeter continuum with a radius of 60 au, and a gaseous disk that extends further out to 130 au. In contrast, the scattered light images probing small dust grains show a different morphology, with a bright inner region and a significant drop in flux between 30–80 au (Cortes et al. 2009; Schneider et al. 2014; Wolff et al. 2016; Avenhaus et al. 2018). In particular, SPHERE observations of MP Mus show that: (1) the strongest signal in scattered light arises from the inner 25 au, (2) there is a discontinuity in the brightness at 60 au, (3) there is an outer ring at 80 au, and (4) the disk extends up to 125 au. Many of these coincide with features seen in the ALMA images (see Fig. 7 for a comparison of the millimeter continuum, 12CO, and scattered light observations and radial profiles). Regarding the inner regions, the 1.3 mm continuum emission also arises mostly from the inner 25–30 au, the slopes of the radial profiles of both continuum and 12CO emission changes at this radius (Fig. 3), and the emission has a spectral index αmm < 2 within this radius (Fig. 4). The discontinuity observed at 60 au in scattered light coincides with the outer radius of the millimeter continuum emission, and the extent of the gaseous component of the disk is in great agreement with the one inferred from the scattered light data. Overall, this matches predictions from the radial drift of dust grains: while small grains remain well coupled to the gas and are thus colocated, larger grains migrate toward pressure maxima and accumulate in the inner regions of the disk or localized pressure bumps (e.g., Weidenschilling 1977; Pinilla et al. 2012).
The gap seen in scattered light between 30 and 80 au is quite prominent (it is the largest of all the sources in Avenhaus et al. 2018), and two scenarios have been proposed to explain it, namely that it is a real decrease in the disk density carved by one or multiple planets, and that it is shadow cast by the disk itself (Wolff et al. 2016). We can now revisit these explanations in the light of the new ALMA observations.
Planets are one of the leading explanations for the plethora of rings and gaps found in protoplanetary disks, and the properties of many of these structures appear to support this explanation (e.g., Huang et al. 2018; Zhang et al. 2018; Pérez et al. 2019). In these cases, the gravitational influence from the planet decreases the local gas density and induces a pressure bump outside of its orbit, which acts as a dust trap for large (millimeter to centimeter-sized) grains. For MP Mus, however, the lack of any millimeter emission in the outer ring visible in scattered light implies that the ring is mostly devoid of large dust grains, suggesting that the gap in scattered light is not a gap in the surface density opened by one or several planets. Although the available observations do not reject planet masses below sub-Jovian values, the lack of companions discussed in Sect. 4.3 also supports the interpretation that the drop in scattered light at 30–80 au is due to a different process.
A shadow cast by the disk inner rim (e.g., Dullemond & Dominik 2004) is also a plausible explanation for the apparent gap in the scattered light observations, especially considering that MP Mus shows a rather flat structure. The possibility of a shadowed disk in the system was proposed by Cortes et al. (2009) based on its low near/mid-IR excess (4–20 µm) with respect to the median disk SED of Taurus, even before high-angular resolution observations in scattered light were available. Dong (2015) found that a puffed-up inner rim with a sharp edge in the vertical direction could produce a pattern similar to that seen in MP Mus (i.e., a drop in scattered light emission at intermediate radii), although rims with more physically motivated structures did not produce such results. It is interesting to note that a steep increase in the SPHERE radial profile occurs at 60 au, matching the outer radius of the millimeter emission. Based on this and the overall SPHERE radial profile, we propose that MP Mus probably has a puffed-up inner disk that shadows radii beyond 30 au. However, the lack of large grains in the disk midplane at radii r > 60 au could result in a less efficient cooling of the disk (and hence a warmer midplane), increasing the disk scale height and allowing the disk surface to grow out of the shadow at longer radii. Direct observational evidence for such an effect (i.e., higher temperatures in the outer regions devoid of large grains) exist for the edge-on disk Oph 163131 based on tomographic reconstruction of its temperature structure (Flores et al. 2022; Villenave et al. 2022).
We explore this idea by calculating a simple disk model for MP Mus using the MCFOST code (Pinte et al. 2006, 2009). We adopt the stellar and disk parameters derived in this study and include two different dust populations: one for small grains (0.01–10 µm) extending from 0.1 to 130 au, and a more compact disk of larger grains (10 µm–1 mm) from 0.1 to 60 au. At 60 au, the inter-phase between the large and small grain disks results in an increase of the midplane temperature from 10 to 15 K. For a vertically isothermal disk with a scale height H = cs/Ω, this change in temperature would imply a local increase of ~20% in the scale height, which could expose the upper disk layers to stellar radiation again. We emphasize that none of these numbers are to be considered as accurate estimates for MP Mus given the oversimplified model used, but they show that the change in the disk opacity at the end of the millimeter continuum radius could lead to a local increase of the disk temperature at that location. We do not find signs of a colder disk at r = 60–80 au in the 12CO (2−1) radial profile, which does not show any significant feature at these radii down to 3 K (the brightness temperature uncertainty at 70 au). However, the 12CO (2−1) emission arises from above the midplane and may not reflect the midplane temperature. Unfortunately, the same analysis cannot be performed for optically thinner isotopologues such as 13CO (2−1) or C18O (2−1), since their emission only extends to ≲60 au. Detailed physico-chemical modeling of the gas and dust components of MP Mus is needed to calculate a consistent temperature structure for the disk and to determine the origin of the gap seen in the scattered light observations.
5 Summary
We present new ALMA observations of the nearby, evolved protoplanetary disk around MP Mus, including 0.89 mm, 1.3 mm, and 2.2mm continuum emission, as well as multiple gas emission lines. These data are the first spatially resolved observations of the disk at these wavelengths and provide a wealth of new information of this system. Our key results and findings are:
The continuum emission shows a disk with no detected inner cavity and a radius of 60± 5 au. Despite the high angular resolution of these data, the dust disk appears smooth down to 4 au scales, making MP Mus an interesting exception when compared with the plethora of substructures found in most disks observed at comparable resolutions, and an great counterpart to TW Hya in particular;
Based on the millimeter fluxes and using standard assumptions for the dust opacity and disk temperature, we derived a dust disk mass of
 MJup;
MJup;The continuum spectral index between 1.3 and 2.2 mm has a value <2 for radii r < 30 au, indicative of optically thick emission from dust grains with a high albedo in this region;
These observations yield detections of 12CO (3−2), CS (7− 6), HC15N (4−3), and 13CO (3−2) in Band 7, 12CO (2−1), 13CO (2−1), and C18O (2−1) in Band 6, as well as HC3N (16−15), DCN (2−1), and DCO+ (2−1) in Band 7;
The 12CO (2−1) observations reveal a gaseous disk extending up to 130±15au, a factor of ~2 larger than the dust disk. Similar to the dust, no clear gaps are found;
By fitting a Keplerian profile to the first moment of the 12CO (2−1), we derived a dynamical mass for MP Mus of 1.30±0.08M⊙. This value is consistent with predictions from theoretical stellar evolutionary models, which date the system at an age of 7–10 Myr;
By comparing the 13CO (2−1) and C18O (2−1) fluxes with grids of disk models, we estimate the gas mass in the system to be 10−4−10−3 M⊙, resulting in a global gas-to-dust ratio of 1–10;
A comparison of these data with previous scattered light observations shows that small grains and the gas are colocated while larger grains concentrate in the inner regions, which is in line with expectations from dust radial drift;
From the scattered light observations, we derive an angle of linear polarization that suggests the presence of disk material inside the stellar PSF that is coplanar with the outer disk. This is in agreement with the expectations from a disk extending inward to regions close to the star (within 0.05″);
The survival of large grains in a gas-rich disk is surprising for such an evolved system, especially considering the lack of substructures in the continuum emission. This suggests that structures preventing the radial drift of large grains may be present in the disk but are not visible due to a high optical depth of the emission at 1.3 mm, or they may be smaller than the resolution limit of these observations (4 au);
Based on scaling relations between the planet mass and the gap widths and assuming that substructures are not hidden by high optical depths, we used the lack of any clearly resolved gap to place upper limits on the mass of possible planets in the disk. We find that no planets more massive than ~0.5– 4 MJup, 0.05–0.5 MJup, and 2 M⊕−0.06 MJup exist at radii r > 10, 20, and 40 au, respectively. Using a similar approach, if the tentative plateau seen at 30–40 au is caused by a planet, it would have a mass ~0.2–1.5 MJup;
The scattered light observations also revealed a drop in intensity between 30 and 80 au, and an outer ring from 80 to 130 au. The lack of millimeter emission from this outer ring suggests this drop in scattered light emission is probably not an actual gap in the disk surface density due to planets, since such a gap would trap large grains in the ring. Instead, the data appear more consistent with this feature being a shadow, cast between 30 and 80 au by a puffed-up inner rim. The rapid increase of scattered light signal at radii >60 au may be explained by the lack of large dust grains at these locations, which could result in a warmer disk. This would increase the disk scale height and expose the disk surface to stellar radiation at longer radii, explaining the outer ring visible in scattered light.
Given its nearby location, age, and properties, MP Mus is an optimal target to study many aspects of protoplanetary disks, a great laboratory to probe the chemistry of planet formation, an interesting counterpart to the TW Hya system, and, possibly, the closest analog to the young Solar System. Because of all these factors, MP Mus may be one of the most promising individual sources to advance our understanding of planet formation.
Acknowledgements
We thank the anonymous referee for their constructive comments, which helped to improve the quality of the manuscript. We also thank Richard Teague and Jeff Jennings for useful comments on using eddy and frank. This paper makes use of the following ALMA data: ADS/JAO.ALMA#2017.1.01687.S, ADS/JAO.ALMA#2017.1.01167.S, and ADS/JAO.ALMA#2017.1.01419.S. ALMA is a partnership of ESO (representing its member states), NSF (USA) and NINS (Japan), together with NRC (Canada), MOST and ASIAA (Taiwan), and KASI (Republic of Korea), in cooperation with the Republic of Chile. The Joint ALMA Observatory is operated by ESO, AUI/NRAO and NAOJ. A.R. has been supported by the UK Science and Technology research Council (STFC) via the consolidated grant ST/S000623/1 and by the European Union's Horizon 2020 research and innovation programme under the Marie Sklodowska-Curie grant agreement No. 823823 (RISE DUSTBUSTERS project). P.W. acknowledges support from FONDECYT grant 3220399. S.P. acknowledges support from FONDECYT grant 1191934. This work was funded by ANID – Millennium Science Initiative Program – Center Code NCN2021_080. This project has received funding from the European Research Council (ERC) under the European Union Horizon 2020 research and innovation program (grant agreement No. 101042275, project Stellar-MADE). A.A. acknowledges support through a Fellowship for National PhD students from ANID, grant number 21212094 and funding by ANID, Millennium Science Initiative, via the Núcleo Milenio de Formación Planetaria (NPF). P.R.M. thanks the Spanish MINECO for funding support from PID2019-106235GB-I00. C.C. acknowledges support by ANID BASAL project FB210003 and ANID, – Millennium Science Initiative Program – NCN19_171. M.V. research was supported by an appointment to the NASA Postdoctoral Program at the NASA Jet Propulsion Laboratory, administered by Oak Ridge Associated Universities under contract with NASA.
Appendix A Continuum images at 0.89 mm and 2.2 mm
The ALMA synthesized images at 0.89 mm and 2.2 mm are shown in Fig. A.1.
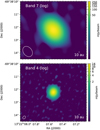 |
Fig. A.1 ALMA continuum images of MP Mus at 0.89 mm (top, unresolved) and 2.2 mm (bottom, resolved) shown in logarithmic scales. The images were synthesized with a robust value of -0.5. The corresponding beams (0.89″ ×0.66″and 0.25″ ×0.19″ at 0.89mm and 2.2 mm, respectively) are shown at the bottom left corners as white ellipses. |
Appendix B frank visibility fit
Figure B.1 shows a comparison of the observed continuum visibilities at 1.3 mm and the corresponding fit derived with frank.
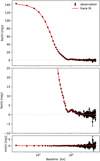 |
Fig. B.1 Comparison of the observed ALMA 1.3 mm continuum visibilities of MP Mus (black dots) and the results from the frank fit (red line). The visibilities are shown in 30-kλ bins. |
Appendix C Molecular gas emission line images
Figures C.1, and C.2, show the zero-th and first moments of the molecular emission lines detected by ALMA in Bands 7 and 4, as well as their spectra.
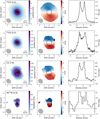 |
Fig. C.1 Moments and spectra of the molecular lines detected by ALMA in the MP Mus protoplanetary disk in Band 7. Figures and symbols are the same as in Fig. 5. |
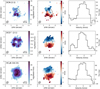 |
Fig. C.2 Moments and spectra of the molecular lines detected by ALMA in the MP Mus protoplanetary disk in Band 4. Symbols are the same as in Figs. 5 and C.1. |
References
- Allard, F., Homeier, D., & Freytag, B. 2011, ASP Conf. Ser., 448, 91 [Google Scholar]
- Allard, F., Homeier, D., & Freytag, B. 2012, Roy. Soc. Lond. Philos. Trans. Ser. A, 370, 2765 [Google Scholar]
- Anderson, D. E., Cleeves, L. I., Blake, G. A., et al. 2022, ApJ, 927, 229 [NASA ADS] [CrossRef] [Google Scholar]
- Andrews, S. M., & Williams, J. P. 2005, ApJ, 631, 1134 [Google Scholar]
- Andrews, S. M., Wilner, D. J., Zhu, Z., et al. 2016, ApJ, 820, L40 [Google Scholar]
- Andrews, S. M., Huang, J., Pérez, L. M., et al. 2018a, ApJ, 869, L41 [NASA ADS] [CrossRef] [Google Scholar]
- Andrews, S. M., Terrell, M., Tripathi, A., et al. 2018b, ApJ, 865, 157 [Google Scholar]
- Ansdell, M., Williams, J. P., Trapman, L., et al. 2018, ApJ, 859, 21 [NASA ADS] [CrossRef] [Google Scholar]
- Asensio-Torres, R., Henning, T., Cantalloube, F., et al. 2021, A&A, 652, A101 [NASA ADS] [CrossRef] [EDP Sciences] [Google Scholar]
- Avenhaus, H., Quanz, S. P., Garufi, A., et al. 2018, ApJ, 863, 44 [NASA ADS] [CrossRef] [Google Scholar]
- Ballering, N. P., & Eisner, J. A. 2019, AJ, 157, 144 [Google Scholar]
- Beckwith, S. V. W., Sargent, A. I., Chini, R. S., & Guesten, R. 1990, AJ, 99, 924 [Google Scholar]
- Benisty, M., Juhász, A., Facchini, S., et al. 2018, A&A, 619, A171 [NASA ADS] [CrossRef] [EDP Sciences] [Google Scholar]
- Benisty, M., Bae, J., Facchini, S., et al. 2021, ApJ, 916, L2 [NASA ADS] [CrossRef] [Google Scholar]
- Bergin, E. A., Cleeves, L. I., Gorti, U., et al. 2013, Nature, 493, 644 [Google Scholar]
- Bohn, A. J., Benisty, M., Perraut, K., et al. 2022, A&A, 658, A183 [NASA ADS] [CrossRef] [EDP Sciences] [Google Scholar]
- Bouwman, J., Henning, T., Hillenbrand, L. A., et al. 2008, ApJ, 683, 479 [NASA ADS] [CrossRef] [Google Scholar]
- Canovas, H., Ménard, F., de Boer, J., et al. 2015, A&A, 582, A7 [Google Scholar]
- Carrasco-González, C., Henning, T., Chandler, C. J., et al. 2016, ApJ, 821, L16 [Google Scholar]
- Casassus, S., Marino, S., Pérez, S., et al. 2015, ApJ, 811, 92 [Google Scholar]
- Choi, J., Dotter, A., Conroy, C., et al. 2016, ApJ, 823, 102 [Google Scholar]
- Cortes, S. R., Meyer, M. R., Carpenter, J. M., et al. 2009, ApJ, 697, 1305 [NASA ADS] [CrossRef] [Google Scholar]
- Crida, A., Morbidelli, A., & Masset, F. 2006, Icarus, 181, 587 [Google Scholar]
- Cutri, R. M., Skrutskie, M. F., van Dyk, S., et al. 2003, VizieR Online Data Catalog: II/246 [Google Scholar]
- Czekala, I., Ribas, Á., Cuello, N., et al. 2021, ApJ, 912, 6 [NASA ADS] [CrossRef] [Google Scholar]
- Debes, J. H., Poteet, C. A., Jang-Condell, H., et al. 2017, ApJ, 835, 205 [NASA ADS] [CrossRef] [Google Scholar]
- de Boer, J., Langlois, M., van Holstein, R. G., et al. 2020, A&A, 633, A63 [NASA ADS] [CrossRef] [EDP Sciences] [Google Scholar]
- Dent, W. R. F., Pinte, C., Cortes, P. C., et al. 2019, MNRAS, 482, L29 [Google Scholar]
- Dickson-Vandervelde, D. A., Wilson, E. C., & Kastner, J. H. 2021, AJ, 161, 87 [NASA ADS] [CrossRef] [Google Scholar]
- Dong, R. 2015, ApJ, 810, 6 [NASA ADS] [CrossRef] [Google Scholar]
- Dong, R., & Fung, J. 2017, ApJ, 835, 146 [NASA ADS] [CrossRef] [Google Scholar]
- Dong, R., Li, S., Chiang, E., & Li, H. 2018, ApJ, 866, 110 [NASA ADS] [CrossRef] [Google Scholar]
- Dotter, A. 2016, ApJS, 222, 8 [Google Scholar]
- Draine, B. T. 2006, ApJ, 636, 1114 [Google Scholar]
- Dullemond, C. P., & Dominik, C. 2004, A&A, 417, 159 [NASA ADS] [CrossRef] [EDP Sciences] [Google Scholar]
- Dullemond, C. P., Birnstiel, T., Huang, J., et al. 2018, ApJ, 869, L46 [NASA ADS] [CrossRef] [Google Scholar]
- Feiden, G. A. 2016, A&A, 593, A99 [NASA ADS] [CrossRef] [EDP Sciences] [Google Scholar]
- Flores, C., Connelley, M. S., Reipurth, B., & Duchêne, G. 2022, ApJ, 925, 21 [NASA ADS] [CrossRef] [Google Scholar]
- Follette, K. B., Close, L. M., Males, J. R., et al. 2022, ApJ, submitted [arXiv:2211.02109] [Google Scholar]
- Gaia Collaboration (Brown, A. G. A., et al.) 2021, A&A, 649, A1 [NASA ADS] [CrossRef] [EDP Sciences] [Google Scholar]
- Gregorio-Hetem, J., Lepine, J. R. D., Quast, G. R., Torres, C. A. O., & de La Reza, R. 1992, AJ, 103, 549 [NASA ADS] [CrossRef] [Google Scholar]
- Huang, J., Öberg, K. I., Qi, C., et al. 2017, ApJ, 835, 231 [Google Scholar]
- Huang, J., Andrews, S. M., Cleeves, L. I., et al. 2018, ApJ, 852, 122 [Google Scholar]
- Ingleby, L., Calvet, N., Herczeg, G., et al. 2013, ApJ, 767, 112 [Google Scholar]
- Isella, A., Chandler, C. J., Carpenter, J. M., Pérez, L. M., & Ricci, L. 2014, ApJ, 788, 129 [NASA ADS] [CrossRef] [Google Scholar]
- Isella, A., Benisty, M., Teague, R., et al. 2019, ApJ, 879, L25 [Google Scholar]
- Jennings, J., Booth, R. A., Tazzari, M., Rosotti, G. P., & Clarke, C. J. 2020, MNRAS, 495, 3209 [Google Scholar]
- Kastner, J. H., Hily-Blant, P., Sacco, G. G., Forveille, T., & Zuckerman, B. 2010, ApJ, 723, L248 [NASA ADS] [CrossRef] [Google Scholar]
- Kenyon, S. J., & Hartmann, L. 1995, ApJS, 101, 117 [Google Scholar]
- Keppler, M., Benisty, M., Müller, A., et al. 2018, A&A, 617, A44 [NASA ADS] [CrossRef] [EDP Sciences] [Google Scholar]
- Liu, H. B. 2019, ApJ, 877, L22 [NASA ADS] [CrossRef] [Google Scholar]
- Lodato, G., Dipierro, G., Ragusa, E., et al. 2019, MNRAS, 486, 453 [Google Scholar]
- Long, F., Pinilla, P., Herczeg, G. J., et al. 2018, ApJ, 869, 17 [Google Scholar]
- MacGregor, M. A., Wilner, D. J., Andrews, S. M., Lestrade, J.-F., & Maddison, S. 2015, ApJ, 809, 47 [NASA ADS] [CrossRef] [Google Scholar]
- Macías, E., Anglada, G., Osorio, M., et al. 2016, ApJ, 829, 1 [Google Scholar]
- Macías, E., Espaillat, C. C., Osorio, M., et al. 2019, ApJ, 881, 159 [CrossRef] [Google Scholar]
- Macías, E., Guerra-Alvarado, O., Carrasco-González, C., et al. 2021, A&A, 648, A33 [EDP Sciences] [Google Scholar]
- Mamajek, E. E., Meyer, M. R., & Liebert, J. 2002, AJ, 124, 1670 [Google Scholar]
- Manara, C. F., Ansdell, M., Rosotti, G. P., et al. 2022, ArXiv e-prints [arXiv:2203.09930] [Google Scholar]
- Marino, S., Perez, S., & Casassus, S. 2015, ApJ, 798, L44 [Google Scholar]
- Martinez-Brunner, R., Casassus, S., Pérez, S., et al. 2022, MNRAS, 510, 1248 [Google Scholar]
- Mayama, S., Akiyama, E., Panić, O., et al. 2018, ApJ, 868, L3 [NASA ADS] [CrossRef] [Google Scholar]
- McClure, M. K., Bergin, E. A., Cleeves, L. I., et al. 2016, ApJ, 831, 167 [Google Scholar]
- McMullin, J. P., Waters, B., Schiebel, D., Young, W., & Golap, K. 2007, in Astronomical Data Analysis Software and Systems XVI, 376, 127 [Google Scholar]
- Min, M., Stolker, T., Dominik, C., & Benisty, M. 2017, A&A, 604, L10 [NASA ADS] [CrossRef] [EDP Sciences] [Google Scholar]
- Miotello, A., van Dishoeck, E. F., Kama, M., & Bruderer, S. 2016, A&A, 594, A85 [NASA ADS] [CrossRef] [EDP Sciences] [Google Scholar]
- Miotello, A., van Dishoeck, E. F., Williams, J. P., et al. 2017, A&A, 599, A113 [NASA ADS] [CrossRef] [EDP Sciences] [Google Scholar]
- Miotello, A., Kamp, I., Birnstiel, T., Cleeves, L. I., & Kataoka, A. 2022, ArXiv e-prints [arXiv:2203.09818] [Google Scholar]
- Miyake, K., & Nakagawa, Y. 1993, Icarus, 106, 20 [NASA ADS] [CrossRef] [Google Scholar]
- Murphy, S. J., Lawson, W. A., & Bessell, M. S. 2013, MNRAS, 435, 1325 [Google Scholar]
- Natta, A., & Testi, L. 2004, ASP Conf. Ser., 323, 279 [Google Scholar]
- Ono, T., Muto, T., Takeuchi, T., & Nomura, H. 2016, ApJ, 823, 84 [NASA ADS] [CrossRef] [Google Scholar]
- Pascucci, I., Hollenbach, D., Najita, J., et al. 2007, ApJ, 663, 383 [NASA ADS] [CrossRef] [Google Scholar]
- Pascucci, I., Cabrit, S., Edwards, S., et al. 2022, ArXiv e-prints [arXiv:2203.10068] [Google Scholar]
- Pecaut, M. J., & Mamajek, E. E. 2013, ApJS, 208, 9 [Google Scholar]
- Pegues, J., Czekala, I., Andrews, S. M., et al. 2021, ApJ, 908, 42 [NASA ADS] [CrossRef] [Google Scholar]
- Pérez, L. M., Chandler, C. J., Isella, A., et al. 2015, ApJ, 813, 41 [CrossRef] [Google Scholar]
- Pérez, S., Casassus, S., & Benítez-Llambay, P. 2018, MNRAS, 480, L12 [Google Scholar]
- Pérez, S., Casassus, S., Baruteau, C., et al. 2019, AJ, 158, 15 [Google Scholar]
- Pinilla, P., Birnstiel, T., Ricci, L., et al. 2012, A&A, 538, A114 [NASA ADS] [CrossRef] [EDP Sciences] [Google Scholar]
- Pinte, C., Ménard, F., Duchêne, G., & Bastien, P. 2006, A&A, 459, 797 [NASA ADS] [CrossRef] [EDP Sciences] [Google Scholar]
- Pinte, C., Harries, T. J., Min, M., et al. 2009, A&A, 498, 967 [NASA ADS] [CrossRef] [EDP Sciences] [Google Scholar]
- Pinte, C., Price, D. J., Ménard, F., et al. 2018, ApJ, 860, L13 [Google Scholar]
- Ribas, Á., Espaillat, C. C., Macías, E., et al. 2017, ApJ, 849, 63 [NASA ADS] [CrossRef] [Google Scholar]
- Ribas, Á., Macías, E., Espaillat, C. C., & Duchêne, G. 2018, ApJ, 865, 77 [NASA ADS] [CrossRef] [Google Scholar]
- Ribas, Á., Espaillat, C. C., Macías, E., & Sarro, L. M. 2020, A&A, 642, A171 [NASA ADS] [CrossRef] [EDP Sciences] [Google Scholar]
- Ricci, L., Testi, L., Natta, A., & Brooks, K. J. 2010a, A&A, 521, A66 [NASA ADS] [CrossRef] [EDP Sciences] [Google Scholar]
- Ricci, L., Testi, L., Natta, A., et al. 2010b, A&A, 512, A15 [CrossRef] [EDP Sciences] [Google Scholar]
- Rilinger, A. M., Espaillat, C. C., Xin, Z., et al. 2023, ApJ, 944, 66 [NASA ADS] [CrossRef] [Google Scholar]
- Salinas, V. N., Hogerheijde, M. R., Mathews, G. S., et al. 2017, A&A, 606, A125 [NASA ADS] [CrossRef] [EDP Sciences] [Google Scholar]
- Sanchis, E., Testi, L., Natta, A., et al. 2021, A&A, 649, A19 [NASA ADS] [CrossRef] [EDP Sciences] [Google Scholar]
- Schmid, H. M., Joos, F., & Tschan, D. 2006, A&A, 452, 657 [NASA ADS] [CrossRef] [EDP Sciences] [Google Scholar]
- Schneider, G., Grady, C. A., Hines, D. C., et al. 2014, AJ, 148, 59 [NASA ADS] [CrossRef] [Google Scholar]
- Schütz, O., Meeus, G., & Sterzik, M. F. 2005, A&A, 431, 165 [CrossRef] [EDP Sciences] [Google Scholar]
- Simon, M., & Toraskar, J. 2017, ApJ, 841, 95 [NASA ADS] [CrossRef] [Google Scholar]
- Simon, M., Guilloteau, S., Beck, T. L., et al. 2019, ApJ, 884, 42 [NASA ADS] [CrossRef] [Google Scholar]
- Sokal, K. R., Deen, C. P., Mace, G. N., et al. 2018, ApJ, 853, 120 [Google Scholar]
- Stolker, T., Dominik, C., Min, M., et al. 2016, A&A, 596, A70 [NASA ADS] [CrossRef] [EDP Sciences] [Google Scholar]
- Tazzari, M., Testi, L., Ercolano, B., et al. 2016, A&A, 588, A53 [NASA ADS] [CrossRef] [EDP Sciences] [Google Scholar]
- Tazzari, M., Testi, L., Natta, A., et al. 2021, MNRAS, 506, 5117 [NASA ADS] [CrossRef] [Google Scholar]
- Teague, R. 2019, J. Open Source Softw., 4, 1220 [Google Scholar]
- Teague, R., & Foreman-Mackey, D. 2018, RNAAS, 2, 173 [NASA ADS] [Google Scholar]
- Teague, R., Bae, J., Bergin, E. A., Birnstiel, T., & Foreman-Mackey, D. 2018, ApJ, 860, L12 [NASA ADS] [CrossRef] [Google Scholar]
- Teague, R., Bae, J., Huang, J., & Bergin, E. A. 2019, ApJ, 884, L56 [Google Scholar]
- Teague, R., Hull, C. L. H., Guilloteau, S., et al. 2021, ApJ, 922, 139 [NASA ADS] [CrossRef] [Google Scholar]
- Testi, L., Birnstiel, T., Ricci, L., et al. 2014, Protostars and Planets VI, 339 [Google Scholar]
- Toci, C., Rosotti, G., Lodato, G., Testi, L., & Trapman, L. 2021, MNRAS, 507, 818 [NASA ADS] [CrossRef] [Google Scholar]
- Torres, C. A. O., Quast, G. R., Melo, C. H. F., & Sterzik, M. F. 2008, Young Nearby Loose Associations, ed. B. Reipurth, 757 [Google Scholar]
- Tripathi, A., Andrews, S. M., Birnstiel, T., & Wilner, D. J. 2017, ApJ, 845, 44 [Google Scholar]
- Tripathi, A., Andrews, S. M., Birnstiel, T., et al. 2018, ApJ, 861, 64 [NASA ADS] [CrossRef] [Google Scholar]
- Tsukagoshi, T., Muto, T., Nomura, H., et al. 2019, ApJ, 878, L8 [Google Scholar]
- van Holstein, R. G., Girard, J. H., de Boer, J., et al. 2020, A&A, 633, A64 [NASA ADS] [CrossRef] [EDP Sciences] [Google Scholar]
- Villenave, M., Stapelfeldt, K. R., Duchêne, G., et al. 2022, ApJ, 930, 11 [NASA ADS] [CrossRef] [Google Scholar]
- Weber, P., Pérez, S., Guidi, G., et al. 2023, MNRAS, 518, 5620 [Google Scholar]
- Weidenschilling, S. J. 1977, Ap&SS, 51, 153 [Google Scholar]
- Williams, J. P., & Best, W. M. J. 2014, ApJ, 788, 59 [Google Scholar]
- Wolff, S. G., Perrin, M., Millar-Blanchaer, M. A., et al. 2016, ApJ, 818, L15 [NASA ADS] [CrossRef] [Google Scholar]
- Xu, Z., & Bai, X.-N. 2022a, ApJ, 924, 3 [NASA ADS] [CrossRef] [Google Scholar]
- Xu, Z., & Bai, X.-N. 2022b, ApJ, 937, L4 [NASA ADS] [CrossRef] [Google Scholar]
- Zhang, S., Zhu, Z., Huang, J., et al. 2018, ApJ, 869, L47 [Google Scholar]
- Zhu, Z., Nelson, R. P., Hartmann, L., Espaillat, C., & Calvet, N. 2011, ApJ, 729, 47 [NASA ADS] [CrossRef] [Google Scholar]
- Zhu, Z., Stone, J. M., Rafikov, R. R., & Bai, X.-N. 2014, ApJ, 785, 122 [NASA ADS] [CrossRef] [Google Scholar]
- Zhu, Z., Zhang, S., Jiang, Y.-F., et al. 2019, ApJ, 877, L18 [NASA ADS] [CrossRef] [Google Scholar]
See ALMA Technical Handbook.
eddy defines the PA with respect to the red-shifted semi-major axis, so the adopted value was 190°.
The planetary mass upper limits in Asensio-Torres et al. (2021) were derived assuming a 3 Myr age for MP Mus. If the system is older as suggested by our analysis and other studies, then the upper limits would be higher.
All Tables
All Figures
|
Fig. 1 ALMA images of MP Mus at 1.3 mm. These are displayed using both linear (left) and logarithmic (right) scales to emphasize details at different brightness levels. The 0.06″ × 0.04″ beam is shown at the bottom left corners as white ellipses. |
| In the text | |
|
Fig. 2 ALMA 1.3 mm observations and model of MP Mus. The observed continuum emission (left) and the resulting image reconstructed from the frank radial profile (middle) are shown. The residuals (right) are displayed in units of the image RMS and are below the 5-σ level. |
| In the text | |
|
Fig. 3 Radial profiles of the 1.3 mm continuum and 12CO (2−1) emission of MP Mus. The continuum profile derived from the synthesized ALMA image is shown as a red line, and the orange line corresponds to the resulting profile from frank (Jennings et al. 2020). The profile for the 12CO (2−1) line is also shown as a blue line. The 1-σ uncertainties for the continuum and 12CO (2−1) are also plotted as red and blue shaded areas. In all cases, we adopted a disk inclination and PA of 32°and 10°. For comparison, the FWHM of the continuum and 12CO (2−1) beams are also shown as solid horizontal red and blue lines, respectively. |
| In the text | |
|
Fig. 4 Derived millimeter spectral index for MP Mus between 1.3 and 2.2 mm. Top: spectral index map. Only pixels with S/N > 5 are considered. The solid and dashed contours correspond to α1.3−2.2 mm of 2 and 2.5, respectively. The image beam is shown on the bottom left corner. Bottom: corresponding de-projected α1.3−2.2 mm radial profile and uncertainties (solid red line and area). The beam FWHM is shown as a horizontal red line. The dashed line marks the α = 2 transition. |
| In the text | |
|
Fig. 5 ALMA Band 6 observations of CO isotopologues from the protoplanetary disk around MP Mus. The top, middle, and bottom rows correspond to 12CO (2−1), 13CO (2−1), and C18O (2−1), respectively. The zero-th (left column) and first (middle column) moments are shown, together with the 5σ contour of the 1.3 mm continuum as a black line. The corresponding spectra are displayed in the right column. |
| In the text | |
|
Fig. 6 Keplerian fit to the 12CO (2−1) line emission of MP Mus using eddy. The observed first moment (left), model (middle), and corresponding residuals (right) are shown. The 0.17″ × 0.15″ beam is shown on the bottom left corner. The area inside the black ellipse shown in the residuals was masked during the fit. The tentative localized residuals mentioned in the text are also marked with a red line. Only the extended configuration from 2017.1.01419.S was used for this analysis. |
| In the text | |
|
Fig. 7 Comparison of ALMA and SPHERE observations of MP Mus. Top left: Qϕ-image in H-band (λobs = 1.6 µm) taken with SPHERE/IRDIS. The colormap is shown in logarithmic stretch. The central blue circle masks the area covered by the coronagraph of the observation. Top right: comparison of the 1.3 mm continuum emission (orange contour), the SPHERE Qϕ H-band data (purple), and one of the 12CO (2−1) channels (blue). The 1.3 mm contour corresponds to the 5 RMS level, while only data above the corresponding 3 RMS levels are shown for the 12CO (2−1) and scattered light observations. Bottom: comparison of the radial profiles of the SPHERE Qϕ × r2 in H-band (purple line), the 1.3 mm continuum (orange line), and the 12CO (2−1) emission (blue line). The SPHERE coronagraph is also shown. |
| In the text | |
|
Fig. 8 Location of MP Mus (black dot) in the HR diagram. MIST mass tracks (1.2, 1.3, and 1.4 M⊙) and isochrones (5, 7, 10, and 13 Myr) are also shown (Dotter 2016; Choi et al. 2016). |
| In the text | |
|
Fig. 9 Comparison of the radial profiles of MP Mus (red) and TW Hya (black) at 1.3 mm. The TW Hya data were taken from Macías et al. (2021), and convolved with a 0.08″Gaussian to match the resolution and distance of the MP Mus observations. The inner cavity and two of the known gaps gaps of TW Hya (at 25 and 45 au) are still visible in the case of TW Hya, in contrast with the smooth profile of MP Mus. |
| In the text | |
|
Fig. 10 Upper limits to the presence of planets in the disk around MP Mus as a function of radius. These upper limits are derived using Eq. (6) (Lodato et al. 2019) and the fact that no gaps with width Δ ≥ 5 au are detected in the disk. Three different values are used for the proportionality constant (k) linking the planet Hill radius and the corresponding gap width. |
| In the text | |
|
Fig. A.1 ALMA continuum images of MP Mus at 0.89 mm (top, unresolved) and 2.2 mm (bottom, resolved) shown in logarithmic scales. The images were synthesized with a robust value of -0.5. The corresponding beams (0.89″ ×0.66″and 0.25″ ×0.19″ at 0.89mm and 2.2 mm, respectively) are shown at the bottom left corners as white ellipses. |
| In the text | |
|
Fig. B.1 Comparison of the observed ALMA 1.3 mm continuum visibilities of MP Mus (black dots) and the results from the frank fit (red line). The visibilities are shown in 30-kλ bins. |
| In the text | |
|
Fig. C.1 Moments and spectra of the molecular lines detected by ALMA in the MP Mus protoplanetary disk in Band 7. Figures and symbols are the same as in Fig. 5. |
| In the text | |
|
Fig. C.2 Moments and spectra of the molecular lines detected by ALMA in the MP Mus protoplanetary disk in Band 4. Symbols are the same as in Figs. 5 and C.1. |
| In the text | |
Current usage metrics show cumulative count of Article Views (full-text article views including HTML views, PDF and ePub downloads, according to the available data) and Abstracts Views on Vision4Press platform.
Data correspond to usage on the plateform after 2015. The current usage metrics is available 48-96 hours after online publication and is updated daily on week days.
Initial download of the metrics may take a while.