Fig. 3
Download original image
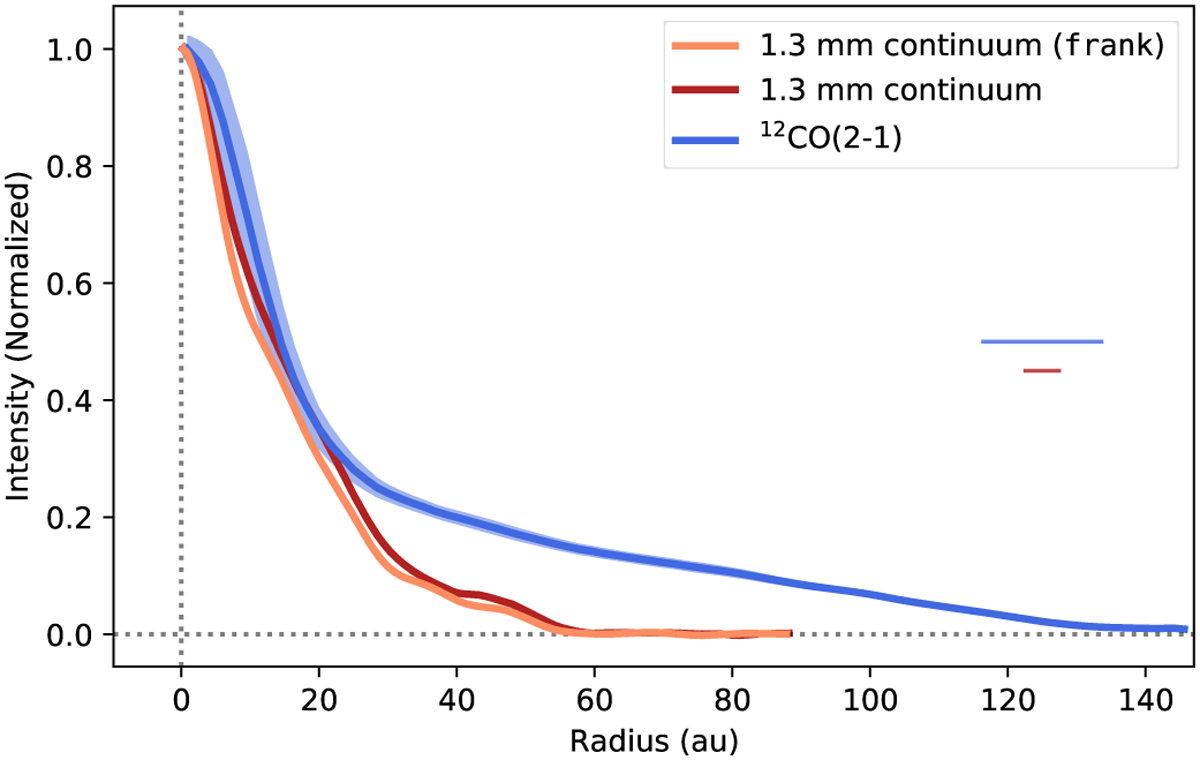
Radial profiles of the 1.3 mm continuum and 12CO (2−1) emission of MP Mus. The continuum profile derived from the synthesized ALMA image is shown as a red line, and the orange line corresponds to the resulting profile from frank (Jennings et al. 2020). The profile for the 12CO (2−1) line is also shown as a blue line. The 1-σ uncertainties for the continuum and 12CO (2−1) are also plotted as red and blue shaded areas. In all cases, we adopted a disk inclination and PA of 32°and 10°. For comparison, the FWHM of the continuum and 12CO (2−1) beams are also shown as solid horizontal red and blue lines, respectively.
Current usage metrics show cumulative count of Article Views (full-text article views including HTML views, PDF and ePub downloads, according to the available data) and Abstracts Views on Vision4Press platform.
Data correspond to usage on the plateform after 2015. The current usage metrics is available 48-96 hours after online publication and is updated daily on week days.
Initial download of the metrics may take a while.