| Issue |
A&A
Volume 698, June 2025
|
|
|---|---|---|
| Article Number | A165 | |
| Number of page(s) | 11 | |
| Section | Interstellar and circumstellar matter | |
| DOI | https://doi.org/10.1051/0004-6361/202554484 | |
| Published online | 12 June 2025 | |
Confirmation of a ring structure in the disk around MP Mus (PDS 66) with ALMA Band 7 observations
1
Instituto de Física y Astronomía, Facultad de Ciencias, Universidad de Valparaíso,
Av. Gran Bretaña 1111,
Valparaíso,
Chile
2
Instituto de Astrofisica, Departamento de Fisica y Astronomia, Facultad de Ciencias Exactas,
Universidad Andres Bello. Av. Fernandez Concha 700,
Las Condes,
Chile
3
Millennium Institute of Astrophysics,
Nuncio Monseñor Sotero Sanz 100, Of. 104, Providencia,
Santiago,
Chile
4
Departamento de Física, Universidad Técnica Federico Santa María,
Avenida España 1680,
Valparaíso,
Chile
5
Institute of Astronomy, University of Cambridge,
Madingley Road,
Cambridge
CB3 0HA,
UK
6
Center for Imaging Science, Rochester Institute of Technology,
Rochester,
NY
14623,
USA
7
School of Physics and Astronomy, Rochester Institute of Technology,
Rochester,
NY
14623,
USA
8
Laboratory for Multiwavelength Astrophysics, Rochester Institute of Technology,
USA
9
Instituto de Estudios Astrofísicos, Facultad de Ingeniería y Ciencias, Universidad Diego Portales,
Av. Ejercito 441,
Santiago,
Chile
10
Millennium Nucleus on Young Exoplanets and their Moons (YEMS),
Chile
11
Departamento de Física, Universidad de Santiago de Chile,
Av. Víctor Jara 3493,
Santiago,
Chile
12
Center for Interdisciplinary Research in Astrophysics & Space Exploration (CIRAS), Universidad de Santiago de Chile,
Chile
13
Telespazio UK S.L. for European Space Agency (ESA), Camino bajo del Castillo, s/n, Urbanización Villafranca del Castillo,
Villanueva de la Cañada,
28692
Madrid,
Spain
14
Department of Physics and Astronomy, Vanderbilt University,
Nashville,
TN
37235,
USA
15
First Center for Autism and Innovation, Vanderbilt University,
2414 Highland Avenue, Suite 115,
Nashville,
TN
37212,
USA
16
Departamento de Astronomía, Universidad de Chile,
Camino El Observatorio 1515,
Las Condes,
Santiago,
Chile
★ Corresponding authors: This email address is being protected from spambots. You need JavaScript enabled to view it.
; This email address is being protected from spambots. You need JavaScript enabled to view it.
; This email address is being protected from spambots. You need JavaScript enabled to view it.
Received:
11
March
2025
Accepted:
17
April
2025
Abstract
Context. Young stellar objects (YSOs) are surrounded by protoplanetary disks, which are the birthplace of young planets. Ring and gap structures are observed among evolved protoplanetary disks, often interpreted as a consequence of planet formation.
Aims. The pre-Main Sequence (pre-MS) star MP Mus hosts one of the few known examples of protoplanetary disks within 100 pc. Previously, a disk ring structure, with a radius of 80–85 au, was detected in scattered light via near-infrared polarimetric imaging. This ring structure may be indicative of the disk clearing process. Although such ring structures were not seen in the ALMA Band 6 images, some features were detected at ∼50 au.
Methods. In this paper, we analyzed new ALMA Band 7 observations of MP Mus in order to investigate the details of its disk substructures.
Results. By subtracting the continuum profile generated from Band 7 data, we discovered a ring structure in the Band 7 dust continuum image at ∼50 au. We calculated the overall dust mass as 28.4 ± 2.8 M⊕ at 0.89 mm and 26.3 ± 2.6 M⊕ at 1.3 mm and the millimeter spectral index α0.89–1.3 mm ∼2.2 ± 0.3 between 0.89 mm and 1.3 mm. Moreover, we display the spatial distribution of the spectral index (αmm), estimating values ranging from 1.3 at the inner disk to 4.0 at a large radius. Additionally, we observed an extended gas disk up to ∼120 au, in contrast with a compact continuum millimeter extent of ∼60 au.
Conclusions. We conclude that there are strong indicators for an active radial drift process within the disk. However, we cannot discard the possibility of a dust evolution process and a grain growth process as responsible for the outer disk structures observed in the ALMA continuum imaging.
Key words: techniques: interferometric / planets and satellites: formation / protoplanetary disks / circumstellar matter -stars: individual: MP Mus / stars: pre-main sequence
© The Authors 2025
 Open Access article, published by EDP Sciences, under the terms of the Creative Commons Attribution License (https://creativecommons.org/licenses/by/4.0), which permits unrestricted use, distribution, and reproduction in any medium, provided the original work is properly cited.
This article is published in open access under the Subscribe to Open model. This email address is being protected from spambots. You need JavaScript enabled to view it. to support open access publication.
1 Introduction
Stars are born from molecular clouds. Due to the conservation of angular momentum, newborn stars are surrounded by dust and gas-rich circumstellar disks, known as protoplanetary disks, which are the formation sites of young planets. In the protoplan-etary disk phase (gas-rich), dust particles grow and may form objects large enough to accrete gas from the disk in a runaway process. Also, substructures such as gaps and rings are generated, potentially by planet formation and/or other processes. After roughly ten million years, photoevaporation dissipates the gas disk, leaving behind a debris disk (e.g., Williams & Cieza 2011) which may then evolve into a mature planetary system.
The structure and evolution of the protoplanetary disk provide crucial information on planet formation (Williams & Cieza 2011; Andrews 2020; Pinte et al. 2023). High spatial resolution observations have discovered substructures inside the circumstellar disk, potentially indicating their ongoing planet formation process (see Andrews et al. 2018; Long et al. 2018), as early as during the protostellar stage (Segura-Cox et al. 2020). The bright and dark ring structures have been a topic of great debate as they are expected to be detected as a consequence of already formed (proto)planets on the disk (Zhu et al. 2014; Pérez et al. 2015). However, there are other mechanisms that can also form or show these structures, without requiring the presence of protoplanets, such as an effect of dust opacity due to grain growth (Birnstiel et al. 2015), hydrodynamic instabilities (Ward & Hahn 2000; Takahashi & Inutsuka 2014), magnetohydrodynamic instabilities (Gressel et al. 2015; Flock et al. 2015), fast pebble growth near condensation fronts (Zhang et al. 2015), and dust rings induced by sintering (Okuzumi et al. 2016; Okuzumi & Tazaki 2019; Hu et al. 2019). Regardless of their origin, these ring structures are excellent places to accumulate and concentrate large dust grains (e.g., Zhu et al. 2014; Flock et al. 2015; Ruge et al. 2016; Sierra et al. 2017, 2019), and their presence among disks of all ages (e.g., van der Marel et al. 2016; Andrews et al. 2018; Shi et al. 2024) becomes a great indicator that the formation of rings is a necessary first step for the formation of terrestrial planets (Carrasco-González et al. 2016; Kuwahara et al. 2024).
The sizes of even the brightest and largest protoplanetary disks in any given molecular cloud are ∼100 au (Williams & Cieza 2011), whilst the median size of most disks is ∼14 au (Dasgupta et al. 2025). For spatially resolving disks in nearby star formation regions (∼140 pc), observations with subarcsecond resolutions are required. Thus, observations with the Atacama Large Millimeter/submillimeter Array (ALMA) became crucial to resolve structures in disks. In the past decade, ALMA has provided data that revolutionized our understanding of the spatial properties of protoplanetary disks. This includes constraints on the distribution of millimeter sized dust grains, the kinematic parameters of molecular gas, and the disk chemical structures (see Andrews 2020; Huang et al. 2018; Öberg et al. 2021). High resolution ALMA data will also assist us in distinguishing different disk clearing mechanisms (e.g., photoevaporation and grain growth), providing constraints to the theoretical models, and finally placing an accurate diagnosis of the evolutionary stage of the planetary system.
Here, we focus on submillimeter observations obtained with ALMA of the disk around MP Mus, also known as PDS 66 or Hen 3-892: A star of 1.2 ± 0.2M⊙, K1 spectral type and an age of 3.1 ± 0.9 Myr (Asensio-Torres et al. 2021). According to Gaia DR3, the distance of MP Mus is 97.8 pc (Gaia Collaboration 2023), placing it among the three known, actively accreting, near solar mass stars within 100 pc. The other two nearby, roughly solar-mass pre-main sequence (pre-MS) stars that display evidence for ongoing accretion are TW Hya and V4046 Sgr (Kastner & Principe 2022). The young nature of MP Mus was originally reported by Gregorio-Hetem et al. (1992), based on the infrared excess and a strong Ha emission feature in the spectrum. This star is located in the nearest OB association Scorpius-Centaurus and was originally considered a member of the Lower Centaurus Cruz (LCC) subgroup (Mamajek et al. 2002), with an estimated age of 17 Myr. Later, MP Mus was classified as a member of the ∊ Chamaeleon Association (CA), which has a much younger age of 38 Myr (Torres et al. 2008; Murphy et al. 2013; Dickson-Vandervelde et al. 2021). A younger age of the system, 7 Myr, is also supported by the strength of the Li absorption line at 6708 Å (Weise et al. 2010) and the star's position near the boundary of the ∊ CA and the youngest (∼8 Myr) LCC subgroup (Varga et al. 2024). Applying contemporaneous near-UV observation from the Hubble Space Telescope (HST) and ground-based optical spectrum, (Ingleby et al. 2013) measured the mass accretion rate as 1.3 × 10⁻¹⁰ M⊙ yr-1, placing it at the lower mass accretion range of pre-MS stars.
The measurement of the circumstellar disk properties of MP Mus started almost two decades ago. First, the total dust mass of the disk has been estimated to be 5 × 10⁻⁵ MΘ or 1.6 M⊙ (Carpenter et al. 2005). Using the N-band (8-13 μm) spectra and infrared Spectral Energy Distribution (SED) up to 1 mm, Schütz et al. (2005) discovered grain growth in the circumstellar disc. Later on, Bouwman et al. (2008) detected circumstellar silicate dust grains in the disk of MP Mus, applying mid-infrared spectra from the Spitzer satellite. The first scattered light image of MP Mus was taken by the NICMOS on HST (Cortes et al. 2009), with an estimated disk radius of 170 au. Kastner et al. (2010) established the presence of a significant gaseous component within the MP Mus disk via detection of 12CO(3-2) emission and estimated the gas disk radius as ∼ 120 au. With the development of the laser guiding near-infrared observations, a disk ring was detected around 80 auby the Gemini Planet Imager (Wolff et al. 2016). The dip of the surface brightness between the bright optically thick inner disk and the ring structure at 80 au indicates an ongoing clearing process inside the disk plane, consistent with the classification of a transitional disk. Similarly, (Avenhaus et al. 2018) discovered a ring structure at 85 au and an inclination of30 deg using the SPHERE instrument located in ESO/VLT. In addition, no accreting sub-stellar component was detected by the Hα emission inside the disk cavity down to the 12 mag contrast of the central star (Zurlo et al. 2020).
Ribas et al. (2023) presented ALMA observations of MP Mus down to 4 au resolution in the 1.3 mm bandpass (Band 6). They found an optically thick disk with a radius of 60±5 au, with the possible exception of a barely resolved outer ring at ∼50 au. The mismatch between the gap locations detected in scattered light and dust continuum indicates that the ring structure seen in the near-infrared might only be a shadow cast by a puffed inner disk. The molecular gas (e.g., 12CO) emission spreads widely to a radius of 130 au. They also measured the millimeter spectral index (αmm) and found an inhomogeneous distribution of the αmm value. This result indicates that the optically thick emission arises from high albedo dust grains residing in the inner 30 au of the disk (α < 2). Subsequently, Grimble et al. (2024) analyzed the structure and composition ofMP Mus using the Spitzer IRS spectrum and ALMA Band 6 image, with radiative transfer models. In this work, the authors found that a density gap (i.e., a ring at 80 au) fits the observational SED better than disk shadowing, within the limitations of the modeling.
2 Observations and data reduction
In this study, we present and analyze ALMA observations of MP Mus from two Cycle 5 programs at 1.3 mm (Band 6; 2017.1.01419.S PI Claudio Cáceres; 2017.1.01167.S P.I.: Sebastián Pérez) and one Cycle 8 program at 0.89 mm (Band 7; 2021.1.01205.S PI: Claudio Cáceres). For the continuum analysis, we focus on Band 7 observations, and for comparison, we used the extended configuration of 2017.1.01167.S in Band 6 since it has the best resolution between the two datasets. The rms of the compact configurations for both datasets are systematically higher than the one of the extended configurations. In addition, the compact configurations Band 7 dataset showed issues during the phase calibration. After combining the compact and extended configurations we did not see an improvement in the rms nor in the image quality, thus we decided to use only the extended configurations of Band 7 and Band 6 for the continuum analysis. However, for line analysis, we used the combined compact and extended configurations of each data set. The details of the different data sets are summarized in Tables B.1 and B.2, including the corresponding correlator configurations.
For data reduction, we used the standard pipeline calibration provided by the ALMA staff using the Common Astronomy Software Applications package, (CASA; McMullin et al. 2007) version 5.6.1-8-10.14. We detected continuum emission from the disk with a high peak Signal to Noise ratio (S/N > 100). After this, we performed selfcalibration to the extended configurations for each band; first excluding all channels with emission lines and then, using mtmfs deconvolver, Briggs weighting, a robust value of 0.5 and -0.5, and nterms=2. In addition, selfcalibration was performed on the combined compact and extended configurations for the line analysis. To properly combine these datasets, we found the peak of the disk continuum emission by fitting a 2D Gaussian shape to each dataset. Then, we applied CASA tasks fixvis and fixplanets to set the phase center to a common coordinate to finally use concat task to concatenate both data sets.
For Band 7, we performed a five-step phase only calibration. We sought solutions over 60 s intervals on the first four steps and solutions over 45 s on the fifth step. By doing so, we improved the root mean square (rms) noise by 60% and S/N of the emission peak by 215% (from 125 to 394) for a robust value of r = 0.5 and an improvement of 30% on S/N (from 107 to 141) for a robust value of r = -0.5. For Band 6 observations, we performed a similar four step phase only calibration and sought solutions over 35 s for the first and second steps, and solutions over 25 s for the third and fourth steps. In this case, the rms noise is reduced by 80% and S/N is improved by 800% (from ~40 to ~320) for both robust values: r = 0.5 and r = -0.5.
Continuum parameters of the extended configurations in Band 7 and Band 6 used in this study.
3 Results
The ALMA Band 7 observation provides a high spatial resolution of 0.07×0.05″ that complements the previous Band 6 observations that reach a resolution of 0.06×0.04″ (Ribas et al. 2023), both with a robust value of -0.5. In this section, we will analyze the disk structures from these Band 6 and 7 observations, in terms of the continuum images and radial profiles, and their CO spectral line counterparts.
3.1 Dust continuum
3.1.1 Continuum images
We present synthesized continuum images at 0.89 mm (Band 7) and 1.3 mm (Band 6) from the selfcalibrated data described in Sect. 2. We applied the tclean algorithm with mtmfs deconvolver and “nterms=2”. We adopted a robust value of r = 0.5, which is an intermediate value between the angular resolution and S/N, and also consistent with the analysis made by (Ribas et al. 2023). Additionally, we applied r = -0.5 to explore the disk with a better angular resolution (-5 au at 98 PC), thus observing small scale substructures. The resulting beam sizes are 0.09 × 0.07″ at 0.89 mm and 0.12″ × 0.10″ at 1.3 mm for r = 0.5; and 0.07″ × 0.05″ at 0.89 mm and 0.11″ × 0.09″ at 1.3 mm for r = -0.5. The estimated rms for Band 7 are 4.8 × 10⁻⁵ [Jy/beam] for r = 0.5 and 5.8 × 10⁻⁵ [Jy/beam] for r = -0.5 and for Band 6 are 4.1 × 10⁻⁵ [Jy/beam] for r = 0.5 and 3.9 × 10⁻⁵ for r = -0.5 (see Table 1). We only used selfcalibrated extended configurations to produce the continuum images and deprojected brightness profiles. To estimate continuum fluxes, we applied aperture photometry on these images with a 5-σ mask. The measured continuum fluxes are 388 ± 39 mJy at 0.89 mm and 168 ± 17 mJy at 1.3 mm. The maximum recoverable scales (θMRS), based on the most extended antenna configuration we used in this study (with a minimum baseline of 92 m in Band 6 and 41 m in Band 7, see Table B.1), are 2.7″ and 1.8″ at 0.89 mm and 1.3 mm, respectively1. Both values are larger than the observed angular size of the disk. In Fig. 1, we present the Band 7 image with r = -0.5 on both linear and logarithmic scales. A ring structure at 0.45-0.50″ or ~45-50 au (assuming d = 98 pc) is detected.
3.1.2 Continuum radial profiles
The radial profile of a circumstellar disk carries valuable information on the disk morphology, therefore revealing substructures such as rings and gaps. Additionally, it also provides the intensity distribution, which will further infer the spatial distribution of dust grains and gas molecules in the disk.
The disk inclination angle (i) and position angle (PA) of MP Mus were measured as 32° and 10° based on a 2D Gaussian fit to the 0.89 mm dust continuum in Band 7, which is in total agreement with estimations made from Band 6 at 1.3 mm dust continuum (Ribas et al. 2023) and scattered light observations (e.g., Avenhaus et al. 2018). To confirm the existence of the substructures in the disk, we deprojected the continuum image adopting the aforementioned disk inclination and PA. We then extracted the azimuthal average radial profile, as the average intensity within concentric rings centered at the peak intensity of the source. The central location is also estimated by the 2D Gaussian fit. These profiles are presented in Fig. 2.
The continuum profiles are extended until ~60 au in Band 7, a similar result to that in (Ribas et al. 2023). While Band 6 profiles are apparently smooth, in Band 7, some structures are seen. With a robust value of r = -0.5 in the Band 7 profile, we discovered what seems to be a little bump at ~50 au that could correspond to the ring structure observed in Fig. 1 since they are at the same location at ~45-50 au. Moreover, this bump is in total agreement with the feature found by Ribas et al. (2023) in Band 6. In addition, from the Band 7 profiles, it seems that a second bump emerged at ∼60 au, but this is a very low S/N feature.
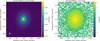 |
Fig. 1 ALMA Band 7 continuum images of MP Mus at 0.89 mm using the selfcalibrated extended configuration with a robust value of r = -0.5. The synthesized beam size (white ellipse) is shown in the bottom left corner. Left: linear scale; Right: logarihtmic scale. |
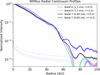 |
Fig. 2 Continuum deprojected radial profiles of MP Mus using selfcalibrated extended configurations for Band 6 (2017.1.01167.S) and Band 7, with robust values of 0.5 and -0.5. Their respective 1σ uncertainties are presented as shades around the solid lines. The faint dotted lines in the bottom part of the figure correspond to 5σ detection limits from the rms, calculated for each dataset and each radial bin. |
3.1.3 Frank radial profile
Here, we used the FRANKENSTEIN software (Frank; Jennings et al. 2020) to construct a 1D radial profile from the visibilities of the continuum in Band 7, to perform an in depth study of the MP Mus. Frank calculates super resolution radial profiles of protoplanetary disks assuming azimuthal symmetry, an assumption that is in agreement with previous observations of MP Mus (Avenhaus et al. 2018). Using a fast (<1 min) Gaussian process, the Frank software fits the visibilities directly and reconstructs a 1D radial brightness profile nonparametrically. The inclination and position angle values derived from Frank are consistent with the previously adopted results. We then compare it with the one previously calculated in Band 6 by Ribas et al. (2023) and with the continuum radial profiles (see Fig. 3).
From the reconstruction of Frank profiles, we noticed that the bump at ∼45-50 au is present, which is in total agreement with the continuum image and the continuum radial profile in Band 7.
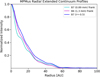 |
Fig. 3 Radial profiles of the continuum for MP Mus using selfcalibrated extended configurations in Band 7 and frank radial profile reconstruction from the visibility of Band 6 (from (Ribas et al. 2023) and Band 7. |
3.1.4 Dust continuum versus 12CO profiles
The micrometer sized dust grains that reflect starlight are distributed out to greater distances than the larger particles responsible for the millimeter continuum (e.g., Garufi et al. 2018; Ansdell et al. 2018). Also, models of transitional disks show that small grains extend to larger radii than large grains (e.g., Villenave et al. 2019). All of this is expected since small grains are predicted to be well coupled with the gas. On the other hand, large grains are much less decoupled from the gas and under the effects of radial drift, settle to the disk midplane (Barrière-Fouchet et al. 2005).
Moreover, if we look at the 12CO line profiles in Fig. 4, where smaller dust grains sizes are coupled to the gas, the disk is much more extended than ∼60 au (the millimeter dust grains extension), reaching a disk extension of ∼ 110 au for 12CO(2-1) and ∼120 au for 12CO(3-2), which results in total agreement with the relation found by Andrews (2020) of RCO ≥ 2Rmm based on 0.9 mm data from Öberg et al. (2011), Simon et al. (2017), Ansdell et al. (2018), and Facchini et al. (2019).
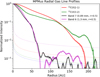 |
Fig. 4 Continuum radial profiles compared with 12CO radial profiles, with the same label definition as Fig. 2. |
3.2 Parameters calculation
3.2.1 Disk masses
Submillimeter observations are ideal for estimating disk masses (see examples in Andrews & Williams 2005). At a scale much larger than 10 au, the continuum emission is assumed to be optically thin; therefore, the observed flux, Fν, is directly related to the disk mass. Here, we use the following relation to estimate the disk dust mass (Hildebrand 1983):
 (1)
(1)
where d = 98pc is the distance to MP Mus from Gaia DR3. We assume Bν ≈ 2ν2kT/c2, since the Planck function is close to the Rayleigh-Jeans regime, a temperature of T = 20 K and κν ∼ 3 cm2g-1 as the dust opacity at 0.89 mm (Ricci et al. 2012b) and 1.3 mm (Andrews et al. 2011). This results in (8.53 ± 0.85) × 10-5M⊙ or 28.4 ± 2.8M⊕ at 0.89 mm and (7.88 ± 0.79) × 10-5 M⊙ or 26.3 ± 2.6 M⊕ at 1.3 mm as upper limits. In addition, by assuming that MP Mus has properties similar to a median disk in Taurus, we use the linear relations derived by Cieza et al. (2008) (see Eqs. (1), (3)) to estimate the total disk mass from the observed flux.
![Mathematical equation: M_{\rm disk} = 1.7 \times 10^{-1} \left [ \frac{F_{\nu}(\rm 1.3~mm)}{\rm mJy} \times \left (\frac{d}{\rm 140pc} \right )^{2} \right ] M_{J}](/articles/aa/full_html/2025/06/aa54484-25/aa54484-25-eq2.png) (2)
(2)
![Mathematical equation: M_{\rm disk} = 8.0 \times 10^{-2} \left [ \frac{F_{\nu}(\rm 0.85~mm)}{\rm mJy} \times \left (\frac{d}{\rm 140pc} \right )^{2} \right ]M_{J}](/articles/aa/full_html/2025/06/aa54484-25/aa54484-25-eq3.png) (3)
(3)
These relations come from modeling the IR and submillimeter SED of observations presented by Andrews & Williams (2005, 2007), with a disk temperature of T = 20K, which is the median disk calculated by Andrews & Williams (2005), and a dust opacity of κν = 10[ν/1200 GHz] cm2 g-1 that simply assumes a gas-to-dust mass ratio of 100 (Williams & Cieza 2011; Cieza 2016). These results on total disk masses of 15.43 ± 1.55 MJup at Band 7 and of 14.2 ± 1.44 MJup at Band 6. However, dust opacities at millimeter wavelengths have a great dependence on grain size distribution, structure, and composition of the disk, therefore, their values still remain highly uncertain (Birnstiel et al. 2018; Birnstiel 2024).
3.2.2 Spectral index
In protoplanetary disks, the millimeter spectral index (αmm) has a strong dependence on the grain size distribution and, therefore, it is a widely used parameter to investigate grain growth in circumstellar disks among several star forming regions (e.g., Ricci et al. 2012a; Ribas et al. 2017; Ansdell et al. 2018; Tazzari et al. 2021). At millimeter wavelengths, the thermal emission of a disk, integrated over its surface, is dominated by the emission of the outer, optically thin region. By assuming that the dust emission from the disk is optically thin and in the RayleighJeans limit regime (unless the disk would be abnormally cold), the wavelength dependence of the integrated flux is expressed as  , where βmm is the dust opacity index. Thus, we can fit the observed submillimeter and millimeter SED between two frequencies with
  , where the sub-mm/mm spectral index is related to the dust opacity index by αmm = βmm + 2.
We calculated a spectral index between Band 6 and Band 7 as  by using the integrated fluxes values calculated in Sect. 3.1. However, this value only represents an average spectral index in the disk, without the information of the spatial distribution. In addition, based on more recent millimeter observations at different wavelengths of several protoplanetary disks, the opacity index and, by extension, the spectral index, may change with the radius (Guilloteau et al. 2011; Pinilla et al. 2014; Birnstiel 2024). In order to study the spatial variation of a, we combined 0.89 mm and 1.3 mm observations to produce a spectral index map. To join the data, we set a common phase center estimated by a 2D Gaussian fit, and then we used the tclean task with mtmfs deconvolver, nterms=2, which internally sets a common beam size between the two visibility data sets. We also probe with different robust values (0.5, 0.0, and -0.5). The resulting alpha images were used as the spectral index map, and it is shown in Fig. 5 along with its deprojected radial profiles. As expected, the spectral index (α0.89-1.3 mm), is variable through the disk, increasing with radius, starting with a value of ∼1.2 at the inner radius and finishing with a value of ∼4 for r = 0.5. For a further discussion, see Sect. 4.2.
4 Discussion
41 Millimeter substructure in Band 7
With the new dataset with high angular resolution in Band 7 (∼5 au), we are able to observe a small outer ring that has been revealed at ∼50 au from the continuum emission at 0.89 mm. However, there are still no signs of an inner cavity.
In previous works at millimeter wavelengths, MP Mus appeared to be a smooth disk, although it has a ring structure in scattered light (Avenhaus et al. 2018). Ribas et al. (2023) reached a similar angular resolution at 1.3 mm (∼4 au) as our Band 7 data, observing a smooth disk with the possibility of a barely resolved outer ring at ∼50 au. This is an interesting scenario, where the angular resolutions are similar in both bands and the structure is revealed at 0.89 mm observations, confirming the features found at 1.3 mm by (Ribas et al. 2023), which may be more pronounced at Band 7 since it has a larger S/N emission than that at Band 6. To emphasize the structure, we made a brightness profile multiplying the brightness intensity by r2, shown in Fig. 6, where a peak is shown between 45-50 au, which matches the observed outer ring in the continuum image at 0.89 mm.
To understand the reasons why we are not able to observe the same structure in the 1.3 mm continuum, we convolved the 0.89 mm continuum image with the beam size of the 1.3 mm continuum image and then corrected the images to a common phase center, estimated by a 2D Gaussian fit. The resulting image, along with its residual image, are shown in Fig. 7. The ring structure seems to disappear with the convolution to the larger beam size, suggesting that there is not enough angular resolution to resolve the structure in our 1.3 mm image. However, the ring structure is clearly presented in the residual image (see the right panel of Fig. 7).
In addition, Pinilla et al. (2014) compared data from Ricci et al. (2012b), who presented millimeter fluxes and integrated spectral indices of ∼50 classical disks in Taurus, Ophiuchus, and Orion star forming regions with data of transitional disks in Taurus, Perseus, Lupus, Ophiuchus, and, among others (references therein). They found that the mean value of the integrated spectral index for a typical protoplanetary disk corresponds to a value of  in comparison to a value of
  for transitional disks. Also, the values estimated on previous works are consistent with both, classical and transitional disks: Cortes et al. (2009) found a value of α3 mm-12 cm = 2.4 ± 0.1 and Ribas et al. (2023) found values of α0.89-1.3 mm = 2.4 ± 0.3, α1.3-2.2 mm = 2.12 ± 0.11 and α0.89-2.2 mm = 2.25 ± 0.13. From the spectral index estimated for MP Mus (α0.89-1.3 mm ∼ 2.2), its value is more concordant with classical protoplanetary disks, added to the fact that it does not present a large inner cavity, a necessary feature for MP Mus to be classified as a transitional disk.
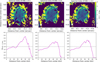 |
Fig. 5 Top : spectral index maps of MP Mus between 0.89 mm and 1.3 mm, with different Briggs robust values: 0.5, 0.0, and -0.5. Bottom : deprojected α0.89-1.3 mm radial profiles. The horizontal dashed line represents the Rayleigh-Jeans limit (αmm = 2). |
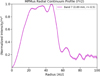 |
Fig. 6 Radial brightness profile of Band 7 continuum of MP Mus multiplying by r2 to emphasize the feature. A robust value of r = -0.5 was used for this profile. |
4.2 Indicators of grain growth and radial drift on the disk
As we mentioned before, the spectral index has been widely used to characterize the dust properties in protoplanetary disks, especially to constrain the maximum particle sizes in the submillimeter to centimeter range. The opacity spectral index, β, is sensitive to the maximum grain size of the disk, amax (e.g., Natta & Testi 2004; Draine 2006; Testi et al. 2014). When dust grains reach millimeter or larger sizes (αmax >> λ), the absolute value of dust opacity, κλ, decreases, β becomes smaller (β ∼ 0) and the emission follows the shape of a blackbody (αmm ∼ 2). Alternatively, smaller dust grains (αmax << λ, e.g., ISM like grains) have β ∼ 2. Another possible explanation for low values of β is regions of high optical depth, where Ricci et al. (2012a) has shown that this scenario would only be possible for the brightest and most massive disk. Thus, low values of β, and therefore, αmm are indicative of significant grain growth, high optical depth, or a combination of these two processes (Birnstiel 2024). From our derived spectral index a0.89-1.3 mm, we found a range of β between: 0.0-0.5.
On the other hand, compact disks at millimeter wavelengths are expected from radial drift models, where dust pebbles drift toward (local) pressure maxima present in the gas structure (e.g., Weidenschilling 1977), grain growth of the millimeter grains, and also due to line optical depth. These effects predict that millimeter continuum emission should be much more compact than the emission of gas tracers, particularly of the CO tracer (e.g., Facchini et al. 2017; Trapman et al. 2019).
Birnstiel & Andrews (2014) demonstrate that the combined effects of radial drift and (viscous) gas drag naturally produce a sharp outer edge in the dust distribution, where this edge feature forms before grain growth has made much progress in the outer disk, and remains over longer timescales. Also, the average dust-to-gas mass ratio of the disk should be lower than the canonical 1%, with the inner regions locally showing a higher value.
Furthermore, αmm is variable and increases its value as a function of the radius. In Fig. 5, we observed a value variation of α0.89-1.3 mm between 1.2 and 3.0-4.0 depending on the robust value we used, where the blackbody limit is reached at ∼30 au (α = 2). Since the spectral index is lower (αmm < 2) at the inner radius, it suggests that this part of the disk is optically thick, the information about dust sizes is lost and we are observing an elevated surface of the disk with the continuum emission at 1.3 mm and 0.89 mm, which could hide some structures in the midplane of the disk. For larger radii, where αmm > 2 and β remain in lower values (between 30 and 40 au), it could be possible that grain growth takes part as an effective process. In addition, in regions where dust growth is effective, assuming that dust opacity is dominated by absorption is far from reality; instead, for those large particles, the dust opacity should indeed be dominated by scattering (e.g., Birnstiel et al. 2018; Sierra et al. 2019).
Since the inner part of the MP Mus disk is optically thick, we only have information on the surface, indicating a larger population of grains than the observation, which could be translated into a higher dust-to-gas ratio. Also, MP Mus shows a compact disk in millimeter continuum (∼60 au) in contrast with gas tracers such as12CO lines, reaching a radius of ∼ 110-120 au (see Appendix C). Moreover, we obtained an estimated ratio of Rgas/Rdust ∼ 2, a value that is not large enough to demonstrate dust evolution, which requires an Rgas/Rdust > 4 (Trapman et al. 2019). Thus, it is likely that the radial drift is the most dominant process. However, identifying the dust evolution process from Rgas/Rdust requires modeling the disk structure, including the total CO content.
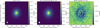 |
Fig. 7 Continuum images of MP Mus. The beam sizes are shown in the lower left corner of each image. Left: Band 6 continuum of MP Mus with r = -0.5 and a beam size of 0.11″ × 0.09″. Right : Band 7 continuum of MP Mus convolved with the beam of Band 6 and r = -0.5. The beam size is 0.13″ × 0.1″. |
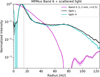 |
Fig. 8 Radial brightness profile of J and H Band from Sphere at scattered light in comparison with the Band 6 continuum with a robust value of r = 0.5. The vertical dashed line corresponds to the coronograph limit. |
4.3 Comparison with disk opacity theory
Substructures in the disk of MP Mus have been identified in the scattered light images from SPHERE (Avenhaus et al. 2018), with a depression of its intensity between 25-75 au. However, on the ALMA Band 6 continuum image, there were no indications of substructures within the 80 au of the disk (Ribas et al. 2023), except for a feature at ∼50 au. In Fig. 8, we compare the radial profiles of the near-IR scattered light (1.65 μm) that shows apeak of intensity at 80 au with ALMA Band 6 continuum (1.3 mm), where the profile is extended until ∼60 au.
Birnstiel et al. (2015) proposed that the inconsistency between the near infrared and submillimeter observed disk profiles may be an effect of dust opacity due to dust evolution. Briefly, in the distribution of particle sizes as a function of radius, there is a disk region where the population of small grains is not replenished and fragmentation is inefficient. Hence, the turbulent diffusion cannot extend there, resulting in short dust growth and drift timescales, leading to the presence of smaller dust grains (see Fig. 1 of Birnstiel et al. 2015). Additionally, its predictions in the radial intensity profiles between scattered light and millimeter continuum could be in agreement with our observations at (25-50 au), where a dip in the scattered light is observed, whilst there is an absence in millimeter observations (see Fig. 3 of Birnstiel et al. 2015). However, the ring is detected at ∼(80 au), and at this radius, we have no signal from millimeter observations. Moreover, we detected a ring at ∼50 au, whose results are incompatible with the predictions for this effect, that it is based on the fact that there is no structure at 1.3 mm.
5 Conclusions
Protoplanetary disks are the birthplace of planetary systems, offering a unique view of the mechanisms of planet formation and disk evolution. Transitional disks, characterized by their gaps and rings, represent an intermediate stage between gas rich primordial disks and debris dominated systems. In this work, we studied the disk structure of MP Mus, as one of the closest disks to our solar system. At a distance of 97.8 pc, MP Mus is an excellent target for investigating detailed grain growth and disk evolution procedures. Previous studies of MP Mus revealed disk structures in the near-IR (due to scattering light) but a lack of resolved detections in the submillimeter data.
Here, we presented new observations of MP Mus obtained with ALMA Band 7 at 0.89 mm. These observations provide a higher spatial resolution of ∼5 au that complements previous Band 6 data at 1.3 mm which reaches a resolution of ∼4 au, allowing us to probe the disk morphology in greater detail. The spectral index (αmm) was mapped by combining multiband ALMA dust continuum data, enabling us to investigate the radial distribution of grain sizes and their implications for disk opacity and grain growth processes. Our key findings include:
Detection of a ring structure: A ring was confirmed at ∼50 au at 0.89 mm dust continuum from the ALMA Band 7 data, a feature that was not observed in our Band 6 data due to its low spatial resolution;
Extended gas disk: A gas disk was observed to extend up to ∼ 120 au in the 12CO tracer, significantly beyond the dust disk (∼60 au), consistent with theoretical predictions on the large gas disk radii due to radial drift. However, it can also be a contribution to dust evolution, but models for disk structure that include the total CO content are required;
Spectral index variation: the radial variation of the spectral index in Band 6 and Band 7 showed a significant increase from ∼1.2 in the inner disk to ∼3.0-4.0 in the outer radius (∼55 au), depending on the robust value we used. This gradient reflects the changing optical depth and grain size distribution, suggesting active processes such as radial drift and dust trapping;
Implications for grain growth: The detection of substructures at shorter wavelengths and their absence in Band 6 implies that millimeter sized grains dominate the emission in the observed regions, providing evidence of ongoing grain growth and evolution;
Disk classification: Putting together the relation between spectral index and type of disks, and that there is no evidence of a large inner cavity in the disk, we cannot classify MP Mus as a transitional disk. However, the ring structure detected and the indications for the radial drift process suggest an interesting stage of evolution in the disk.
In summary, our results underline the complex interplay of physical processes shaping disks such as MP Mus. The presence ofa ring structure at 50 au and the radial variation of the spectral index provide critical information about disk clearing mechanisms and the initial stages of planet formation. Future theoretical modeling, coupled with more observational data (e.g., JWST and ALMA), will be the key to further understanding the dynamics and evolution of such systems.
Acknowledgements
The authors thank Professor Ruobing Dong for his kind referee report on this study. We have improved the manuscript under his suggestions. The authors thank Dr. James Miley for his guidance on the frankenstein software. A.A. acknowledges support through a Fellowship for National PhD students from ANID, grant number 21212094. A.A. acknowledges sup-por from ANID, Millennium Science Initiative, via the Nècleo Milenio de Formación Planetaria (NPF). C.C. acknowledges support by ANID BASAL project FB210003. ZG is supported by the ANID FONDECYT Postdoctoral program No. 3220029. ZG is supported by the China-Chile Joint Research Fund (CCJRF No.2301) and the Chinese Academy of Sciences South America Center for Astronomy (CASSACA) Key Research Project E52H540301. CCJRF is provided by the CASSACA and established by the National Astronomical Observatories, Chinese Academy of Sciences (NAOC), and Chilean Astronomy Society (SOCHIAS) to support China-Chile collaborations in astronomy. A.R. has been supported by the UK Science and Technology Facilities Council (STFC) via the consolidated grant ST/W000997/1 and by the European Union's Horizon 2020 research and innovation programme under the Marie Sklodowska-Curie grant agreement No. 823823 (RISE DUSTBUSTERS project). S.P. acknowledges support from FONDECYT grant 1231663 and funding from ANID – Millennium Science Initiative Program – Center Code NCN2024_001. L.A.C. acknowledges support from the Millennium Nucleus on Young Exoplanets and their Moons (YEMS), ANID – NCN2021 080 and NCN2024 001. L.A.C. acknowledges support from ANID, FONDECYT Regular grant number 1241056, Chile. W.G. acknowledges that partial support for this work was provided by Vanderbilt University's First Center for Autism & Innovation. A.S.M. acknowledges support from ANID / Fondo 2022 ALMA / 31220025. This work was funded by ANID, Millennium Science Initiative, AIM23-0001. This paper makes use of the following ALMA data: ADS/JAO.ALMA 2017.1.01419.S, ADS/JAO.ALMA#2017.1.01167.S, and ADS/JAO.ALMA#2021.1.01205.S. ALMA is a partnership of ESO (representing its member states), NSF (USA), and NINS (Japan), together with NRC (Canada), MOST and ASIAA (Taiwan), and KASI (Republic of Korea), in cooperation with the Republic of Chile. The Joint ALMA Observatory is operated by ESO, auI/NRAO and NAOJ.
Appendix A Line cube images
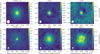 |
Fig. A.1 Moment 0 Map of gas lines detected in Band 6 and Band 7 data. |
Appendix B Tables
ALMA observation log.
ALMA correlator configuration log.
Appendix C Line radial profiles
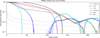 |
Fig. C.1 Radial brightness profile of the continuum emission and absorption lines for MP Mus, combining the extended and compact configurations in band 6. |
Appendix D Gas disk radii
We measured the gas size by using the lines we had available. For this, we deprojected moment 0 images using position angle and inclination previously estimated by a 2D Gaussian fit of the continuum and then, extracted deprojected azimuthally averaged radial profiles of the gas emission lines. We considered the following definition for integrated disk flux:
 (D.1)
(D.1)
where s is the projected radial coordinate in the sky and I(s) is the observed intensity. We estimated the gas disk radius, Rgas, as the radius that contains 95% of the total flux. We obtained an R12CO(2-1) of 110.8 ± 8.9 au and an R12CO(3-2) of 121.7 ± 9.7 au.
References
- Andrews, S. M. 2020, ARA&A, 58, 483 [Google Scholar]
- Andrews, S. M., & Williams, J. P. 2005, ApJ, 631, 1134 [Google Scholar]
- Andrews, S. M., & Williams, J. P. 2007, ApJ, 671, 1800 [CrossRef] [Google Scholar]
- Andrews, S. M., Wilner, D. J., Espaillat, C., et al. 2011, ApJ, 732, 42 [Google Scholar]
- Andrews, S. M., Huang, J., Pérez, L. M., et al. 2018, The Messenger, 174, 19 [NASA ADS] [Google Scholar]
- Ansdell, M., Williams, J. P., Trapman, L., et al. 2018, ApJ, 859, 21 [NASA ADS] [CrossRef] [Google Scholar]
- Asensio-Torres, R., Henning, T., Cantalloube, F., et al. 2021, A&A, 652, A101 [NASA ADS] [CrossRef] [EDP Sciences] [Google Scholar]
- Avenhaus, H., Quanz, S. P., Garufi, A., et al. 2018, ApJ, 863, 44 [NASA ADS] [CrossRef] [Google Scholar]
- Barrière-Fouchet, L., Gonzalez, J. F., Murray, J. R., Humble, R. J., & Maddison, S. T. 2005, A&A, 443, 185 [NASA ADS] [CrossRef] [EDP Sciences] [Google Scholar]
- Birnstiel, T. 2024, ARA&A, 62, 157 [NASA ADS] [CrossRef] [Google Scholar]
- Birnstiel, T., & Andrews, S. M. 2014, ApJ, 780, 153 [Google Scholar]
- Birnstiel, T., Andrews, S. M., Pinilla, P., & Kama, M. 2015, ApJ, 813, L14 [NASA ADS] [CrossRef] [Google Scholar]
- Birnstiel, T., Dullemond, C. P., Zhu, Z., et al. 2018, ApJ, 869, L45 [CrossRef] [Google Scholar]
- Bouwman, J., Henning, T., Hillenbrand, L. A., et al. 2008, ApJ, 683, 479 [NASA ADS] [CrossRef] [Google Scholar]
- Carpenter, J. M., Wolf, S., Schreyer, K., Launhardt, R., & Henning, T. 2005, AJ, 129, 1049 [Google Scholar]
- Carrasco-González, C., Henning, T., Chandler, C. J., et al. 2016, ApJ, 821, L16 [Google Scholar]
- Cieza, L. A. 2016, in IAU Symposium, 314, Young Stars & Planets Near the Sun, eds. J. H. Kastner, B. Stelzer, & S. A. Metchev, 128 [Google Scholar]
- Cieza, L. A., Swift, J. J., Mathews, G. S., & Williams, J. P. 2008, ApJ, 686, L115 [Google Scholar]
- Cortes, S. R., Meyer, M. R., Carpenter, J. M., et al. 2009, ApJ, 697, 1305 [NASA ADS] [CrossRef] [Google Scholar]
- Dasgupta, A., Cieza, L. A., Gonzalez Ruilova, C. I., et al. 2025, arXiv e-prints [arXiv:2501.15789] [Google Scholar]
- Dickson-Vandervelde, D. A., Wilson, E. C., & Kastner, J. H. 2021, AJ, 161, 87 [NASA ADS] [CrossRef] [Google Scholar]
- Draine, B. T. 2006, ApJ, 636, 1114 [Google Scholar]
- Facchini, S., Birnstiel, T., Bruderer, S., & van Dishoeck, E. F. 2017, A&A, 605, A16 [NASA ADS] [CrossRef] [EDP Sciences] [Google Scholar]
- Facchini, S., van Dishoeck, E. F., Manara, C. F., et al. 2019, A&A, 626, L2 [NASA ADS] [CrossRef] [EDP Sciences] [Google Scholar]
- Flock, M., Ruge, J. P., Dzyurkevich, N., et al. 2015, A&A, 574, A68 [NASA ADS] [CrossRef] [EDP Sciences] [Google Scholar]
- Gaia Collaboration (Vallenari, A., et al.) 2023, A&A, 674, A1 [NASA ADS] [CrossRef] [EDP Sciences] [Google Scholar]
- Garufi, A., Benisty, M., Pinilla, P., et al. 2018, A&A, 620, A94 [NASA ADS] [CrossRef] [EDP Sciences] [Google Scholar]
- Gregorio-Hetem, J., Lepine, J. R. D., Quast, G. R., Torres, C. A. O., & de La Reza, R. 1992, AJ, 103, 549 [NASA ADS] [CrossRef] [Google Scholar]
- Gressel, O., Turner, N. J., Nelson, R. P., & McNally, C. P. 2015, ApJ, 801, 84 [NASA ADS] [CrossRef] [Google Scholar]
- Grimble, W., Kastner, J., Pinte, C., et al. 2024, ApJ, 970, 137 [NASA ADS] [CrossRef] [Google Scholar]
- Guilloteau, S., Dutrey, A., Piétu, V., & Boehler, Y. 2011, A&A, 529, A105 [NASA ADS] [CrossRef] [EDP Sciences] [Google Scholar]
- Hildebrand, R. H. 1983, QJRAS, 24, 267 [NASA ADS] [Google Scholar]
- Hu, X., Zhu, Z., Okuzumi, S., et al. 2019, ApJ, 885, 36 [Google Scholar]
- Huang, J., Andrews, S. M., Dullemond, C. P., et al. 2018, ApJ, 869, L42 [NASA ADS] [CrossRef] [Google Scholar]
- Ingleby, L., Calvet, N., Herczeg, G., et al. 2013, ApJ, 767, 112 [Google Scholar]
- Jennings, J., Booth, R. A., Tazzari, M., Rosotti, G. P., & Clarke, C. J. 2020, MNRAS, 495, 3209 [Google Scholar]
- Kastner, J. H., & Principe, D. A. 2022, in Handbook of X-ray and Gamma-ray Astrophysics, eds. C. Bambi & A. Sangangelo, 49 [Google Scholar]
- Kastner, J. H., Hily-Blant, P., Sacco, G. G., Forveille, T., & Zuckerman, B. 2010, ApJ, 723, L248 [NASA ADS] [CrossRef] [Google Scholar]
- Kuwahara, A., Lambrechts, M., Kurokawa, H., Okuzumi, S., & Tanigawa, T. 2024, A&A, 692, A45 [NASA ADS] [CrossRef] [EDP Sciences] [Google Scholar]
- Long, F., Pinilla, P., Herczeg, G. J., et al. 2018, ApJ, 869, 17 [Google Scholar]
- Mamajek, E. E., Meyer, M. R., & Liebert, J. 2002, AJ, 124, 1670 [Google Scholar]
- McMullin, J. P., Waters, B., Schiebel, D., Young, W., & Golap, K. 2007, in Astronomical Society of the Pacific Conference Series, 376, Astronomical Data Analysis Software and Systems XVI, eds. R. A. Shaw, F. Hill, & D. J. Bell, 127 [NASA ADS] [Google Scholar]
- Murphy, S. J., Lawson, W. A., & Bessell, M. S. 2013, MNRAS, 435, 1325 [Google Scholar]
- Natta, A., & Testi, L. 2004, in Astronomical Society of the Pacific Conference Series, 323, Star Formation in the Interstellar Medium: In Honor of David Hollenbach, eds. D. Johnstone, F. C. Adams, D. N. C. Lin, D. A. Neufeeld, & E. C. Ostriker, 279 [Google Scholar]
- Öberg, K. I., Qi, C., Fogel, J. K. J., et al. 2011, ApJ, 734, 98 [Google Scholar]
- Öberg, K. I., Guzmán, V. V., Walsh, C., et al. 2021, ApJS, 257, 1 [CrossRef] [Google Scholar]
- Okuzumi, S., & Tazaki, R. 2019, ApJ, 878, 132 [Google Scholar]
- Okuzumi, S., Momose, M., Sirono, S.-i., Kobayashi, H., & Tanaka, H. 2016, ApJ, 821, 82 [Google Scholar]
- Pérez, L. M., Chandler, C. J., Isella, A., et al. 2015, ApJ, 813, 41 [CrossRef] [Google Scholar]
- Pinilla, P., Benisty, M., Birnstiel, T., et al. 2014, A&A, 564, A51 [NASA ADS] [CrossRef] [EDP Sciences] [Google Scholar]
- Pinte, C., Teague, R., Flaherty, K., et al. 2023, in Astronomical Society of the Pacific Conference Series, 534, Protostars and Planets VII, eds. S. Inutsuka, Y. Aikawa, T. Muto, K. Tomida, & M. Tamura, 645 [NASA ADS] [Google Scholar]
- Ribas, Á., Espaillat, C. C., Macías, E., et al. 2017, ApJ, 849, 63 [NASA ADS] [CrossRef] [Google Scholar]
- Ribas, Á., Macías, E., Weber, P., et al. 2023, A&A, 673, A77 [NASA ADS] [CrossRef] [EDP Sciences] [Google Scholar]
- Ricci, L., Testi, L., Natta, A., Scholz, A., & de Gregorio-Monsalvo, I. 2012a, ApJ, 761, L20 [Google Scholar]
- Ricci, L., Trotta, F., Testi, L., et al. 2012b, A&A, 540, A6 [NASA ADS] [CrossRef] [EDP Sciences] [Google Scholar]
- Ruge, J. P., Flock, M., Wolf, S., et al. 2016, A&A, 590, A17 [NASA ADS] [CrossRef] [EDP Sciences] [Google Scholar]
- Schütz, O., Meeus, G., & Sterzik, M. F. 2005, A&A, 431, 165 [CrossRef] [EDP Sciences] [Google Scholar]
- Segura-Cox, D. M., Schmiedeke, A., Pineda, J. E., et al. 2020, Nature, 586, 228 [NASA ADS] [CrossRef] [Google Scholar]
- Shi, Y., Long, F., Herczeg, G. J., et al. 2024, ApJ, 966, 59 [Google Scholar]
- Sierra, A., Lizano, S., & Barge, P. 2017, ApJ, 850, 115 [Google Scholar]
- Sierra, A., Lizano, S., Macías, E., et al. 2019, ApJ, 876, 7 [Google Scholar]
- Simon, M., Guilloteau, S., Di Folco, E., et al. 2017, ApJ, 844, 158 [Google Scholar]
- Takahashi, S. Z., & Inutsuka, S.-i. 2014, ApJ, 794, 55 [NASA ADS] [CrossRef] [Google Scholar]
- Tazzari, M., Testi, L., Natta, A., et al. 2021, MNRAS, 506, 5117 [NASA ADS] [CrossRef] [Google Scholar]
- Testi, L., Birnstiel, T., Ricci, L., et al. 2014, in Protostars and Planets VI, eds. H. Beuther, R. S. Klessen, C. P. Dullemond, & T. Henning, 339 [Google Scholar]
- Torres, C. A. O., Quast, G. R., Melo, C. H. F., & Sterzik, M. F. 2008, in Handbook of Star Forming Regions, Volume II, 5, ed. B. Reipurth, 757 [NASA ADS] [Google Scholar]
- Trapman, L., Facchini, S., Hogerheijde, M. R., van Dishoeck, E. F., & Bruderer, S. 2019, A&A, 629, A79 [NASA ADS] [CrossRef] [EDP Sciences] [Google Scholar]
- van der Marel, N., Cazzoletti, P., Pinilla, P., & Garufi, A. 2016, ApJ, 832, 178 [Google Scholar]
- Varga, A., Kastner, J. H., Dickson-Vandervelde, D. A., & Binks, A. 2024, AJ, 168, 251 [NASA ADS] [CrossRef] [Google Scholar]
- Villenave, M., Benisty, M., Dent, W. R. F., et al. 2019, A&A, 624, A7 [NASA ADS] [CrossRef] [EDP Sciences] [Google Scholar]
- Ward, W. R., & Hahn, J. M. 2000, in Protostars and Planets IV, eds. V. Mannings, A. P. Boss, & S. S. Russell, 1135 [Google Scholar]
- Weidenschilling, S. J. 1977, MNRAS, 180, 57 [Google Scholar]
- Weise, P., Launhardt, R., Setiawan, J., & Henning, T. 2010, A&A, 517, A88 [NASA ADS] [CrossRef] [EDP Sciences] [Google Scholar]
- Williams, J. P., & Cieza, L. A. 2011, ARA&A, 49, 67 [Google Scholar]
- Wolff, S. G., Perrin, M., Millar-Blanchaer, M. A., et al. 2016, ApJ, 818, L15 [NASA ADS] [CrossRef] [Google Scholar]
- Zhang, K., Blake, G., & Bergin, E. 2015, in IAU General Assembly, 29, 2256118 [NASA ADS] [Google Scholar]
- Zhu, Z., Stone, J. M., Rafikov, R. R., & Bai, X.-n. 2014, ApJ, 785, 122 [NASA ADS] [CrossRef] [Google Scholar]
- Zurlo, A., Cugno, G., Montesinos, M., et al. 2020, A&A, 633, A119 [NASA ADS] [CrossRef] [EDP Sciences] [Google Scholar]
See ALMA Technical Handbook, Eq. (3.28) and Sect. 7.2.
All Tables
Continuum parameters of the extended configurations in Band 7 and Band 6 used in this study.
All Figures
|
Fig. 1 ALMA Band 7 continuum images of MP Mus at 0.89 mm using the selfcalibrated extended configuration with a robust value of r = -0.5. The synthesized beam size (white ellipse) is shown in the bottom left corner. Left: linear scale; Right: logarihtmic scale. |
| In the text | |
|
Fig. 2 Continuum deprojected radial profiles of MP Mus using selfcalibrated extended configurations for Band 6 (2017.1.01167.S) and Band 7, with robust values of 0.5 and -0.5. Their respective 1σ uncertainties are presented as shades around the solid lines. The faint dotted lines in the bottom part of the figure correspond to 5σ detection limits from the rms, calculated for each dataset and each radial bin. |
| In the text | |
|
Fig. 3 Radial profiles of the continuum for MP Mus using selfcalibrated extended configurations in Band 7 and frank radial profile reconstruction from the visibility of Band 6 (from (Ribas et al. 2023) and Band 7. |
| In the text | |
|
Fig. 4 Continuum radial profiles compared with 12CO radial profiles, with the same label definition as Fig. 2. |
| In the text | |
|
Fig. 5 Top : spectral index maps of MP Mus between 0.89 mm and 1.3 mm, with different Briggs robust values: 0.5, 0.0, and -0.5. Bottom : deprojected α0.89-1.3 mm radial profiles. The horizontal dashed line represents the Rayleigh-Jeans limit (αmm = 2). |
| In the text | |
|
Fig. 6 Radial brightness profile of Band 7 continuum of MP Mus multiplying by r2 to emphasize the feature. A robust value of r = -0.5 was used for this profile. |
| In the text | |
|
Fig. 7 Continuum images of MP Mus. The beam sizes are shown in the lower left corner of each image. Left: Band 6 continuum of MP Mus with r = -0.5 and a beam size of 0.11″ × 0.09″. Right : Band 7 continuum of MP Mus convolved with the beam of Band 6 and r = -0.5. The beam size is 0.13″ × 0.1″. |
| In the text | |
|
Fig. 8 Radial brightness profile of J and H Band from Sphere at scattered light in comparison with the Band 6 continuum with a robust value of r = 0.5. The vertical dashed line corresponds to the coronograph limit. |
| In the text | |
|
Fig. A.1 Moment 0 Map of gas lines detected in Band 6 and Band 7 data. |
| In the text | |
|
Fig. C.1 Radial brightness profile of the continuum emission and absorption lines for MP Mus, combining the extended and compact configurations in band 6. |
| In the text | |
Current usage metrics show cumulative count of Article Views (full-text article views including HTML views, PDF and ePub downloads, according to the available data) and Abstracts Views on Vision4Press platform.
Data correspond to usage on the plateform after 2015. The current usage metrics is available 48-96 hours after online publication and is updated daily on week days.
Initial download of the metrics may take a while.