Fig. 7
Download original image
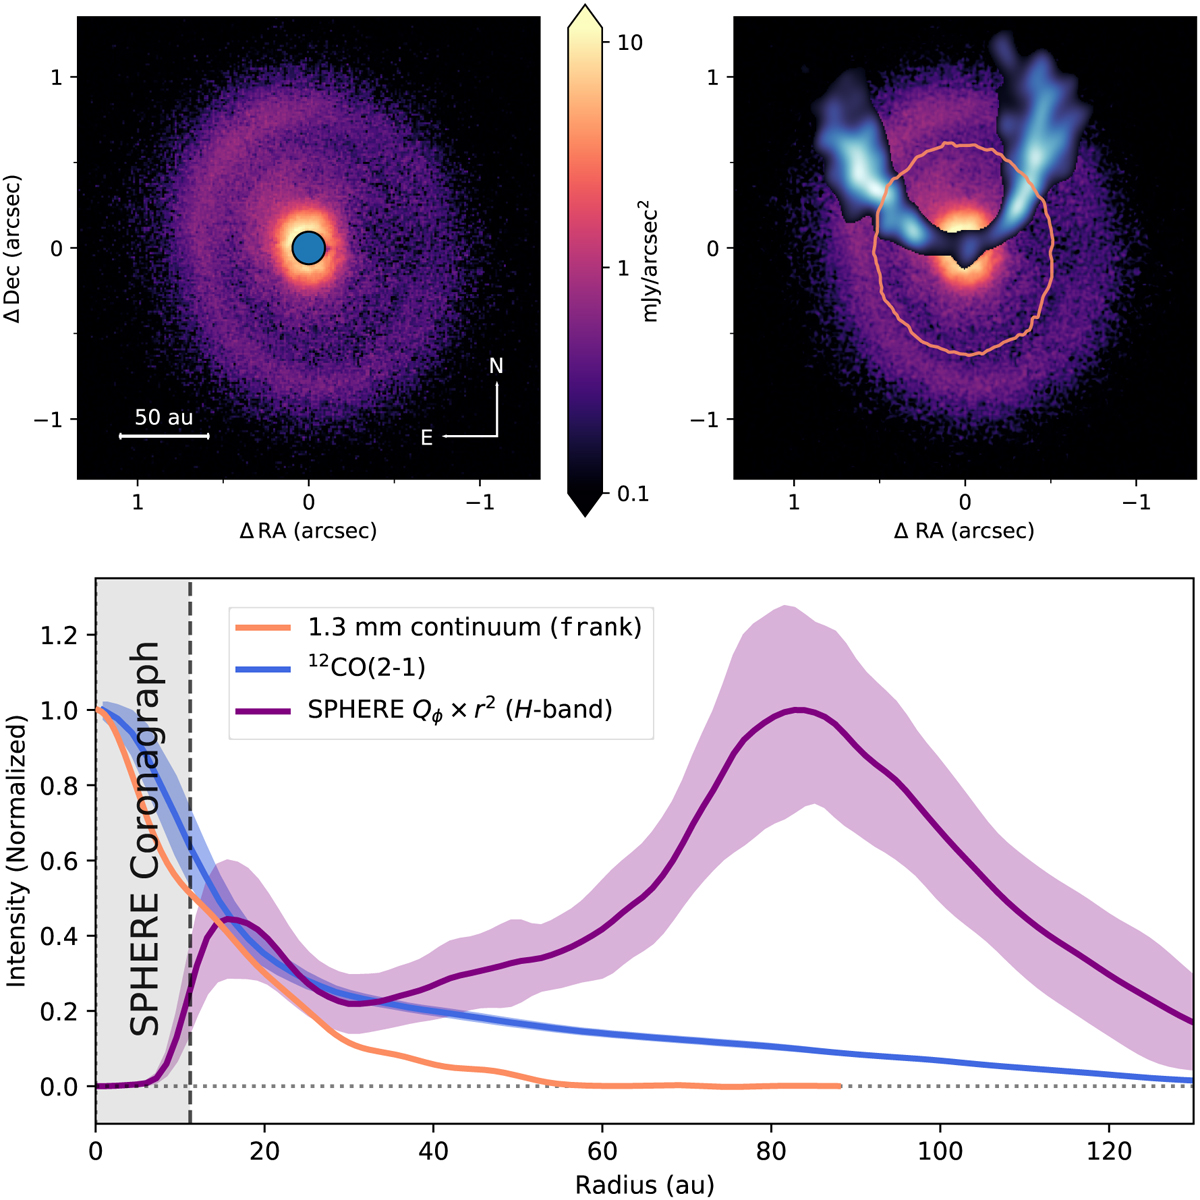
Comparison of ALMA and SPHERE observations of MP Mus. Top left: Qϕ-image in H-band (λobs = 1.6 µm) taken with SPHERE/IRDIS. The colormap is shown in logarithmic stretch. The central blue circle masks the area covered by the coronagraph of the observation. Top right: comparison of the 1.3 mm continuum emission (orange contour), the SPHERE Qϕ H-band data (purple), and one of the 12CO (2−1) channels (blue). The 1.3 mm contour corresponds to the 5 RMS level, while only data above the corresponding 3 RMS levels are shown for the 12CO (2−1) and scattered light observations. Bottom: comparison of the radial profiles of the SPHERE Qϕ × r2 in H-band (purple line), the 1.3 mm continuum (orange line), and the 12CO (2−1) emission (blue line). The SPHERE coronagraph is also shown.
Current usage metrics show cumulative count of Article Views (full-text article views including HTML views, PDF and ePub downloads, according to the available data) and Abstracts Views on Vision4Press platform.
Data correspond to usage on the plateform after 2015. The current usage metrics is available 48-96 hours after online publication and is updated daily on week days.
Initial download of the metrics may take a while.