Fig. 4
Download original image
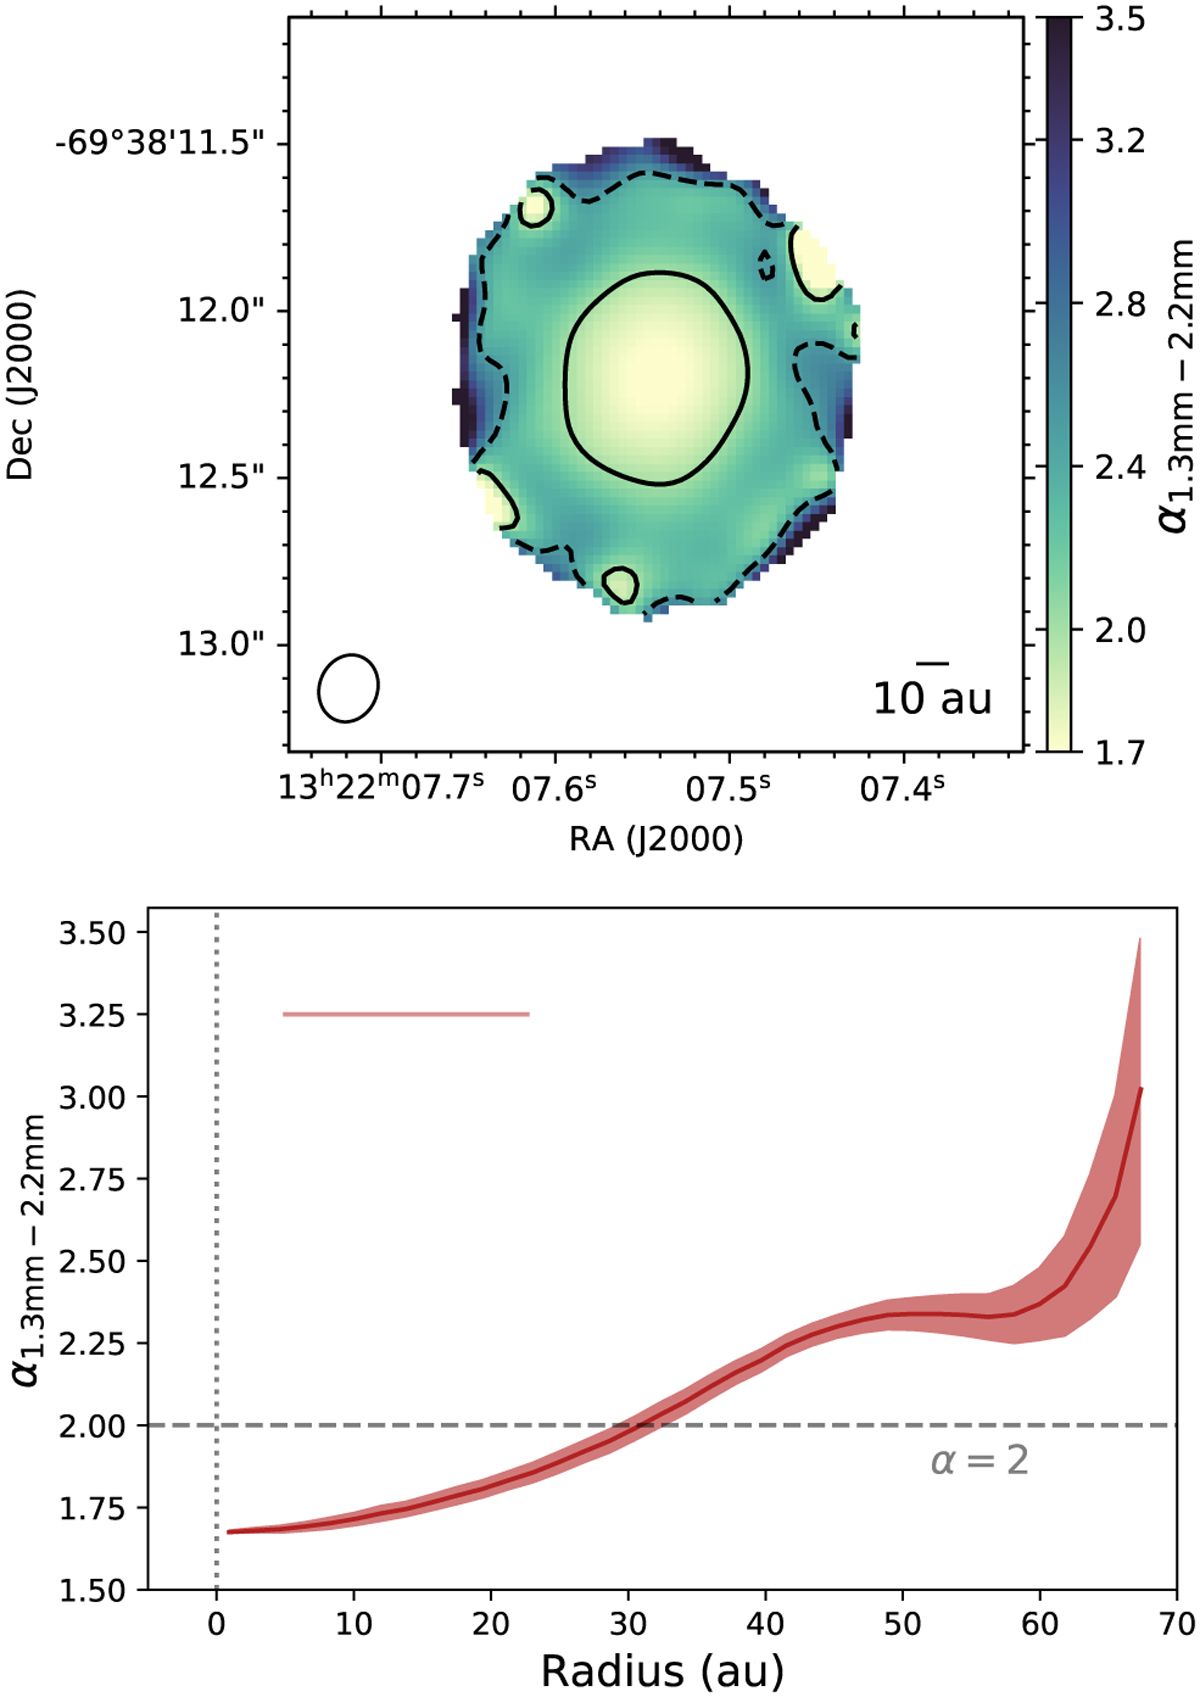
Derived millimeter spectral index for MP Mus between 1.3 and 2.2 mm. Top: spectral index map. Only pixels with S/N > 5 are considered. The solid and dashed contours correspond to α1.3−2.2 mm of 2 and 2.5, respectively. The image beam is shown on the bottom left corner. Bottom: corresponding de-projected α1.3−2.2 mm radial profile and uncertainties (solid red line and area). The beam FWHM is shown as a horizontal red line. The dashed line marks the α = 2 transition.
Current usage metrics show cumulative count of Article Views (full-text article views including HTML views, PDF and ePub downloads, according to the available data) and Abstracts Views on Vision4Press platform.
Data correspond to usage on the plateform after 2015. The current usage metrics is available 48-96 hours after online publication and is updated daily on week days.
Initial download of the metrics may take a while.