| Issue |
A&A
Volume 669, January 2023
|
|
|---|---|---|
| Article Number | A11 | |
| Number of page(s) | 21 | |
| Section | Extragalactic astronomy | |
| DOI | https://doi.org/10.1051/0004-6361/202244796 | |
| Published online | 20 December 2022 | |
Star-forming early-type galaxies and quiescent late-type galaxies in the local Universe
1
National Observatory of Athens, Institute for Astronomy, Astrophysics, Space Applications and Remote Sensing, Ioannou Metaxa and Vasileos Pavlou, 15236 Athens, Greece
e-mail: This email address is being protected from spambots. You need JavaScript enabled to view it.
2
Department of Astrophysics, Astronomy & Mechanics, School of Physics, Aristotle University of Thessaloniki, 54124 Thessaloniki, Greece
3
Sterrenkundig Observatorium, Universiteit Gent, Krijgslaan 281 S9, 9000 Gent, Belgium
4
INAF – Osservatorio Astrofisico di Arcetri, Largo E. Fermi 5, 50125 Florence, Italy
5
Instituto de Fisica de Cantabria (CSIC-Universidad de Cantabria), Avenida de los Castros, 39005 Santander, Spain
6
Cosmic Dawn Center (DAWN), Jagtvej 128, 2200 Copenhagen N, Denmark
7
DTU-Space, Technical University of Denmark, Elektrovej 327, 2800 Kgs. Lyngby, Denmark
8
Niels Bohr Institute, University of Copenhagen, Blegdamsvej 17, 2100 Copenhagen Ø, Denmark
Received:
23
August
2022
Accepted:
27
September
2022
Abstract
Aims. The general consensus is that late-type galaxies undergo intense star-formation, activity while early-type galaxies are mostly inactive. We question this general rule and investigate the existence of star-forming early-type and quiescent late-type galaxies in the local Universe. By computing the physical properties of these galaxies and by using information on their structural properties as well as the density of their local environment, we seek to understand the differences from their ‘typical’ counterparts.
Methods. We made use of the multi-wavelength photometric data (from the ultraviolet to the sub-millimetre), for 2209 morphologically classified galaxies in the Galaxy And Mass Assembly survey. Furthermore, we separated the galaxies into subsets of star-forming and quiescent based on their dominant ionising process, making use of established criteria based on the WHα width and the [NII/Hα] ratio. Taking advantage of the spectral energy distribution fitting code CIGALE, we derived galaxy properties, such as the stellar mass, dust mass, and star-formation rate, and we also estimated the unattenuated and the dust-absorbed stellar emission, for both the young (≤200 Myr) and old (> 200 Myr) stellar populations.
Results. We find that about 47% of E/S0 galaxies in our sample show ongoing star-formation activity and 8% of late-type galaxies are quiescent. The star-forming elliptical galaxies, together with the little blue spheroids, constitute a population that follows the star-forming main sequence of spiral galaxies very well. The fraction of the luminosity originating from young stars in the star-forming early-type galaxies is quite substantial (∼25%) and similar to that of the star-forming late-type galaxies. The stellar luminosity absorbed by the dust (and used to heat the dust grains) is highest in star-forming E/S0 galaxies (an average of 35%) followed by star-forming Sa-Scd galaxies (27%) with this fraction becoming significantly smaller for their quiescent analogues (6% and 16%, for E/S0 and Sa-Scd, respectively). Star-forming and quiescent E/S0 galaxies donate quite different fractions of their young stellar luminosities to heat up the dust grains (74% and 36%, respectively), while these fractions are very similar for star-forming and quiescent Sa-Scd galaxies (59% and 60%, respectively). Investigating possible differences between star-forming and quiescent galaxies, we find that the intrinsic (unattenuated) shape of the SED of the star-forming galaxies is, on average, very similar for all morphological types. Concerning their structural parameters, quiescent galaxies tend to show larger values of the r-band Sérsic index and larger effective radii (compared to star-forming galaxies). Finally, we find that star-forming galaxies preferably reside in lower density environments compared to the quiescent ones, which exhibit a higher percentage of sources being members of groups.
Key words: galaxies: evolution / galaxies: ISM / galaxies: interactions / dust, extinction / galaxies: star formation / galaxies: stellar content
© E.-D. Paspaliaris et al. 2022
 Open Access article, published by EDP Sciences, under the terms of the Creative Commons Attribution License (https://creativecommons.org/licenses/by/4.0), which permits unrestricted use, distribution, and reproduction in any medium, provided the original work is properly cited.
This article is published in open access under the Subscribe-to-Open model. This email address is being protected from spambots. You need JavaScript enabled to view it. to support open access publication.
1. Introduction
There is a general perception that the star-forming activity in galaxies is strongly correlated to their morphological type. Gas-poor elliptical (E), lenticular (S0), and dwarf galaxies form stars at rates significantly lower than ∼1 M⊙ yr−1, while gas-rich spirals and irregulars (Irr) have star-formation rates (SFRs) that can reach up to ∼20 M⊙ yr−1 (Kennicutt 1983; Gao & Solomon 2004; Calvi et al. 2018; Nersesian et al. 2019). Much higher SFRs, exceeding several hundreds of M⊙ yr−1, can be found in local starburst galaxies and (ultra-) luminous infrared galaxies (U/LIRGs) (da Cunha et al. 2010; Combes et al. 2013; Kennicutt & De Los Reyes 2021; Paspaliaris et al. 2021).
E galaxies are considered to be amongst the most massive, old, and red systems (Bernardi et al. 2003; Kelvin et al. 2014a; González Delgado et al. 2015; Nersesian et al. 2019). It is believed that they formed either by the collapse of protogalaxies, with a prominent early burst of star formation and then passive evolution (monolithic view; Partridge & Peebles 1967; Larson 1975) or by merging galaxies with an unclear evolutionary path following (hierarchical view; Toomre & Toomre 1972), leading to the quiescent (Q) systems we observe today. In most cases, their stellar content is highly concentrated in the centre with its density decreasing towards the outskirts of the galaxy. The interstellar medium (ISM; if any) is mostly concentrated in the galaxy centre. Conversely, late-type spiral galaxies are mostly bluer, actively star-forming systems, with a central bulge consisting mainly of old stars, with ongoing star-formation activity occurring in the dusty spiral arms. Furthermore, the existence of a bar can lead to the funnelling of gas towards the galactic centre playing a significant role in the evolution of the properties of the host galaxy (e.g. Sorensen et al. 1976; Athanassoula et al. 2013, and references therein). A hybrid-like case also exists consisting of a blue, low-mass, compact spheroidal population often referred to as little blue spheroids (LBSs). This population of galaxies are structurally similar to their higher mass elliptical galaxy analogues, but with the scaling relations of their physical properties, such as SFR, stellar mass (Mstar), and bolometric luminosity resembling star-forming (SF) spiral galaxies (Mahajan et al. 2015, 2018). Moreover, they lie outside the standard Hubble parametrisation range (T; Makarov et al. 2014), which is defined to include galaxies with Hubble stage from T = −5 (pure ellipticals) to T = 10 (irregulars).
Although the trend in the average SFRs with the morphology is strong, SFRs of galaxies of the same type may exhibit a dispersion of 1 dex (Kennicutt 1998). Additionally, a bimodal distribution has been found for the SFR of galaxies (e.g. Wetzel et al. 2012; Trussler et al. 2020; Kalinova et al. 2021; Sampaio et al. 2022). Combining two fundamental galaxy properties, the SFR and Mstar, we can quarry information about their current rate of conversion of gas into stars. In the case of SF galaxies, the two parameters are found to be tightly correlated, occupying a distinct region in the SFR–Mstar diagram, often referred to as the star-forming main sequence (SFMS) of galaxies (e.g. Noeske et al. 2007; Elbaz et al. 2007; Wuyts et al. 2011; Whitaker et al. 2012, and references therein) or ‘the blue cloud’. On the contrary, Q galaxies exhibit a weaker relation between SFR and Mstar, occupying the area below the SFMS, forming the ‘red cloud’. The blue cloud consists mainly of late-type galaxies (Sa-Irr; hereafter LTGs), while the red cloud is mostly occupied by early-type galaxies (E and S0; hereafter ETGs1). This bimodality has been thoroughly investigated in previous studies, such as Strateva et al. (2001), Blanton et al. (2003), Baldry et al. (2004), and Taylor et al. (2015). However, several studies have reported the existence of ETGs with ongoing star formation and also of LTGs with star-forming activity that has ceased (e.g. Rowlands et al. 2012; Vulcani et al. 2015; Bitsakis et al. 2019; Cano-Díaz et al. 2019).
It has been shown that the rate that galaxies form stars can be strongly influenced by the environment they reside in (e.g. Barsanti et al. 2018; Davies et al. 2019; Sampaio et al. 2022). When spiral galaxies traverse the dense inter-cluster medium, their interstellar gas is removed through ram-pressure stripping, and they lose their ability to form new stars (e.g. Gunn & Gott 1972; Dressler 1980). In this manner, groups and clusters mainly consist of elliptical and gas-poor galaxies that have different properties from their counterparts settled in less dense environments (e.g. Baldry et al. 2006; Skibba & Sheth 2009). Other proposed mechanisms through which galaxies may lose their ability to form new stars or even perturb their morphology are strangulation (Larson et al. 1980; Kauffmann et al. 1993; Diaferio et al. 2001), harassment (Moore et al. 1996), and minor mergers of tidal interactions (Park et al. 2008). McIntosh et al. (2014) and Haines et al. (2015) suggested that SF Es have suffered a recent morphological transition without having enough time to exhaust their gas reservoir, being in a post-starburst phase. Alternatively, Es in low-density environments may be rejuvenated by eventually accreting cold gas as suggested by Thomas et al. (2010).
Spectral energy distribution (SED) modelling techniques allow us to decompose the SED of galaxies and to derive useful information about their different emitting components. These techniques usually combine the stellar emission (originating from both old and young stars) in ultraviolet (UV), optical, and near-infrared (NIR) wavelengths with the dust infrared (IR) emission so that the energy budget is fully conserved. In addition, a star-formation activity through cosmic time (i.e. the star-formation history; SFH) is assumed, allowing for the determination of the current SFR but also the buildup of the current stellar mass of the galaxy. Having set a grid of input parameters, the SED fitting codes can then retrieve the best set of templates that better reproduce the observations and thus provide useful information about physical properties of the galaxies, such as the current SFR, stellar and dust masses, as well as luminosities of the different components of the stellar populations and the dust.
In this work, we performed SED modelling of 2209 local (z < 0.06) galaxies in the Galaxy And Mass Assembly (GAMA) survey2 using the CIGALE3 SED fitting code. For all the galaxies there is available morphological classification as well as classification according to their star-forming activity as traced by optical spectral lines (available in the GAMA survey). We examined all morphological types separately, but we mainly focused on SF ETGs and Q LTGs. These subsets constitute obvious exceptions to the general rule, with ETGs being mostly quenched and LTGs actively forming new stars in their majority. The scope of this study is to explore the physical and structural parameters that differentiate them from their ‘typical’ counterparts. In Sect. 2, we present the sample properties and classifications, as well as a description of the SED fitting method used. In Sect. 3, we present the typical SEDs as a function of morphology and star-forming activity, as well as the physical properties of the SF ETGs and Q LTGs. The different stellar populations in different types of galaxies as well as their role in the heating of the dust are discussed in Sect. 4. A discussion follows in Sect. 5 describing the basic differences that we find between SF and Q galaxies, while our findings are summarised in Sect. 6. A comparison with the results provided in the GAMA survey obtained by the SED fitting code MAGPHYS is presented in Appendix A. Throughout the paper, we adopt H0 = 70 km s−1 Mpc−1, Ωm = 0.3, ΩΛ = 0.7, and a Salpeter (1955) initial mass function (IMF).
2. Data and analysis
2.1. Sample selection
The multi-wavelength data used in this work are provided by the Panchromatic Data Release (from FUV to FIR; Driver et al. 2016) of the GAMA survey (Driver et al. 2009, 2011). For each source, observations are available for up to 21 different broad-band filters from five observatories. All the filters provided by the GAMA survey and used in the current analysis are listed in Table 1 (see also Table 1 in Wright et al. 2016). The fluxes of the galaxies in the different bands were calculated using the Lambda Adaptive Multi-Band Deblending Algorithm in R (LAMBDAR4; Wright et al. 2016). LAMBDAR performs deblended aperture-matched photometry without requiring PSF or pixel matched images. Four major processes are employed, aperture convolution, aperture deblending, sky subtraction, and aperture correction, accounting for the different PSFs. Hence, the algorithm avoids the necessity of the seeing and imaging being matched, and in contrast to other algorithms the images do not need to be smoothed to the resolution of the lowest quality band. Fluxes in the FUV-K wavelength range were also corrected for Galactic extinction.
List of the 21 broad-band filters provided by the GAMA database and used in the current SED fitting analysis.
From the full sample of the GAMA survey, we selected a sub-sample of galaxies in the GAMA II equatorial survey regions. All galaxies in this sub-sample have been visually classified according to their Hubble type using UKIDSS H and SDSS i- and g-band images as described in detail in Kelvin et al. (2014b) and Moffett et al. (2016). The classification was held in two phases. In the first phase, logarithmically scaled (in brightness) 20″ × 20″ images were used, while in the second phase 40″ × 40″ images scaled with the arctan function (in brightness) were visually inspected. The arctan function was chosen as a more effective method against manually defined upper or lower brightness levels, which potentially lead to the misclassification of galaxies. A decision tree with three levels of classification options was followed by three independent pairs of observers. In the first level, the observers had to divide the sample by type: spheroid-dominated, disc-dominated, LBS, or stars (in the case that a foreground star is in front of the primary object or a supernova exists within a galaxy, the primary object is classified as a star and is subsequently rejected). The options at the other two classification levels were single- or multi-component and barred or unbarred. The final classification was determined by the majority opinion. This classification has been used in various studies, such as Kelvin et al. (2014a, 2018), Agius et al. (2013), Moffett et al. (2019), Mahajan et al. (2020), and Bellstedt et al. (2020).
This volume- and luminosity-limited sample is referred to as GAMAnear and consists of 6433 galaxies in the 0.002 < z < 0.06 redshift range and an extinction-corrected r-band SDSS Petrosian magnitude of r < 19.8 mag. For the z < 0.02 galaxies, the flow-corrected redshifts (using the Tonry et al. 2000 flow model) were used (see Baldry et al. 2012). After applying two additional selection criteria that all galaxies are observed by the Herschel Space Observatory (HSO; Pilbratt et al. 2010) and have available optical spectroscopic information (with the available optical lines detected at S/N > 3), we were left with 2597 galaxies. The selection of HSO-observed sources allowed us to accurately compute the dust mass, while the availability of optical spectroscopic indices provided information on the star formation and nuclear activity for each galaxy. Further structural measurements, such as the effective radius (Re) and Sérsic index for all the galaxies in our sample were provided by Kelvin et al. (2012), while information concerning the density of the local environment for 1221 galaxies is given in Robotham et al. (2011).
Examples of different Hubble-type galaxies with different star-forming activity (according to optical emission lines; see Sect. 2.2) are shown in Fig. 1. It is worth noting that even a visual inspection reveals a strong difference in the appearance of these galaxies with Q galaxies (top panels) showing redder colours compared to their bluer SF counterparts (bottom panels). After applying the aforementioned criteria, but also excluding galaxies with possible contamination from active galactic nucleus (AGN) activity (see Sect. 2.2), the final sample consists of 269 E, 251 S0-Sa, 659 Sab-Scd, 704 Sd-Irr galaxies, and 326 LBS. For the purposes of the current study, we precisely classified the S0-Sa sources into two different groups (S0 and Sa). This classification was conducted by three of the authors of this study by inspecting images using the GAMA Single Object Viewer and the SDSS SkyServer. Sources exhibiting spiral arms were classified as Sa, while the rest were considered S0 galaxies. The observers independently classified the 251 sources, and the final classification was assigned by majority agreement, resulting in 224 S0 and 27 Sa galaxies (see Table 2).
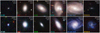 |
Fig. 1. Typical GAMA galaxies with different morphologies (LBS, E, S0, Sa, Sab-Scd, Sd-Irr; from left to right) and different star-forming activity according to their dominant ionisation process (Q, SF; top and bottom, respectively). A composite g-, i-, H-band image is shown for each galaxy in a frame of 30 kpc × 30 kpc. The GAMA catalogue identification number and the redshift of each galaxy are indicated in the top right of each panel. |
Numbers of galaxies in different morphology bins and star-formation activity.
As a reference sample for the very local galaxies, we used the dataset of the DustPedia project5. DustPedia includes FUV to sub-millimetre data of 875 nearby galaxies (DL < 40 Mpc), all observed by HSO. The Hubble stage T is available as a morphology indicator for the full sample. For more information about the DustPedia project, we refer the reader to Davies et al. (2019) and Clark et al. (2018). For 814 galaxies, Nersesian et al. (2019) performed SED fitting analysis, in exactly the same way described in this work (see Sect. 2.3), delivering their physical properties.
2.2. Classification by ionisation processes and star-forming activity
Since GAMA is not only a photometric but also a spectroscopic survey (Driver et al. 2009; Hopkins et al. 2013a; Gordon et al. 2017), we are able to classify the galaxies in our sample not only by their morphological characteristics, but also by their dominant ionisation processes. Emission line diagnostic diagrams (e.g. Baldwin et al. 1981; Kauffmann et al. 2003; Kewley et al. 2006) are widely used to probe the ionisation sources in galaxies (e.g. star-formation, AGNs, emission by evolved stellar populations). For such a categorisation in this study, we made use of the available measurements of the Hα line width (WHα) and the flux ratio of [NII]/Hα. These quantities are physically independent, with WHα being a measure of the ionising photons absorbed by the gas, relative to the stellar mass, while [NII]/Hα is a measure of the dependency of the ionisation state and the gas temperature on the nitrogen gas abundance. The topology of these quantities define areas of low and high ionisation as well as of star-forming and quiescence stages, and it is widely known as the WHAN diagram (Cid Fernandes et al. 2010, 2011). In contrast to other similar classification schemes, the WHAN diagram requires only two emission lines (Hα and [NII]λ6584), which, in fact, are two of the most prominent and easy to measure lines in the optical spectra of galaxies. This permits us to maximise the number of sources in the original sample with sufficient spectroscopic data and, thus, to infer the relevant information. The emission lines in the optical spectra of the GAMA sources were fitted using GANDALF (Sarzi et al. 2006) and a diffuse (stellar continuum) obscuration correction, caused by diffuse dust in the galaxy, was applied using a Calzetti (2001) obscuration curve (see Hopkins et al. 2013a for a detailed description of the GAMA spectroscopic analysis).
We present our physically motivated classification scheme in a WHAN diagram in Fig. 2. Within the WHAN diagram, we define four classes of galaxies: Q, SF, strong AGN (sAGN), and weak AGN (wAGN). log WHα = 0.48 splits our sample into lineless Q galaxies (with log WHα < 0.48) from emission line galaxies (ELGs; with log WHα ≥ 0.48). In the area of ELGs, the vertical line at log[NII]/Hα = −0.4 distinguishes the sources where star formation is responsible for the ionising photon output from those that their spectrum can only be explained by a harder ionising field originating from an AGN. Sources with log WHα ≥ 0.48 and log[NII]/Hα < −0.4 are classified as pure SF galaxies. The AGN locus consists of two areas; sAGN occupy the area where log WHα ≥ 0.78 and log[NII]/Hα > −0.4, while wAGN are the ones with 0.48 ≤ log WHα ≤ 0.78 and log[NII]/Hα ≥ −0.4. For the purposes of this work, we did not consider AGNs, so, sources in the sAGN and wAGN regions of this diagram are excluded from the sample of 2597, leaving us with 2209 galaxies. We caution the reader that out of these galaxies, two sub-classes, Q LBS and Q Sd-Irr are underrepresented (3 and 12 galaxies, respectively), so they were not fully considered in the subsequent statistical analysis.
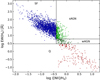 |
Fig. 2. WHAN diagram for the classification of the galaxies due to their dominant ionisation processes. Demarcation lines are from Cid Fernandes et al. (2011), for star-forming and quiescent galaxies (blue and red circles, respectively) and strong and weak AGNs (light and dark green circles, respectively). |
Another way to separate SF and Q galaxies in the local universe, often adopted in the literature (e.g. Brinchmann et al. 2004; Fontanot et al. 2009; Donnari et al. 2019; Florez et al. 2020), includes setting a threshold of the specific star-formation rate (sSFR) of 10−11 yr−1. Galaxies with sSFR above this value are defined as SF, while the ones below are Q. Although this method is more empirical and it may depend on the manner that stellar mass and SFR are calculated, it agrees well with the first method. The number of Q and SF galaxies predicted by the two methods are presented in Table 2, where a direct comparison can be made.
2.3. SED modelling
In this study, we used the CIGALE SED fitting code (see Boquien et al. 2019, and references therein) to model the SEDs of the galaxies in our sample. Having defined a grid of values for the parameters of the various modules for the stellar, gas, and dust emission and taking into account the dust attenuation, we used multi-wavelength observations, of each galaxy, to compare with the library of model SEDs created by CIGALE. CIGALE includes all the different components in such a way that the amount of energy absorbed and re-emitted by the dust grains is fully conserved (Noll et al. 2009; Roehlly et al. 2014). In the final phase of this process, the real observations and the SED libraries created by CIGALE are compared using a Bayesian approach and global properties such as the Mstar, the dust mass (Mdust), the SFR, the minimum intensity (Umin) of the Inter-Stellar Radiation Field (ISRF), as well as the different emitting components [old/young stellar population, diffuse/photodissociation regions (PDR) dust emission] are derived.
Since we aim to compare the properties of the galaxies in this sample with the very local galaxies, and for consistency purposes, we adopt the parameter space used in the reference DustPedia sample, introduced by Nersesian et al. (2019). In this study, a flexible SFH is used, allowing for a late instantaneous burst or quenching (i.e. module ‘sfhdelayedbq’; Ciesla et al. 2015), while the Bruzual & Charlot (2003) stellar population model of solar metallicity, along with the Salpeter (1955) IMF, build the stellar components. Two stellar populations are considered: one old (> 200 Myr) and one young (≤200 Myr). The emission from the stellar components as well as from the ionised gas surrounding massive stars (i.e. nebular emission) are attenuated using a power-law-modified starburst attenuation curve (i.e. module ‘dustatt_calzleit’; Calzetti et al. 2000), while the THEMIS dust model (Jones et al. 2017) accounts for the dust emission parameters. The number of free parameters used in the current analysis is ten, while a total of 320 166 000 models were produced. The parameter grid used in the current work can be found in Table 1 in Nersesian et al. (2019). For validation purposes, the CIGALE-derived physical properties are compared with the corresponding estimations using the MAGPHYS fitting code in Appendix A.
3. SEDs and physical properties
3.1. Template SEDs
Galaxies of different morphologies have different stellar and dust content, which are usually distributed within the galaxies in very different ways. These differences are expected to be detectable in their energy output, making their SEDs a unique signature of their morphologies (see Ciesla et al. 2014; Bianchi et al. 2018; Nersesian et al. 2019, and references therein). Taking advantage of the numerous galaxies in the GAMA sample and the relatively wide redshift range of a local galaxy sample (up to redshift 0.06), in Fig. 3 we present the median SEDs for the four morphological bins (Sd-Irr, Sa-Scd, E/S0, LBS; top to bottom), separated in subsets according to their major ionising process (SF and Q).
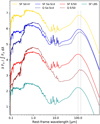 |
Fig. 3. Median template SEDs for different morphological classes shifted arbitrarily for clarity. Solid curves represent the median SEDs of SF galaxies, while dashed SEDs stand for their Q counterparts. The two vertical lines (solid and dashed) approximately connect the dust emission peaks in the SEDs of the SF and Q galaxies, respectively. |
After normalising the best fitted (by CIGALE) SED of each galaxy to its bolometric luminosity, we calculated a median SED per morphological bin and per star-forming activity by computing the median specific flux density per wavelength bin. A visual inspection of the shape of the SEDs in Fig. 3 already provides qualitative information about the stellar populations and dust content as well as the star-forming activity for each galaxy type. As stated earlier, since Sd-Irr and LBSs lack Q-type galaxies, we do not present the respective SEDs.
The first obvious thing is that the SF galaxies show enhanced dust emission compared to their Q counterparts of the same bolometric luminosity. The measured flux difference at 100 μm between SF and Q is high in E/S0s (1.1 dex) with lower difference observed in Sa-Scd types (0.21 dex). This indicates that the dust emission may be a clear signature of star-forming activity in some classes of galaxies (E/S0s) but not an obvious one for others (Sa-Scds) where both, SF and Q, types show similar dust SEDs. The stellar emission of the SF galaxies, on the other hand, is always less in the NIR and most of the optical (> 0.4 μm) wavelengths compared to Q galaxies of the same bolometric luminosity; however, it increases again below ∼0.4 μm. The peak of the stellar emission also shows clear differences between SF and Q galaxies of the same bolometric luminosities, with SF galaxies being fainter at 1 μm by 0.21 and 0.30 dex for Sa-Scd, and E/S0s, respectively. This effect is to be expected given the higher dust content observed in SF galaxies.
Another thing that is also obvious is that SF galaxies contain warmer dust compared to the Q galaxies of the same morphological type. This is shown with the peak of the dust emission in the SF galaxies always being to the left of the corresponding peak of the Q galaxies (see the two vertical lines).
3.2. Galaxy morphology in the SFR–Mstar diagram
Despite the slightly different slopes and the scatter around the SFMS found in different studies, mainly depending on the methods used for estimating the SFR as well as the differences in the samples used (Katsianis et al. 2020, and references therein), Q systems always lie below the SFMS, thus forming a separate distribution.
In Fig. 4, we present the SFR–Mstar diagram for the galaxies in our sample of different morphological types and star-forming activity. Independently of the two methods used to classify the galaxies in SF and Q (see Sect. 2.2), it is obvious that different morphological types have different fractions of SF and Q galaxies, with the separation between the two populations being more prominent in the earlier type galaxies (E/S0; top right panel). As mentioned earlier (Table 2), Q LBS, and Q Sd-Irr galaxies are only a very small fraction of sources and thus are not represented in this analysis. On the other hand, more than 92% of Sa-Scd are SF. The fact that the fraction of Q sources in later-type galaxies is low has also been reported in previous studies (e.g. Goto et al. 2003; Moran et al. 2006; Wolf et al. 2009; Masters et al. 2010; Fraser-McKelvie et al. 2016, and references therein). Numerical simulations have shown that, in some cases, spiral galaxies are able to maintain their spiral arm structure even many gigayears after a dramatic decrease of their star formation (Bekki et al. 2002). In a volume-limited sample of 5433 spiral galaxies from the Galaxy Zoo (GZ1) clean catalogue (Lintott et al. 2008) selected from the SDSS Data Release 6 (with redshift 0.03 < z < 0.085), Masters et al. (2010) characterised 4−8% of them as ‘red’ spirals. These galaxies were found to be dominated by old stellar populations, while their SFR is lower compared to the main population of the same morphology bin. In a more recent study by Shimakawa et al. (2022) investigating a sample of 1100 spiral galaxies with 0.01 < z < 0.3 from the Hyper Suprime-Cam Subaru Strategic Program (HSC SSP; Aihara et al. 2018) found that 5% are passive, with identical characteristics (in stellar populations) to the typical Q galaxies, despite the different morphologies. These results are in quite good agreement with the corresponding Q late-type population (8%) of the LTGs we find in the GAMA sample (see bottom left panel of Fig. 4). The SFR of these galaxies is found to be, in most cases, systematically lower than their SF counterparts of the same stellar mass bin. After visual inspection, as can be seen in Fig. 1, these galaxies are spirals with a redder view and smoother spiral arms, in agreement with the findings by Shimakawa et al. (2022). Goto et al. (2003) refers to the red spirals as a population in transition between red E/S0 galaxies in low-redshift clusters and blue spirals frequent in higher redshift clusters.
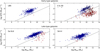 |
Fig. 4. SFR versus Mstar diagram for the sub-samples separated by morphological classification. Early-type galaxies are plotted in the top panels, while late-type galaxies are plotted in the bottom panels. The colouring is the same as in Fig. 2. In the top right panel, Es are represented by circles, while stars show the S0 sources. The sSFR = 10−11 yr−1 line is also indicated, separating the galaxies in SF and Q in quite good agreement with the classification by the WHAN diagram. |
The Q galaxy population is more numerous in earlier type galaxies. However, although SF galaxies are traditionally considered to be mainly spirals and irregulars, we also observe a non-negligible population of lenticulars and ellipticals that are also SF; a typical E with ongoing star formation is presented in Fig. 1. About 43% (45% according to their sSFR) of the S0 galaxies are SF, while this fraction is 50% (48% according to sSFR) for Es. If we take into account the LBS galaxies as well, the vast majority of which are SF, we find a large population (68%) of galaxies with elliptical or spheroidal morphology in the area of active star formation. Previous studies, such as Fukugita et al. (2004), Schawinski et al. (2009), and Rowlands et al. (2012) have found EWs(Hα) of ETGs that correspond to SF galaxies. Bitsakis et al. (2019) and Cano-Díaz et al. (2019) find 18.5% and 28% of the ETGs to be actively star forming, respectively. Although these fractions are lower than the one found in our work, given that Bitsakis et al. (2019) used a slightly more stringent criterion to define their Q sources (log sSFR < −11.5 yr−1), their target selection criteria led to a lack of lower mass galaxies (108 − 1010 M⊙). Similarly, Cano-Díaz et al. (2019) used a different criterion: a mix of the BPT (Baldwin et al. 1981) and the WHAN diagram. In morphologically selected samples of E galaxies, Yi et al. (2005), Kaviraj et al. (2007), and Schawinski et al. (2007) concluded that at least 15%−30% of the sources show evidence of recent star-formation activity.
The high fraction of SF ETGs found in our work might be affected by the exclusion, by the WHAN classification, of Q sources with weak emission lines below the S/N = 3 threshold. What is noteworthy is the fact that the SF galaxies of any morphological bin show very similar SFMS. The corresponding scaling relations are discussed in the following paragraph.
3.3. The place of SF early-type and Q late-type galaxies in the local Universe
Previous studies (e.g. Davies et al. 2019; Paspaliaris et al. 2021, and references therein) have shown that the SFMS is mainly occupied by spiral galaxies, with the area below consisting mainly of E galaxies. Galaxies of intermediate Hubble-stages (i.e. S0, Sa) show a wider dispersion occupying both regimes as well as the area between them (often referred to as the green valley). The numerous SF ETGs found in the GAMA sample let us introduce a different perception of this conception.
In Fig. 5, we plot the SFR as a function of the stellar mass (top panel), as well as the dust-to-bolometric luminosity ratio (fabs hereafter; discussed in detail in Bianchi et al. 2018) as a function of the bolometric luminosity (bottom panel) for LTGs. fabs is a quantity that provides an estimate of the amount of radiation that is reprocessed by dust. For comparison, representing the very local Universe, the DustPedia galaxies are overplotted. We note that the linear fits between the corresponding quantities of each subset presented in this paper are estimated using the python UltraNest6 package (Buchner 2021). UltraNest derives the posterior probability distributions and the Bayesian evidence with the nested sampling Monte Carlo algorithm MLFriends (Buchner 2016, 2019). This method is a robust way to estimate the scaling relations of two properties, taking into account the uncertainty of the data in both axes and obtaining the intrinsic scatter of the data and its uncertainties.
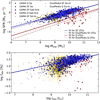 |
Fig. 5. SFR versus Mstar (top panel) and fabs versus Lbol (bottom panel) for the late-type (Sa-Scd and Sd-Irr) galaxies in the GAMA and DustPedia samples. SF Sa-Scd and Sd-Irr galaxies are represented with blue and yellow symbols, respectively, while Q Sa-Scd galaxies (given that Q Sd-Irr are under-represented and are not shown here; see Sect. 2.2) are shown with red symbols. Blue and red stars stand for the GAMA SF and Q Sa galaxies, while Sab-Scd sources are represented by circles. Open symbols show the DustPedia Sa-Irr galaxies. All values are plotted along with their corresponding uncertainties. Solid lines are the linear fits for the GAMA SF and Q galaxies (blue and red, respectively), while the dashed lines are the linear fits for the DustPedia SF and Q galaxies (blue and red, respectively). |
As expected, the vast majority of the Sa-Irr galaxies are distributed along the SFMS (top panel). The SFMS, as determined by the subset of GAMA SF Sa-Irrs, is described by the following linear regression:
![Mathematical equation: $$ \begin{aligned} {\log }(\mathrm{SFR}[M_{\odot }\,\mathrm{yr}^{-1}]) = 0.79^{+0.01}_{-0.01}\,{\log }(M_{\rm star}[M_{\odot }]) - 7.83^{+0.13}_{-0.13} \end{aligned} $$](/articles/aa/full_html/2023/01/aa44796-22/aa44796-22-eq1.gif) (1)
(1)
(blue solid line), and it shows a very strong correlation (Pearson correlation coefficient ρ = 0.8) and with an intrinsic scatter of 0.29 dex. This is very similar to what is found for the local Universe, with the DustPedia relation being
![Mathematical equation: $$ \begin{aligned} {\log }(\mathrm{SFR}[M_{\odot }\,\mathrm{yr}^{-1}]) = 0.84^{+0.02}_{-0.03}\,{\log }(M_{\rm star}[M_{\odot }]) - 8.41^{+0.25}_{-0.21} \end{aligned} $$](/articles/aa/full_html/2023/01/aa44796-22/aa44796-22-eq3.gif)
(dashed blue line; ρ = 0.86), with the corresponding intrinsic scatter in this sub-sample being 0.38 dex. This also comes in agreement with other studies in the local Universe. For instance, Renzini & Peng (2015) defined the SFMS as a straight-line fit with a slope of 0.76±0.01 and an offset of −7.64±0.02 for ∼240 000 SDSS DR7 galaxies (Abazajian et al. 2009), lying at 0.02 < z < 0.085. Similarly, Cano-Díaz et al. (2019) found a slope of 0.79±0.01 for the SF Sbc-Irr subset of their sample and 0.74±0.01 for their full sample of SF z ∼ 0 MaNGa galaxies. In a more recent study, Fraser-McKelvie et al. (2021) found a slope of 0.67 for their 9.0 < log(Mstar[M⊙]) < 10.0, z ∼ 0 galaxies of the SAMI DR3 and MaNGA DR15 GALEX-Sloan-WISE legacy catalogue 2.
Concerning the Q LTGs of the GAMA sample, we find a weaker correlation (ρ = 0.57) of
![Mathematical equation: $$ \begin{aligned} {\log }(\mathrm{SFR}[M_{\odot }\,\mathrm{yr}^{-1}]) = 0.95^{+0.22}_{-0.20}\,{\log }(M_{\rm star}[M_{\odot }]) - 10.59^{+2.30}_{-2.25} \end{aligned} $$](/articles/aa/full_html/2023/01/aa44796-22/aa44796-22-eq5.gif) (2)
(2)
(red solid line), with a scatter of 0.82 dex. Considering the LTGs in the DustPedia sample with sSFR lower than 10−11 yr−1 as Q systems (red open circles), we calculate a relation of
![Mathematical equation: $$ \begin{aligned} {\log }(\mathrm{SFR}[M_{\odot }\,\mathrm{yr}^{-1}]) = 1.03^{+0.07}_{-0.06}\,{\log }(M_{\rm star}[M_{\odot }]) - 11.88^{+0.73}_{-0.61} \end{aligned} $$](/articles/aa/full_html/2023/01/aa44796-22/aa44796-22-eq7.gif)
(red dashed line), with a Pearson correlation coefficient of 0.88 and a scatter of 0.29 dex. Given that the scatter is quite large, the correlations are quite similar, though the GAMA sample shows a shift to higher SFR values. This is probably due to the fact that, using the WHAN diagram as the criterion to distinguish between SF and Q in the GAMA sample, we find some Q galaxies being above sSFR = 10−11 yr−1, resulting in dragging the relation into higher SFR values.
In the fabs − Lbol space (bottom panel), the distribution of the SF LTGs in the GAMA sample is described by the relation
![Mathematical equation: $$ \begin{aligned} {\log }(f_{\rm abs}[\%]) = 0.28^{+0.01}_{-0.01}\,{\log }(L_{\rm bol}[L_{\odot }]) - 1.35^{+0.13}_{-0.13} \end{aligned} $$](/articles/aa/full_html/2023/01/aa44796-22/aa44796-22-eq9.gif) (3)
(3)
(blue solid line), with the intrinsic scatter being 0.14 dex and a correlation coefficient of ρ = 0.60. The corresponding relation for the DustPedia sample is
![Mathematical equation: $$ \begin{aligned} {\log }(f_{\rm abs}[\%]) = 0.29^{+0.01}_{-0.01}\,{\log }(L_{\rm bol}[L_{\odot }]) - 1.45^{+0.14}_{-0.13} \end{aligned} $$](/articles/aa/full_html/2023/01/aa44796-22/aa44796-22-eq11.gif)
(blue dashed line; ρ = 0.74), which, given the scatter of the data (0.17 dex), is in excellent agreement with GAMA. The correlation coefficient (ρ = 0.4) suggests that there is no correlation between fabs and Lbol for the Q LTGs.
In order to further investigate the similarities and differences between Q and SF LTGs, we examined their dust mass content (normalised to their stellar mass) as well as their sSFR. We do so in Fig. 6 with the dust-to-stellar mass ratio distributions presented in the top panel and the sSFR distributions in the bottom panel. From the top panel it is notable that SF Sa-Scd and SF Sd-Irr show similar distributions of dust-to-stellar mass ratio, with the Q Sa-Scd showing a significantly lower ratio. The median values of the distributions are 1.6 × 10⁻³, 1.9 × 10⁻³, and 5 × 10⁻⁴ for the SF Sa-Scd, the SF Sd-Irr, and the Q Sa-Scd, respectively, indicating that the Q Sa-Scd are the most dust-poor types of all LTGs. A similar picture is seen in the bottom panel of Fig. 6 with SF Sa-Scd and SF Sd-Irr showing similar distributions in sSFR, with that of Q Sa-Scd significantly deviating to lower values. Their median values are 1.58−10 yr−1 for SF Sa-Scd and SF Sd-Irr and 10−11 yr−1 for Q Sa-Scd. All the above lead to the conclusion that the Q Sa-Scd have less dust content compared to their SF counterparts, but they are also currently forming new stars at lower rates than the other types. Their stellar content is revisited later in this paper (Sect. 4) where the median SEDs are presented.
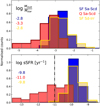 |
Fig. 6. Comparison of the distributions of the CIGALE-derived dust-to-stellar mass ratio (top panel) and sSFR (bottom panel) for the different sub-classes of late-type galaxies. The normalised distributions for the SF Sa-Scd, the Q Sa-Scd galaxies, and the SF Sd-Irr are shown in blue, red, and yellow, respectively. The median value of each parameter, for each population is given in the plot with the corresponding colour. The vertical dash-dotted line indicates the sSFR = 10−11 yr−1 threshold. |
The existence of a bar in galaxies has been suggested as a possible mechanism for galaxy quenching (Kormendy & Kennicutt 2004; Masters et al. 2011; Kruk et al. 2018; Fraser-McKelvie et al. 2020). Additionally, several studies (e.g. Masters et al. 2010; Fraser-McKelvie et al. 2018; Pak et al. 2019) find a high fraction of passive spiral galaxies (up to ∼78%) hosting a bar component, proposing that perturbation from the bar could cause star-formation quenching in these galaxies. In our sample, we find that 12% of the SF and 25% of the Q Sa-Scd galaxies are barred. These results are in quite good agreement with the corresponding results found in Géron et al. (2021), showing that 13% of their SF and 22% of their Q galaxies possess a strong bar. Moreover, as in Géron et al. (2021), we also find that barred spiral galaxies (i.e. SBa-SBcds) have an enhanced SFR compared to their unbarred analogues (0.88 M⊙ yr−1 and 0.63 M⊙ yr−1, respectively), indicating probable rapid evolution of barred galaxies with the bar expediting the ceasing procedure. George et al. (2019) found that 54.3% of barred galaxies in the local Universe are quenched, with this fraction becoming even larger (66.5%) for galaxies with Mstar > 1010.2 M⊙. In our sample, 13.2% of barred galaxies are Q, with this fraction reaching 74.3% for galaxies with Mstar > 1010.2 M⊙. The enhanced bar fraction in Q spirals could be a possible indication that bars (or their creation mechanisms) are, at some level, responsible for the process of the ceasing of star formation. Combes & Sanders (1981) suggested that bars are able to redistribute the material of disc galaxies by funnelling gas towards the galaxy centre. Such a process could have occurred in Q spirals in our sample, removing the available cold gas reservoir from their disc and making it available in the central regions for the induction of starburst/AGN activity followed by quenching (e.g. Knapen et al. 2002; Jogee et al. 2005).
As already presented in the top panels of Fig. 4, local ETGs (LBS; left panel, and E/S0; right panel) occupy different loci in the SFR–Mstar plane, depending on their stellar mass and their star-forming activity. To further investigate similarities and differences between these ETG populations (SF E/S0, Q E/S0 and SF LBS), in Fig. 7 we plot, as in the case of LTGs, the SFMS (top panel) and the fabs as a function of the bolometric luminosity (bottom panel). The fact that SF LBS galaxies follow the same distribution with the SF Es confirms the argument of Kormendy et al. (2009) that the population of high-surface-brightness-concentrated galaxies (such as LBSs) is similar to the giant elliptical population. The best linear fits for the two different populations (SF and Q) are plotted in the top panel of Fig. 7, with the majority of the SF E/S0s along with the SF LBS galaxies constituting a separate distribution, following, very closely, a relation similar to the SFMS of the local SF spiral galaxies (Eq. (1); blue solid line). The SFMS of the GAMA SF ETGs (ρ = 0.73; blue dashed line) is described by the following linear relation:
![Mathematical equation: $$ \begin{aligned} {\log }(\mathrm{SFR}[M_{\odot }\,\mathrm{yr}^{-1}]) = 0.78^{+0.03}_{-0.02}\,{\log }(M_{\rm star}[M_{\odot }]) - 7.79^{+0.25}_{-0.23}, \end{aligned} $$](/articles/aa/full_html/2023/01/aa44796-22/aa44796-22-eq13.gif)
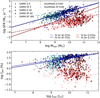 |
Fig. 7. SFR versus Mstar (top panel) and fabs versus Lbol (bottom panel) for the early-type (E/S0 and LBS) galaxies in the GAMA and DustPedia samples. SF E/S0 and SF LBS galaxies are represented with blue and cyan symbols, respectively, while Q E/S0 galaxies (given that Q LBSs are under-represented and are not shown here; see Sect. 2.2) are shown with red symbols. Blue and red stars stand for the GAMA SF and Q S0 galaxies, while E sources are represented by circles. Open symbols show the DustPedia E/S0 galaxies. All values are plotted along with their corresponding uncertainties. Solid lines are the linear fits for the GAMA SF and Q galaxies (blue and red, respectively), while the dashed lines are the linear fits for the DustPedia SF and Q galaxies (blue and red, respectively). |
and their intrinsic scatter is found to be 0.36 dex. This is in agreement with the findings by Wu & Zhang (2021) who have found a slope of 0.74 ± 0.01 and an offset of −7.22 ± 0.08 for their sample of SDSS DR7 SF ETGs.
A second correlation is present in this plot for the Q E/S0s, with a larger scatter though (0.64 dex) and lower Pearson correlation coefficient ρ = 0.58. GAMA Q E/S0s occupy the same locus with the DustPedia Q E/S0s in the SFR–Mstar plane. The corresponding linear regression to the GAMA Q E/S0s gives:
![Mathematical equation: $$ \begin{aligned} {\log }(\mathrm{SFR}[M_{\odot }\,\mathrm{yr}^{-1}]) = 0.59^{+0.08}_{-0.08}\,{\log }(M_{\rm star}[M_{\odot }]) - 7.65^{+0.84}_{-0.89}, \end{aligned} $$](/articles/aa/full_html/2023/01/aa44796-22/aa44796-22-eq16.gif)
(red dashed line). Compared to the Q LTGs (Eq. (2); red solid line) we see that the Q ETGs occupy a slightly different space in the SFR–Mstar plane with lower values of SFR per stellar mass bin.
Nersesian et al. (2019) have shown that fabs is larger in intermediate spiral galaxies (Sb-Sc), where ∼35% of their intrinsic luminosity is affected by the dust. On the other hand, it is also shown in that study that, pure elliptical galaxies exhibit very low fabs values (∼2%). Bianchi et al. (2018) explored the dependence of this quantity on the bolometric luminosity, finding a positive correlation for the late spirals. The Es though were found to have no correlation. Similarly, in the bottom panel of Fig. 7 we plot fabs as a function of the bolometric luminosity with the nomenclature being the same as in the top panel of the same figure. As was also observed in the SFR–Mstar plane, again we find the SF E/S0s, along with the LBS galaxies, constituting a separate distribution in the fabs − Lbol plane. Regardless their elliptical morphology they follow a positive trend (blue dashed line; ρ = 0.62), described by the relation:
![Mathematical equation: $$ \begin{aligned} {\log }(f_{\rm abs}[\%]) = 0.27^{+0.02}_{-0.02}\,{\log }(L_{\rm bol}[L_{\odot }]) - 1.12^{+0.17}_{-0.18} \end{aligned} $$](/articles/aa/full_html/2023/01/aa44796-22/aa44796-22-eq17.gif)
with intrinsic scatter 0.12 . This correlation is in great agreement with what is found for the SF LTGs (Eq. (3); solid blue line). No clear correlation seems to be present for the fabs with the Lbol for the Q E/S0 galaxies (ρ = −0.12).
To further investigate the differences in the physical properties between the SF and Q ETGs, in Fig. 8 we present the histograms of the dust-to-stellar mass ratio (top panel) and the sSFR (bottom panel). The histogram of the dust-to-stellar mass ratio suggests that among the three populations (SF LBS, Q E/S0, and SF E/S0) it is the SF LBSs that show the highest relative dust content, compared to their stellar mass, with a median value of the dust-to-stellar mass ratio of 0.0016. The corresponding ratio of the SF E/S0s is 8 × 10⁻⁴, whilst the Q E/S0 galaxies are the most dust deficient for their stellar mass (a ratio of 8 × 10⁻⁵). The median ratio we find for the SF ETGs (0.0016) is in excellent agreement with the findings by Rowlands et al. (2012) who computed the ratio for a Herschel-Astrophysical Terahertz Large Area Survey (H-ATLAS; Eales et al. 2010)/GAMA matched sample, highly contaminated by UV/optical blue ETGs. In another volume-limited sample of 62 ETGs of the Herschel Reference Survey (HRS), with 24% of them having detected dust emission, Smith et al. (2012) found a mean ratio of 5 × 10⁻⁵. This result is in agreement (within 0.2 dex difference) with the ratio we find for the Q E/S0s.
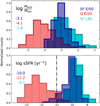 |
Fig. 8. Comparison of the distributions of the CIGALE-derived dust-to-stellar mass ratio (top panel) and sSFR (bottom panel) for the different sub-classes of early-type galaxies. The normalised distributions for the SF E/S0, the Q E/S0 galaxies, and the SF LBSs are shown in blue, red, and cyan, respectively. The median value of each parameter, for each population is given in the plot with the corresponding colour. The vertical dash-dotted line indicates the sSFR = 10−11 yr−1 threshold. |
By examining the distributions of the sSFR for the different earlier type galaxy populations, we find the SF E/S0s having a median sSFR of 10−10.0 yr−1 compared to the Q ones (6 × 10⁻¹³ yr−1). As was indicated by their high dust-to-stellar mass ratio SF LBSs is found to be the most actively star-forming early-type population with a median value of 2 × 10⁻¹⁰ yr−1. The mean sSFR averaged over the last 100 Myr for blue ETGs reported by Rowlands et al. (2012) is 1.2 × 10⁻¹¹ yr−1 (1 dex lower from the mean sSFR of SF E/S0s). Respectively, the median sSFR for the DustPedia E/S0s (which in vast majority are Q) is found to be 6.3 × 10⁻¹³ yr−1, the same for GAMA Q E/S0s.
As was also reported in previous studies for blue ETGs (e.g. Ferreras & Silk 2000; Kaviraj et al. 2007; Sampaio et al. 2022) SF ETGs are mainly found having lower masses compared to their Q counterparts. In GAMAnear we found 90% of SF ETGs lying in the 1.6 × 10⁸ M⊙ to 2.0 × 10¹⁰ M⊙ range of Mstar, while Q ETGs exceed to stellar masses up to 4.0 × 10¹¹ M⊙. A similar behaviour is observed for spirals, where Q Sa-Scds are mainly found at the high-mass end. Furthermore, as we move from LTGs to ETGs we find the dust-to-stellar mass ratio to decrease for SF galaxies (0.3 dex) and more significantly for Q galaxies (0.8 dex). This decreasing trend is in agreement with the findings by Cortese et al. (2012) studying the dust scaling relations of a HRS volume- and magnitude-limited sample of ∼300 galaxies.
It is worth noticing that the number of Q Sa-Scds with fabs larger than 10% (∼70%) is significantly larger than the corresponding fraction for the Q E/S0s (∼21%). This suggests that the dust effects in Q Sa-Scds are more important than in Q E/S0s. This is to be expected since Q Sa-Scds are found to be more dusty for their stellar masses, with their corresponding ratio being 0.8 dex higher than the one for Q E/S0s (see Figs. 6 and 8).
4. Stellar populations in SF early- and Q late-type galaxies and their role in dust heating
Investigating the stellar populations in galaxies and the way their radiation interacts with the dust grains is essential to understanding the energy balance that is taking place inside galaxies. The approach that we utilise, by modelling multi-wavelength SEDs of galaxies with CIGALE, allows us to parametrise the stellar content of galaxies into two broad categories, namely, an old and a young stellar population. The old stars are modelled with an exponentially declining SFR with the e-folding time (0.5−20 Gyr) and the age (2−12 Gyr) as free parameters. The young stars are formed after a bursting or quenching event of star formation, started 200 Myr ago, with the ratio of the SFR before and after the event being a free parameter. The choice of a constant moment for the latter event was indicated by Ciesla et al. (2016) who found that the shape of the SED is not sensitive to variations of this parameter (see also Nersesian et al. 2019).
Nersesian et al. (2019) studied the fraction of the luminosities of the two stellar components to the total luminosity, as well as their effect in the dust heating (the fractions of the stellar luminosities absorbed by dust) for the galaxies in the DustPedia sample, as a function of their morphology. This analysis suggested that the old stars in local galaxies, of all morphological types, always constitute the dominant population in terms of luminosity, with the contribution of young stars being less significant following an evolutionary sequence, decreasing from later- to earlier types of galaxies. On average, it was found that, the ratio of the luminosity of the young stars to the bolometric luminosity of the galaxy is 25% for Sb-Irr morphologies, while it drops to less than 10% for E/S0 morphologies. Despite this trend where ETGs, in the local universe, are mostly composed of older stars and with LTGs hosting larger fractions of young stars, other studies have reported the existence of galaxies where populations, significantly, depart from this general picture. Schawinski et al. (2009), investigating a sample of visually identified blue ETGs, selected from Galaxy Zoo and SDSS DR6, found that a young stellar component is present in this galaxy population. Measuring the Balmer absorption-line index HδA (tracer of the recent star formation) and the break at ∼4000 Å (tracer of mean stellar age) Masters et al. (2010) found the range of stellar ages in passive spirals being similar to typical ETGs and older than the one of SF spirals. Similarly, Rowlands et al. (2012), estimating the r-band light-weighted age of passive spiral galaxies found that they are mostly dominated by old stars with current star-formation activity well below the normal spirals.
Taking advantage of the fact that the galaxies in our sample are categorised in SF and Q in an unbiased and independent way (optical spectra; see Fig. 2) we are able to examine how the relative contributions of the two stellar populations (old and young) change, not only with morphology, but also, with star-formation activity. In Fig. 9 we present median SEDs of ETGs (Q E/S0, SF E/S0, SF LBS; top panels, left to right) and LTGs (Q Sa-Scd, SF Sa-Scd, SF Sd-Irr; bottom panels, left to right). In the panels describing the different types, apart from the total median SED, the various components comprising the SED (old and young stellar population, diffuse and PDR dust emission) are also shown. A visual inspection of the SEDs reveals a dependence of their shape with, both, the morphology and star-formation activity.
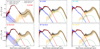 |
Fig. 9. Median SEDs of the GAMA ETGs (top panels) and the LTGs (bottom panels). The median total luminosity of each sub-class is indicated in black, while the old and young stellar components are shown in red and blue, respectively. The orange curve stands for the diffuse dust, while dust in PDRs is shown in green. Shaded areas correspond to the 16th–84th percentile range. |
Amongst the ETGs (top row in Fig. 9) the median SEDs of SF E/S0s and SF LBSs are very similar, while that of Q E/S0s deviates a lot. The similarity of the first two types of SEDs is more evident when comparing the flux at 100 μm (a difference of 0.14 dex) and at 1.0 μm (a difference of 0.06 dex), an indication of similar dust and stellar emission, respectively. One needs to notice here that LBSs are more compact and less massive systems, compared to SF E/S0s, so, even though the shape of their SED (normalised by their bolometric luminosity) is similar, they are expected, on average, to be less luminous. The similarities in the SEDs suggest that SF LBSs and SF E/S0s (especially Es which have similar overall morphology with LBSs) belong to the same population of galaxies with SF LBSs occupying the low-mass end of this galaxy population. Q E/S0s, on the other hand (top left panel), show a very different SED with the FIR emission being weaker, compared to the other two types, and with the stellar SED dominated by emission from old stars. The contribution from young stars in Q E/S0s is almost negligible. Q ETGs, for instance, compared to SF ETGs, have 0.3 dex higher flux at 1.0 μm and 1.1 dex lower flux at 100 μm. The lack of young stars in Q E/S0s is also reflected by the absence of PDR emission (linked to emission originating from star-forming sites) in the IR part of the SED, compared to the other two types where this type of emission has a significant contribution, especially in the case of SF E/S0s.
Although spiral galaxies (Q/SF Sa-Scd) show a very similar FIR emission (left and middle bottom panels) with a difference of only 0.21 dex at 100 μm, they differ a lot in their optical and FUV emission (e.g. 0.75 dex difference at ∼0.1 μm). Similar to the case of SF E/S0s and SF LBSs which are found to have very similar median SEDs, in the LTGs case, SF Sd-Irrs have almost identical median SED with the SF Sa-Scds (0.03 dex and 0.06 dex difference at 1.0 and 100 μm, respectively). This suggests that (as opposed to ETGs where one can see differences between Q and SF in both the stellar and the dust emission) LTGs galaxies differ mostly in their stellar content with SF types hosting significantly more young stars.
All the aforementioned properties are better quantified in Fig. 10, where we present the relative contributions of each stellar component (old and young; red and blue colours, respectively) to the total bolometric luminosity. In this figure, the leftmost panels show the relative contributions, to the bolometric luminosity, of the pure, unattenuated, stellar components (i.e. if there was no dust present in the galaxies) while in the rightmost panels the effects of dust are taken into account. In both panels, the relevant information for both ETGs (Q E/S0, SF E/S0, SF LBS) and LTGs (Q Sa-Scd, SF Sa-Scd, SF Sd-Irr) are presented. All the luminosity fractions are presented in Table 3.
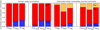 |
Fig. 10. The fraction of the old (red) and young (blue) stellar populations to the mean unattenuated ( |
Average values of the ratios of various combinations of the stellar and dust luminosity components extracted using the CIGALE SED fitting tool.
The first thing to notice from this plot is that, regardless of the morphological type or the star-forming activity, the old, more evolved, stellar population dominates the bolometric luminosity. This was also evident in Nersesian et al. (2019) with more than ∼75% of the bolometric luminosity, in all types of galaxies, originating from old stars, and with Es being the most extreme cases with this fraction being as high as 98%. On the other hand, in Sbc to Irr galaxies the fraction of the luminosity coming from the young stars is more significant, ranging between 20% and 30% depending on the galaxy type. With the current analysis we can update these results, not only as a function of morphology, but also, as a function of the star-forming activity in galaxies. Concerning the ETGs we find that Q E/S0s have a negligible fraction of young stars (1%), while SF E/S0s and SF LBSs show a quite substantial contribution of young stars (23% and 25%, respectively) comparable to what is seen for the most actively SF spiral galaxies). Nevertheless as was reported by Huang & Gu (2009), although the young stellar population is enhanced in SF Es (and SF S0s in our sample), they should not be considered as young objects, since their main stellar population is as old as the ones in the Q Es. LTGs, on the other hand, show a small fraction (4%) of young stars when being Q (Q Sa-Scds) which gets higher (25%) in their SF counterparts (SF Sa-Scds/Sd-Irrs). Huang & Gu (2009) found that due to their star-formation activity, SF Es have higher levels of dust attenuation. On the other hand, as was also discussed in paragraph 3.3, Q E/S0s are the most dust poor for their stellar mass, among the ETGs. A comparison of the dust content for the different types of LTGs is also provided in the same paragraph, finding that Q Sa-Scds are the most dust deficient.
The interplay between the two stellar populations and dust (in the different galaxy types) is shown in the right panel of Fig. 10. A decrease in the luminosity of both stellar populations is observed and this energy is absorbed and then re-emitted by dust (yellow bars). What is worth noticing from this plot is that although, Q E/S0s have low contribution to the total luminosity by dust, as expected, the contribution is very significant in SF E/S0s and SF LBSs, 35% and 19%, respectively.
When dust is considered the observed stellar luminosities are now suppressed as a result of the absorption of the stellar radiation by dust grains. The quantitative picture of this effect is described in the rightmost panels of Fig. 10 with blue and red bars indicating the mean ratios of the observed to the bolometric luminosities of the young and old stellar populations, respectively. Additionally, yellow bars indicate the fraction of the stellar radiation that is absorbed and gone into the dust heating (fabs = Ldust/Lbol). As also discussed in Bianchi et al. (2018) and Nersesian et al. (2019) this quantity indicates the significance of the dust in galaxies and the effectiveness of the dust grains in absorbing the stellar radiation, a combination of the total amount of dust, the geometry, and the strength of the ISRF (see also Paspaliaris et al. 2021). It is interesting to notice here that SF E/S0s show the highest fraction (35%) of the stellar radiation absorbed by dust, followed by SF spirals (27%), while SF LBSs and SF Sd-Irr have a similar fraction (19% and 18%, respectively). Q E/S0s have the lowest fraction fabs (6%).
The ratios of the stellar luminosity absorbed by the dust ( ) to the total, unattenuated, stellar luminosity (
 ) for each stellar component (old and young;
  ) can provide an estimation of how effectively each stellar population can heat the dust. These luminosity ratios are presented in Fig. 11, with the left panel showing the relative contribution of the old stars and the right panel the relative contribution of the young stars to the dust heating, respectively, for the various types of ETGs and LTGs. The dashed part of each bar corresponds to the part of the intrinsic luminosity of each stellar component that is absorbed by the dust, while the solid part of each bar indicates the remaining (emitted directly by the stars) luminosity. At a first glance, it is obvious that in all cases young stars are the ones that donate a higher fraction of their energy to the heating of the dust (already noted in Nersesian et al. 2019; Paspaliaris et al. 2021). Amongst the ETGs (Q E/S0, SF E/S0, and SF LBS), it is the SF E/S0 in which the stars are more efficiently heating the dust, with old stars contributing up to 24% (and young stars up to 74%) of their luminosity to heat the dust. Between the two classes of LTGs (Q and SF), there is not much variation, with the old stars contributing ∼10%−16%; surprisingly enough, the Q spirals give similar portions of their young-stellar luminosity to heat the dust (60% compared to 59% for the SF spirals). The relative distribution of stars and dust inside galaxies is expected to affect the fraction of the radiation of each stellar population offered for the dust heating. The fact that the offered (absorbed) fraction of each stellar population is comparable in Q and SF spiral galaxies (of which the geometry is obviously very similar), while the corresponding percentages in Q and SF E/S0 galaxies are significantly different, may indicate differences in the internal structure of these sources (especially in SF Es), despite their similar overall structural characteristics.
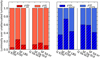 |
Fig. 11. Mean values of the fraction of the luminosity of each stellar population (red for old and blue for young stars) used for the heating of the dust. The ratio of the dust-absorbed luminosity to the unattenuated luminosity of the corresponding stellar component is indicated by the dashed bars ( |


The relative contribution of each stellar population to the heating of the dust ( ) is shown in Fig. 12, with the red and blue bars representing the mean ratio of the luminosity originating from the old and the young stars absorbed, by the dust (
 ), respectively, to the total luminosity emitted by the dust (Ldust). It is interesting to notice that it is only the SF Sa-Scd, SF Sd-Irr galaxies, and the SF LBSs in which the contribution of the young stars is, on average, the dominant source of dust heating, with values of
  of 57%, 59%, and 61%, respectively. In Q spirals and SF E/S0s there is a significant contribution in the dust heating from the young stars (24% and 47%, respectively), while the dust in Q E/S0s is almost exclusively heated by old stars (
 of 91%). All the relevant average fractions are presented in Table 3.
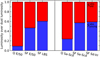 |
Fig. 12. Mean values of the ratios of old (red) and young (blue) stellar luminosity absorbed by dust to the dust luminosity ( |
5. Discussion
The coexistence of both types (Q and SF) in the various morphological types of galaxies is a very interesting finding and deserves a more thorough investigation in order to reveal the actual causes of this bimodal behaviour. In what follows, we investigate possible differences between Q and SF galaxies regarding their energetic output (SEDs), their morphologies (as paramatrised by their Re and Sèrsic index), and the effects that the local environment may have on the galaxies.
5.1. Differences between SEDs of Q and SF galaxies
In Fig. 13, we compare the median attenuated and unattenuated SEDs (each individual SED normalised to its bolometric luminosity) of all morphological classes, but they are grouped according to their star-forming activity. What is immediately evident is that the unattenuated SEDs of SF galaxies of all types of morphologies are very similar (almost identical; see top left panel). There are only minor differences observed with the SEDs of SF LBS, SF Sa-Scd, and SF Sd-Irr galaxies, which are slightly brighter in the FUV-optical wavelength range (∼0.1 dex at 0.2 μm) compared to those of SF E/S0 of the same bolometric luminosity. On the other hand, the infrared luminosity (LIR) is also, on average, very similar between all types of SF galaxies with only SF E/S0s showing a higher peak value at ∼100 μm (by ∼0.18 dex) compared to the rest morphologies. This suggests that all SF galaxies of the same bolometric luminosity, independently of their morphology, exhibit the same (within the statistical uncertainties imposed by our analysis) unattenuated stellar SEDs. When the effects of dust are taken into account, the differences become clearer in the attenuated stellar SEDs (top right panel in Fig. 13) with SF LBSs, SF Sa-Scds, and SF Sd-Irrs showing similar SEDs which are, on average, brighter in the FUV/optical wavelengths, compared to those of SF E/S0 types (by ∼0.4 dex at 0.2 μm).
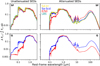 |
Fig. 13. Median SEDs for the different morphological classes (different colours are for different classes, as indicated in the upper right panel). The SEDs are grouped in SF galaxies (top panels) and Q galaxies (bottom panels). The unattenuated SEDs are plotted in the left panels, while the attenuated ones are plotted in the right panels. |
The Q galaxies (Sa-Scd, E/S0), on the other hand, show a diversity in the shape of their SEDs concerning both their attenuated and unattenuated stellar emission but also their dust emission (see the bottom panels in Fig. 13). Here we see that the unattenuated SEDs of the Q Sa-Scd galaxies, of the same bolometric luminosity, (bottom left panel) show an enhanced stellar emission compared to those of Q E/S0s. This means that, on average, Q galaxies of the same bolometric luminosity in the Sa-Scd morphology bin are brighter in the FUV-optical wavelengths, compared to E/S0 types (meaning that they are more rich in young stars), but, at the same time, have more dust content (higher emission in the FIR) leading to higher extinction values.
5.2. Structural characteristics
The Sérsic index (nλ) is considered a parameter to distinguish between different morphologies of galaxies (see, e.g. Ravindranath et al. 2004; Vika et al. 2015; Mosenkov et al. 2019, and references therein). Mosenkov et al. (2019) showed that although there is a lot of overlap, a borderline between LTGs and ETGs is at n3.4 = 2 (with ETGs occupying the larger values). On the other hand, the effective radius (Re) is a direct measure of the size of a galaxy, often related to nλ (see, e.g., D’Onofrio 2001).
Aiming to better understand the morphological discrepancies between the SF and Q galaxies in our sample, we investigate how the structural parameters (in particular the r-band Sérsic index, nr and the effective radius, Re) vary within galaxies of different morphologies and star-forming activity. As described in detail in Kelvin et al. (2012), such structural parameters have been retrieved through single-Sérsic modelling using the Structural Investigation of Galaxies via Model Analysis (SIGMA) code. The galaxies in the GAMA sample are modelled with GALFIT (Peng et al. 2010a) (implemented in SIGMA), allowing for multiple parametric functions (e.g. Sérsic, exponential, Gaussian, etc.). The model of each galaxy is then produced with a downhill algorithm used by GALFIT to minimise the global χ2. The final products are finally analysed by SIGMA for any obvious errors.
In Fig. 14, we plot Kernel density estimates of the nr as a function of the Re. ETGs and LTGs are plotted in the left and right panels, respectively. The median values of nr and Re for all galaxy types are presented in Table 4. For the ETGs (left panel in Fig. 14), we see that there is an increase in nr, on average, with increasing Re, with SF LBSs being least extended (median value of Re = 1 kpc), SF E/S0 being intermediate cases (Re = 2.2 kpc), and Q E/S0 being the most extended galaxies (Re = 4.3 kpc). The best fit calculated for the current sample of ETGs is expressed by the equation
![Mathematical equation: $$ \begin{aligned} {\log }(n_{r}) = 0.05^{+0.04}_{-0.04}\,{\log }(R_{\rm e}[\mathrm{kpc}]) + 0.25^{+0.02}_{-0.01}, \end{aligned} $$](/articles/aa/full_html/2023/01/aa44796-22/aa44796-22-eq60.gif)
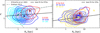 |
Fig. 14. Kernel density estimates for the distribution of different kinds of galaxies in the nr − Re plane. ETGs and LTGs are plotted in the left and right panels, respectively. Different colours indicate different morphologies and star-forming activities (as described in the insets in each panel). The median values of each subset are indicated by ‘+’ symbols. The dashed grey line and the dashed-dotted line are from D’Onofrio (2001) and Graham (2013), respectively (see the text for details). |
Median r-band Sérsic indices (nr) and effective radii (Re) for the different galaxy populations.
with a correlation coefficient of ρ = 0.41, which is to be expected given the large dispersion of the distributions. Concerning the r-band Sérsic index the SF ETGs (LBS, E/S0) show, on average, lower indices (1.8, and 1.5, respectively) with the Q E/S0 showing a much steeper profile with nr = 3.5. Although it is clear that in all cases the median value of nr indicate non-exponential profiles (nr > 1), it is the Q E/S0 types that show clear cases of steep radial profiles. LTGs (right panel in Fig. 14) show, on average, larger values of Re, compared to ETGs, with SF Sd-Irr being the most compact LTGs (median value of Re = 2.7 kpc), followed by SF Sa-Scd (Re = 4 kpc) and Q Sa-Scd (Re = 5.8 kpc). The larger values, compared to ETGs, can be explained due to the more extended, disc-like geometry of the spiral galaxies, as well as the flattened and more irregular distribution of Sd-Irr types (as opposed to the generally more elliptical shape of ETGs). The increase of the Re as a function of the nr for the LTGs is described by the relation
![Mathematical equation: $$ \begin{aligned} {\log }(n_{r}) = 0.21^{+0.01}_{-0.01}\,{\log }(R_{\rm e}[\mathrm{kpc}]) - 0.07^{+0.01}_{-0.01}, \end{aligned} $$](/articles/aa/full_html/2023/01/aa44796-22/aa44796-22-eq61.gif)
with a correlation coefficient of ρ = 0.28, which is again expected given the large dispersion of the distributions.
Concerning the Sérsic index LTGs show, on average lower values, compared to ETGs, consistent with exponential and more flattened profiles for SF Sa-Scd and SF Sd-Irr (nr = 1.2 and 1, respectively) with the Q Sa-Scd showing a steeper profile (nr = 2.2). The larger value of nr in the Q Sa-Scd galaxies may be an indication of a more prominent bulge component.
The fact that the median values of nr of SF LSB and E/S0 are closer to unity (see Table 4) may indicate that, despite the overall elliptical shape of the galaxy, an embedded disc may be present. Mahajan et al. (2018), when studying the blue spheroid (BSph) galaxies in the GAMA sample (here called the LBS), showed that although these galaxies have very similar structure to ellipticals, they resemble SF spirals in terms of age, metallicity, and star formation. In their analysis they also revealed the underlying structures of the galaxies by fitting a Sèrsic profile. The residuals indicated the existence of a disc or a nuclear component in ∼38% of BSph and in ∼43% of ellipticals in the sample. In a different sample, consisting of 55 blue ETGs from the SDSS DR6, George (2017) found that ∼58% show similar structures, which is attributed to recent interactions.
The SF galaxies of all morphological types show, systematically, lower median values of nr and Re in comparison to their Q counterparts. In addition, Q galaxies seem to be, on average, more extended than the SF ones. This is in agreement with the study of Xu et al. (2022) where they find that for a sample of S0s in the SDSS-IV MaNGA survey, the SF S0s show lower, average, bulge Sérsic indices compared to a control sample of S0 normal galaxies. The general trend, despite the very large scatter, is that there is an increase of the value of nr with Re. This is evident in both morphologies (ETGs and LTGs, left and right panels of Fig. 14, respectively). Such a trend was previously reported by D’Onofrio (2001), for a volume- and magnitude-limited sample of 73 ETGs belonging to the Virgo and Fornax clusters (see the dashed grey line in the left panel of Fig. 14). This finding is also supported by the nr − Re relation by Graham (2013) (dash-dotted curve in the left panel of Fig. 14) being approximately linear for high-n (n > 2) cases, but curved for the low-n sources. Our data are in good agreement with this relation with the curved part of the fit mainly being shaped by the inclusion of LBS types.
5.3. The role of the environment
It has been found that the processes that control the star-forming activity in galaxies depend not only on their stellar masses (see, e.g. Fig. 4), but also on the environment the galaxies lie in and evolve in (Peng et al. 2010b; Vulcani et al. 2010; Paccagnella et al. 2016; Darvish et al. 2017). The dependence of SFR for a sample of GALEX NUV-detected SDSS ETGs with environment was explored by Schawinski et al. (2009). In the latter study, the authors found that blue ETGs with high rates of star formation inhabit low-density environments. In another study, Goto et al. (2003), the authors concluded that there is a strong dependence of the star-formation activity with environment with the passive spiral galaxies mainly being cluster members. On the other hand, other studies downgrade the role of environment on the shaping of the properties of galaxies, making internal processes more efficient mechanisms. For instance, Rowlands et al. (2012) reported that the environment is not the only physical quantity affecting whether galaxies will or will not evolve as passive, and the processes that turn spirals to passive systems may happen in either high- or low-density environments. Furthermore, Davies et al. (2019) found no or mild differences between the field and cluster galaxies in the DustPedia sample by studying their gas and dust properties.
The GAMA Galaxy Group Catalogue (G3C; Robotham et al. 2011) obtained by applying a friends-of-friends (FoF) algorithm provides information about the grouping of galaxies in the GAMA II equatorial regions of G09, G12, and G15, as well as the G02 survey region. By cross-matching the sample of the current study with the G3Cv10 version of the catalogue, we find available information for 930 galaxies (42% of the current sample). According to this classification, galaxy pairs or groups of more than two galaxy members are labelled as grouped, while field galaxies are totally isolated. The fractions of grouped and field galaxies in the current sample, for each morphological class, are presented in Fig. 15. Out of the 930 galaxies, 491 are grouped, while 439 are isolated. Although the Q galaxies are under-represented (e.g. only 3 Q E/S0 out of 24 and 3 Q Sa-Scd out of 17), some general trends are evident. The general picture is that dense environments harbour more Q galaxies (85% grouped, 15% field Q galaxies), while SF galaxies are similarly divided between dense and isolated environments (51% grouped, 49% field SF galaxies). The only exception is for SF LBS galaxies with 69% of these SF galaxies residing in isolated environments. The actual fractions of the field galaxies for each sub-sample are shown in Fig. 15. Our findings are in good agreement with Fraser-McKelvie et al. (2018), who found that high-mass passive spiral galaxies reside mostly in groups. Similarly, Sampaio et al. (2022) studied cluster and field galaxies from the SDSS-DR7 and found that 62% of the cluster galaxies are ‘red-cloud’ (Q) systems, while the majority (53%) of the field galaxies are ‘blue-cloud’ (SF) systems.
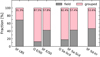 |
Fig. 15. The fractions of grouped (pink) and field (grey) galaxies for each subclass. The actual fraction of the grouped galaxies for each subclass is given in the top of each bar. |
A measure of the density of the local environment of a galaxy is the surface density, based on the distance to the fifth nearest neighbour. These measurements are provided for 1049 sources in our sample in Brough et al. (2013). In Fig. 16, the data are grouped in nine bins from 0.008 Mpc−2 (minimum density) to 3034 Mpc−2 (maximum density) logarithmically spaced, with the lines connecting the measurements to guide the eye. From this plot it is evident that, as in Fig. 15, SF galaxies tend to reside in less dense environments, as opposed to Q galaxies, which tend to reside in rich environments. In particular, the peak of the distributions of all SF types of galaxies is around 0.3 Mpc−2 (a median value of 0.49 Mpc−2), while all Q types peak at around 6 Mpc−2 (a median value of 2.71 Mpc−2). It is notable, however, that the range of the distributions is quite large (∼0.1 − 10 Mpc−2 for SF types and ∼0.1 − 100 Mpc−2 for Q types) with significant overlap. More specifically, the median surface density of the environment of SF E/S0s and SF Sa-Scds is 0.67 Mpc−2 and 0.60 Mpc−2, respectively, while these values are 0.37 Mpc−2 and 0.49 Mpc−2 for SF LBSs and SF Sd-Irrs, respectively. The Q galaxies, on the other hand, show higher median values of 2.79 Mpc−2 for the Q E/S0s and 2.47 Mpc−2 for the Q Sa-Scds, respectively.
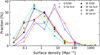 |
Fig. 16. The morphology-density relation for the different types of galaxies. Open circles and dashed lines stand for the Q galaxies, while full circles and solid lines represent the SF galaxies. Since Q LBSs and Q Sd-Irrs consist of a small number of sources they are not presented in this plot. |
Rowlands et al. (2012) found that both blue ETGs and passive spiral galaxies reside in environments with comparable densities to those of their ‘normal’ counterparts, but this could probably be due to the small sample used (10 blue ETGs and 15 passive spirals). For a similar GAMA sample, such as the one used in this work, Pearson et al. (2021) found that the fraction of Q galaxies increases as the environment becomes more massive (supporting our findings). Our results also agree with the findings of Agius et al. (2015), who studied 220 isolated (∼0.1−10 Mpc−2) ETGs from the GAMA/H-ATLAS sample (Agius et al. 2013) and 33 ETGs from the HeViCS sample (di Serego Alighieri et al. 2013) belonging to the Virgo cluster (∼25−500 Mpc−2). They find that cluster galaxies have very little or no ongoing star-formation activity, while isolated galaxies present some ongoing star formation, which in some cases is comparable to that in SF spiral galaxies.
5.4. Are SF Es a post-U/LIRG phase?
Paspaliaris et al. (2021) investigated the evolution of the physical properties of luminous (1011 L⊙ ≤ LIR < 1012 L⊙; LIRGs) and ultra-luminous IR galaxies (LIR ≥ 1012 L⊙; ULIRGs) along the merging sequence. In an SED fitting analysis, they studied 67 such local systems grouped in subsets according to their merging stage. The morphology of these systems spanned from single (s) spiral galaxies or slightly disturbed spiral galaxies due to minor mergers (m) to spirals in a pre-merging stage (M1) and disturbed systems during a major merging event (M2−M5). As was indicated by the morphology of the late-merger (M5) systems in that study and also by earlier studies based on simulations (e.g. Springel et al. 2005; Cox et al. 2006; Di Matteo et al. 2008; Hopkins et al. 2013b), the product of the coalescence is an elliptical galaxy. Moreover, simulations have shown that, after major merging events, galaxies undergo a morphological change, prior to the drop in their SFR (Dubois et al. 2016; Martin et al. 2018; Tacchella et al. 2019; Joshi et al. 2020). The same result was found by de Sá-Freitas et al. (2022) for a sample of blue E galaxies from SDSS DR12 (Alam et al. 2015). In the latter study, although the blue Es have enhanced SFRs, they present a quenching behaviour attributed to a possible past merging event or rejuvenation process. In Paspaliaris et al. (2021), however, no E galaxies (presumably the final ‘relaxed’ stage of a merging event) were analysed. This is a selection effect, since E galaxies mostly come with low luminosities (much less than the 1011 L⊙ LIRG limit). However, the diversity of the GAMAnear sample, analysed in this study, in terms of morphology and star-forming activity, gives us the opportunity to investigate the possibility of SF E galaxies being a post-U/LIRG product.
Assuming that the IR luminosity of galaxies after the coalescence decreases with time, we grouped the SF Es in LIR bins, namely L1 (LIR < 109 L⊙; 42 SF Es), L2 (109 L⊙ ≤ LIR < 1010 L⊙; 69 SF Es), and L3 (LIR ≥ 1010 L⊙; 23 SF Es), assuming that time evolves in the direction from L3 to L1 luminosity bins. We note that no E sources where found to have LIR ≥ 1011 L⊙. In the top panel of Fig. 17, we plot the median fractions of the young stellar population (YSP) for the different subsets of U/LIRGs and E galaxies. An increasing trend of the YSP in U/LIRGs (orange symbols) is observed between M2 and M4 systems (going from 50% to 83%), which then decreases back to 57% for M5 sources. For the SF Es (blue symbols), there is a decreasing trend with decreasing IR luminosity; however, a jump of 0.4 dex exists between L2 and L1 sources. While L3 and L2 sources have YSP median values of 31% and 24%, respectively, the corresponding value for L1 sources is 10%. This difference could also indicate two different families of SF E galaxies, with the luminous ones (L2 and L3) consisting mainly of post-U/LIRG systems, L1 sources, and lower LIR; these might be galaxies rejuvenated by minor merging events or by accretion of gas available in their environment (see Thom et al. 2012 for the latter scenario). The L1 and L2 bins of Q Es consist of 111 and 23 galaxies, respectively. We do not present the L3 bin for the Q Es because only one source was found within this LIR range. The YSP of Q Es (red symbols) also shows a decreasing trend, with decreasing IR luminosity. A notable characteristic that also supports the scenario that differentiates the L1 sources from the more luminous ones is that with increasing LIR, the difference in the YSP between SF E and Q E subsets is larger (1.4 dex, 1.7 dex difference between L1, L2 Q/SF Es, respectively), while the L3 bin is underrepresented for Q Es.
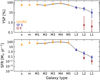 |
Fig. 17. Evolution of young stellar population (YSP; top panel) and SFR (bottom panel), along the U/LIRGs merging sequence and the post-U/LIRG phase. U/LIRGs from Paspaliaris et al. (2021) are shown in orange, while SF Es and Q Es are represented by blue and red squares, respectively. Error bars indicate the range between the 16th and 84th percentiles from the median. A black line connects the median values indicating the general trend. |
The evolution of the SFR is plotted in the bottom panel of Fig. 17. In the case of U/LIRGs, a similar trend is found with the maximum occurring in M4 systems with a median value of 99 M⊙ yr−1. In M5 systems, the median value is lower (71 M⊙ yr−1), and a dramatic decrease is observed in L3 and L2 SF Es (2.29 M⊙ yr−1 and 0.45 M⊙ yr−1, respectively). The decreasing trend of the SFR with decreasing LIR continues in L1 SF Es (0.07 M⊙ yr−1). The same trend is also observed for Q Es with 0.05 M⊙ yr−1 for L2 Q Es and 0.01 M⊙ yr−1 for L1 Q Es, respectively. A steep decrease in the SFR after the major merger has also been predicted by simulations. For instance, for realistic simulations of Milky Way-like galaxies at z = 0, Hopkins et al. (2013b) found the SFR falling to ∼2 M⊙ yr−1 in post-merging systems. In an earlier numerical study, Springel et al. (2005) predicted that in the post-merger era, the SFR decreases to levels lower than 10 M⊙ yr−1, with similar results also reported by Cox et al. (2006) and Di Matteo et al. (2008). Deeper observations that could reveal ‘hidden’ filamentary structures in the SF Es could confirm their possible merger-induced origin. As was also suggested by Rowlands et al. (2012), dusty ETGs such as the SF Es in our sample may be examples of post-merging systems with low inventories of hot gas, where a major star-formation event occurred a few gigayears before, creating their dust. This idea is also supported by the low (on-average) Sérsic indices found for the SF Es that could witness an imprint of a prior major merging event in these galaxies. Since X-ray emission traces the hot-gas content, such observations are required to corroborate this scenario.
6. Summary and conclusions
In this work, we examined a number of SED-derived global physical properties and the interplay between stars and dust of 2209 GAMAnear galaxies observed by HSO. We classified the sources in sub-groups according to their morphology and their dominant ionisation process (SF and Q galaxies). We excluded the sources that were flagged as AGNs according to our classification method. By exploring the SFR–Mstar plane, we find that it is their star-formation activity (i.e. if they are classified as SF or Q) and not their morphological type that determines their place in the diagram. For instance, we find ETGs (E and S0) that are classified as SF and occupy the SFMS locus but also LTGs (Sa-Scd types) that are classified as Q and occupy the space below the SFMS. We also investigated if different local environments favour the existence of SF or Q galaxies of different morphologies. Furthermore, we explored if galaxies of different morphologies and star-formation activity show differences in their structural characteristics. Our main conclusions are as follows:
– The median SEDs of galaxies of different star-formation activities indicate that, on average and compared to their Q analogues, SF galaxies show enhanced dust emission with the dust being warmer.
– The place of a galaxy in the SFR–Mstar plane does not depend only on its morphology, but mainly on its ability to convert gas into stars. In the GAMAnear sample, examined in this study, we find a large fraction (47%) of the E/S0 types showing ongoing star-formation activity and 8% of Sa-Scds being quiescent.
– SF E/S0s and SF LBS occupy the well-known ‘star-forming main-sequence’ (SFMS), previously known to be mainly populated by LTGs. This finding, as well as the fact that SF E/S0s and SF LBS show similar physical properties (e.g. dust-to-stellar mass ratio and sSFR) and structural properties (Sérsic index) indicate that LBSs may be smaller analogues of the SF ETGs.
– The low average dust-to-stellar mass ratio found in Q Sa-Scds (compared to their SF counterparts) and their enhanced luminosity originating from the old stars indicate that their redder optical colours can be explained, not only by dust deficiency but also by the enhanced old stellar population.
– The fraction of young stars in SF ETGs is found to be quite substantial (23% and 25% for SF E/S0 and SF LBS, respectively), with this fraction being only 1% for the Q E/S0. SF LTGs, on the other hand, show similar fractions of young stars to that of SF ETGs (25% for both types, SF Sa-Scds and SF Sd-Irrs), with this fraction being only 4% for the Q Sa-Scds.
– A significant contribution to the bolometric luminosity is found to be originating by dust (fabs) in SF ETGs (35% in SF E/S0s and 19% in LBSs) in contrast to that found for Q E/S0s (6%). On the other hand, SF LTGs show high values of fabs (27% in SF Sa-Scd and 18% in SF Sd-Irr) with the corresponding dust contribution in Q Sa-Scds being 16%.
– SF E/S0s use 24% and 74% of the luminosities originating from the old and the young stars to heat up the dust, while these fractions for the Q E/S0s are only 6% and 36%, respectively. SF Sa-Scds, on the other hand, use 16% and 59% of the luminosities originating from the old and young stars to heat up the dust, while these fractions for the Q Sa-Scds are, surprisingly enough, very similar at 12% and 60%, respectively. SF LBS and SF Sd-Irr galaxies show very similar fractions (11% and 10% of the luminosity of the old stars, and 44% and 42% of the luminosity of the young stars heating the dust, respectively).
– For the SF Sa-Scd, SF Sd-Irr, and the SF LBS types, the contribution of the young stars is, on average, the dominant source of dust heating (compared to the old stars), with values of 57%, 59%, and 61%, respectively. In Q Sa-Scd and SF E/S0s there is a significant contribution in the dust heating from the young stars (24% and 47%, respectively), while the dust in Q E/S0s is almost exclusively heated by old stars (91%).
– The SED analysis conducted using CIGALE indicates that SF galaxies of the same bolometric luminosity, independently of their morphology, exhibit the same (within the statistical uncertainties) unattenuated stellar SED. Q galaxies, on the other hand, show different unattenuated SEDs.
– Concerning the structural characteristics of the different types of galaxies, we find that, for ETGs, there is an average increase in the effective radius, with SF LBS being the less extended (median value of Re = 1 kpc), SF E/S0 being intermediate cases (Re = 2.2 kpc), and Q E/S0 being the most extended galaxies (Re = 4.3 kpc). LTGs show, on average, larger values of Re, compared to ETGs, with SF Sd-Irr being the most compact ones (median value of Re = 2.7 kpc), followed by SF Sa-Scd (Re = 4 kpc) and Q Sa-Scd (Re = 5.8 kpc). The r-band Sérsic index for SF ETGs (LBS, E/S0) show, on average, lower indices (1.8, and 1.5, respectively), with the Q E/S0 showing a much steeper profile with nr = 3.5. The fact that SF ETGs show relatively low values of the Sérsic index may indicate that, despite their overall elliptical shape, an embedded disc component may present in the centres of these galaxies. LTGs, on the other hand, show lower values compared to ETGs on average, which is consistent with exponential and more flattened profiles for SF Sa-Scd and SF Sd-Irr (nr = 1.2 and 1, respectively), with the Q Sa-Scd showing a steeper profile (nr = 2.2).
– The local environment is found to affect star-forming activity in galaxies. We find that dense environments tend to favour the existence of quiescent galaxies in contrast to low-density environments which are mostly populated by SF galaxies.
Our analysis indicates that a significant fraction of ETGs may exhibit current star-formation activity with SFRs comparable to those of SF LTGs, while on the opposite side many LTGs show ceased star-formation activity similar to quenched ETGs. A number of the SF ETGs in our sample show signs of interactions or even host a disc-like or spiral-like structures at their centres. Similar indications have been shown by others (e.g. Gomes et al. 2016; George 2017; Nyland et al. 2017). Eales et al. (2017) proposed that the common hypothesis that ETGs are deficient in cold ISM is a consequence of the low instrumental sensitivity. Deep imaging (e.g. JWST, ELT or ALMA observations) might help reveal possible correlation between their enhanced SFRs and the morphological disturbances. Furthermore, X-ray and radio observations could shed light on the mechanisms that cease their star-forming activity in the Q LTGs, such as the ram pressure stripping in jellyfish galaxies. The results of the current work possibly indicate, however, that the star-formation activity and galaxy morphology transitions are not always linked and occur over different timescales.
Due to their spheroidal morphology, LBS galaxies are also considered as ETGs in the current study.
Acknowledgments
We would like to thank the anonymous referee for the useful comments and suggestions, which helped improving the quality of the manuscript. E.-D.P. acknowledges the financial support from Greece and the European Union (European Social Fund-ESF) through the Operational Programme “Human Resources Development, Education and Lifelong Learning” in the context of the Act “Enhancing Human Resources Research Potential by undertaking a Doctoral Research” Sub-action 2: IKY Scholarship Programme for PhD candidates in the Greek Universities. A.N. acknowledges the support of the Research Foundation – Flanders (FWO Vlaanderen). V.A.M. acknowledges support by the Grant RTI2018-096686-B-C21 funded by MCIN/AEI/10.13039/501100011033 and by ‘ERDF A way of making Europe’. We would also like to thank Angel Ruiz (National Observatory of Athens) for constructive discussions regarding the UltraNest algorithm. This research made use of Astropy (http://www.astropy.org), a community-developed core Python package for Astronomy (Astropy Collaboration 2013, 2018) GAMA is a joint European-Australasian project based around a spectroscopic campaign using the Anglo-Australian Telescope. The GAMA input catalogue is based on data taken from the Sloan Digital Sky Survey and the UKIRT Infrared Deep Sky Survey. Complementary imaging of the GAMA regions is being obtained by a number of independent survey programmes including GALEX MIS, VST KiDS, VISTA VIKING, WISE, Herschel-ATLAS, GMRT and ASKAP providing UV to radio coverage. GAMA is funded by the STFC (UK), the ARC (Australia), the AAO, and the participating institutions. VISTA VIKING data are based on observations made with ESO Telescopes at the La Silla Paranal Observatory under programme ID 179.A-2004.
References
- Abazajian, K. N., Adelman-McCarthy, J. K., Agüeros, M. A., et al. 2009, ApJS, 182, 543 [Google Scholar]
- Agius, N. K., Sansom, A. E., Popescu, C. C., et al. 2013, MNRAS, 431, 1929 [NASA ADS] [CrossRef] [Google Scholar]
- Agius, N. K., di Serego Alighieri, S., Viaene, S., et al. 2015, MNRAS, 451, 3815 [NASA ADS] [CrossRef] [Google Scholar]
- Aihara, H., Arimoto, N., Armstrong, R., et al. 2018, PASJ, 70, S4 [NASA ADS] [Google Scholar]
- Alam, S., Albareti, F. D., Allende Prieto, C., et al. 2015, ApJS, 219, 12 [Google Scholar]
- Astropy Collaboration (Robitaille, T. P., et al.) 2013, A&A, 558, A33 [NASA ADS] [CrossRef] [EDP Sciences] [Google Scholar]
- Astropy Collaboration (Price-Whelan, A. M., et al.) 2018, AJ, 156, 123 [Google Scholar]
- Athanassoula, E., Machado, R. E. G., & Rodionov, S. A. 2013, MNRAS, 429, 1949 [Google Scholar]
- Baldry, I. K., Glazebrook, K., Brinkmann, J., et al. 2004, ApJ, 600, 681 [Google Scholar]
- Baldry, I. K., Balogh, M. L., Bower, R. G., et al. 2006, MNRAS, 373, 469 [Google Scholar]
- Baldry, I. K., Driver, S. P., Loveday, J., et al. 2012, MNRAS, 421, 621 [NASA ADS] [Google Scholar]
- Baldwin, J. A., Phillips, M. M., & Terlevich, R. 1981, PASP, 93, 5 [Google Scholar]
- Barsanti, S., Owers, M. S., Brough, S., et al. 2018, ApJ, 857, 71 [NASA ADS] [CrossRef] [Google Scholar]
- Bekki, K., Couch, W. J., & Shioya, Y. 2002, ApJ, 577, 651 [Google Scholar]
- Bellstedt, S., Robotham, A. S. G., Driver, S. P., et al. 2020, MNRAS, 498, 5581 [NASA ADS] [CrossRef] [Google Scholar]
- Bernardi, M., Sheth, R. K., Annis, J., et al. 2003, AJ, 125, 1882 [NASA ADS] [CrossRef] [Google Scholar]
- Bianchi, S., De Vis, P., Viaene, S., et al. 2018, A&A, 620, A112 [NASA ADS] [CrossRef] [EDP Sciences] [Google Scholar]
- Bitsakis, T., Sánchez, S. F., Ciesla, L., et al. 2019, MNRAS, 483, 370 [NASA ADS] [CrossRef] [Google Scholar]
- Blanton, M. R., Hogg, D. W., Bahcall, N. A., et al. 2003, ApJ, 594, 186 [NASA ADS] [CrossRef] [Google Scholar]
- Boquien, M., Burgarella, D., Roehlly, Y., et al. 2019, A&A, 622, A103 [NASA ADS] [CrossRef] [EDP Sciences] [Google Scholar]
- Brinchmann, J., Charlot, S., White, S. D. M., et al. 2004, MNRAS, 351, 1151 [Google Scholar]
- Brough, S., Croom, S., Sharp, R., et al. 2013, MNRAS, 435, 2903 [NASA ADS] [CrossRef] [Google Scholar]
- Bruzual, G., & Charlot, S. 2003, MNRAS, 344, 1000 [NASA ADS] [CrossRef] [Google Scholar]
- Buchner, J. 2016, Stat. Comput., 26, 383 [Google Scholar]
- Buchner, J. 2019, PASP, 131, 108005 [Google Scholar]
- Buchner, J. 2021, J. Open Sour. Softw., 6, 3001 [NASA ADS] [CrossRef] [Google Scholar]
- Calvi, R., Vulcani, B., Poggianti, B. M., et al. 2018, MNRAS, 481, 3456 [NASA ADS] [CrossRef] [Google Scholar]
- Calzetti, D. 2001, PASP, 113, 1449 [Google Scholar]
- Calzetti, D., Armus, L., Bohlin, R. C., et al. 2000, ApJ, 533, 682 [NASA ADS] [CrossRef] [Google Scholar]
- Cano-Díaz, M., Ávila-Reese, V., Sánchez, S. F., et al. 2019, MNRAS, 488, 3929 [Google Scholar]
- Chabrier, G. 2003, PASP, 115, 763 [Google Scholar]
- Cid Fernandes, R., Stasińska, G., Schlickmann, M. S., et al. 2010, MNRAS, 403, 1036 [Google Scholar]
- Cid Fernandes, R., Stasińska, G., Mateus, A., & Vale Asari, N. 2011, MNRAS, 413, 1687 [Google Scholar]
- Ciesla, L., Boquien, M., Boselli, A., et al. 2014, A&A, 565, A128 [NASA ADS] [CrossRef] [EDP Sciences] [Google Scholar]
- Ciesla, L., Charmandaris, V., Georgakakis, A., et al. 2015, A&A, 576, A10 [NASA ADS] [CrossRef] [EDP Sciences] [Google Scholar]
- Ciesla, L., Boselli, A., Elbaz, D., et al. 2016, A&A, 585, A43 [NASA ADS] [CrossRef] [EDP Sciences] [Google Scholar]
- Clark, C. J. R., Verstocken, S., Bianchi, S., et al. 2018, A&A, 609, A37 [NASA ADS] [CrossRef] [EDP Sciences] [Google Scholar]
- Combes, F., & Sanders, R. H. 1981, A&A, 96, 164 [NASA ADS] [Google Scholar]
- Combes, F., García-Burillo, S., Braine, J., et al. 2013, A&A, 550, A41 [NASA ADS] [CrossRef] [EDP Sciences] [Google Scholar]
- Cortese, L., Ciesla, L., Boselli, A., et al. 2012, A&A, 540, A52 [NASA ADS] [CrossRef] [EDP Sciences] [Google Scholar]
- Cox, T. J., Jonsson, P., Primack, J. R., & Somerville, R. S. 2006, MNRAS, 373, 1013 [Google Scholar]
- da Cunha, E., Charlot, S., & Elbaz, D. 2008, MNRAS, 388, 1595 [Google Scholar]
- da Cunha, E., Charmandaris, V., Díaz-Santos, T., et al. 2010, A&A, 523, A78 [NASA ADS] [CrossRef] [EDP Sciences] [Google Scholar]
- Darvish, B., Mobasher, B., Martin, D. C., et al. 2017, ApJ, 837, 16 [Google Scholar]
- Davies, J. I., Nersesian, A., Baes, M., et al. 2019, A&A, 626, A63 [NASA ADS] [CrossRef] [EDP Sciences] [Google Scholar]
- de Sá-Freitas, C., Gonçalves, T. S., de Carvalho, R. R., et al. 2022, MNRAS, 509, 3889 [Google Scholar]
- Di Matteo, P., Bournaud, F., Martig, M., et al. 2008, A&A, 492, 31 [NASA ADS] [CrossRef] [EDP Sciences] [Google Scholar]
- di Serego Alighieri, S., Bianchi, S., Pappalardo, C., et al. 2013, A&A, 552, A8 [NASA ADS] [CrossRef] [EDP Sciences] [Google Scholar]
- Diaferio, A., Kauffmann, G., Balogh, M. L., et al. 2001, MNRAS, 323, 999 [Google Scholar]
- Donnari, M., Pillepich, A., Nelson, D., et al. 2019, MNRAS, 485, 4817 [Google Scholar]
- D’Onofrio, M. 2001, MNRAS, 326, 1517 [CrossRef] [Google Scholar]
- Dressler, A. 1980, ApJ, 236, 351 [Google Scholar]
- Driver, S. P., Norberg, P., Baldry, I. K., et al. 2009, Astron. Geophys., 50, 5.12 [NASA ADS] [CrossRef] [Google Scholar]
- Driver, S. P., Hill, D. T., Kelvin, L. S., et al. 2011, MNRAS, 413, 971 [Google Scholar]
- Driver, S. P., Wright, A. H., Andrews, S. K., et al. 2016, MNRAS, 455, 3911 [NASA ADS] [CrossRef] [Google Scholar]
- Dubois, Y., Peirani, S., Pichon, C., et al. 2016, MNRAS, 463, 3948 [Google Scholar]
- Dunne, L., Eales, S., Edmunds, M., et al. 2000, MNRAS, 315, 115 [Google Scholar]
- Eales, S., Dunne, L., Clements, D., et al. 2010, PASP, 122, 499 [NASA ADS] [CrossRef] [Google Scholar]
- Eales, S., de Vis, P., Smith, M. W. L., et al. 2017, MNRAS, 465, 3125 [NASA ADS] [CrossRef] [Google Scholar]
- Elbaz, D., Daddi, E., Le Borgne, D., et al. 2007, A&A, 468, 33 [NASA ADS] [CrossRef] [EDP Sciences] [Google Scholar]
- Ferreras, I., & Silk, J. 2000, ApJ, 532, 193 [NASA ADS] [CrossRef] [Google Scholar]
- Florez, J., Jogee, S., Sherman, S., et al. 2020, MNRAS, 497, 3273 [NASA ADS] [CrossRef] [Google Scholar]
- Fontanot, F., De Lucia, G., Monaco, P., Somerville, R. S., & Santini, P. 2009, MNRAS, 397, 1776 [NASA ADS] [CrossRef] [Google Scholar]
- Fraser-McKelvie, A., Brown, M. J. I., Pimbblet, K. A., et al. 2016, MNRAS, 462, L11 [NASA ADS] [CrossRef] [Google Scholar]
- Fraser-McKelvie, A., Brown, M. J. I., Pimbblet, K., Dolley, T., & Bonne, N. J. 2018, MNRAS, 474, 1909 [NASA ADS] [CrossRef] [Google Scholar]
- Fraser-McKelvie, A., Merrifield, M., Aragón-Salamanca, A., et al. 2020, MNRAS, 499, 1116 [CrossRef] [Google Scholar]
- Fraser-McKelvie, A., Cortese, L., van de Sande, J., et al. 2021, MNRAS, 503, 4992 [NASA ADS] [CrossRef] [Google Scholar]
- Fukugita, M., Nakamura, O., Turner, E. L., Helmboldt, J., & Nichol, R. C. 2004, ApJ, 601, L127 [NASA ADS] [CrossRef] [Google Scholar]
- Gao, Y., & Solomon, P. M. 2004, ApJ, 606, 271 [NASA ADS] [CrossRef] [Google Scholar]
- George, K. 2017, A&A, 598, A45 [NASA ADS] [CrossRef] [EDP Sciences] [Google Scholar]
- George, K., Subramanian, S., & Paul, K. T. 2019, A&A, 628, A24 [NASA ADS] [CrossRef] [EDP Sciences] [Google Scholar]
- Géron, T., Smethurst, R. J., Lintott, C., et al. 2021, MNRAS, 507, 4389 [CrossRef] [Google Scholar]
- Gomes, J. M., Papaderos, P., Vílchez, J. M., et al. 2016, A&A, 585, A92 [NASA ADS] [CrossRef] [EDP Sciences] [Google Scholar]
- González Delgado, R. M., García-Benito, R., Pérez, E., et al. 2015, A&A, 581, A103 [Google Scholar]
- Gordon, Y. A., Owers, M. S., Pimbblet, K. A., et al. 2017, MNRAS, 465, 2671 [NASA ADS] [CrossRef] [Google Scholar]
- Goto, T., Okamura, S., Sekiguchi, M., et al. 2003, PASJ, 55, 757 [Google Scholar]
- Graham, A. W. 2013, in Elliptical and Disk Galaxy Structure and Modern Scaling Laws, eds. T. D. Oswalt, & W. C. Keel, 6, 91 [NASA ADS] [Google Scholar]
- Gunn, J. E., & Gott, J. R., III 1972, ApJ, 176, 1 [Google Scholar]
- Haines, T., McIntosh, D. H., Sánchez, S. F., Tremonti, C., & Rudnick, G. 2015, MNRAS, 451, 433 [NASA ADS] [CrossRef] [Google Scholar]
- Hopkins, A. M., Driver, S. P., Brough, S., et al. 2013a, MNRAS, 430, 2047 [NASA ADS] [CrossRef] [Google Scholar]
- Hopkins, P. F., Cox, T. J., Hernquist, L., et al. 2013b, MNRAS, 430, 1901 [Google Scholar]
- Huang, S., & Gu, Q. S. 2009, MNRAS, 398, 1651 [NASA ADS] [CrossRef] [Google Scholar]
- Hunt, L. K., De Looze, I., Boquien, M., et al. 2019, A&A, 621, A51 [NASA ADS] [CrossRef] [EDP Sciences] [Google Scholar]
- James, A., Dunne, L., Eales, S., & Edmunds, M. G. 2002, MNRAS, 335, 753 [CrossRef] [Google Scholar]
- Jogee, S., Scoville, N., & Kenney, J. D. P. 2005, ApJ, 630, 837 [NASA ADS] [CrossRef] [Google Scholar]
- Jones, A. P., Köhler, M., Ysard, N., Bocchio, M., & Verstraete, L. 2017, A&A, 602, A46 [NASA ADS] [CrossRef] [EDP Sciences] [Google Scholar]
- Joshi, G. D., Pillepich, A., Nelson, D., et al. 2020, MNRAS, 496, 2673 [Google Scholar]
- Kalinova, V., Colombo, D., Sánchez, S. F., et al. 2021, A&A, 648, A64 [NASA ADS] [CrossRef] [EDP Sciences] [Google Scholar]
- Katsianis, A., Gonzalez, V., Barrientos, D., et al. 2020, MNRAS, 492, 5592 [NASA ADS] [CrossRef] [Google Scholar]
- Kauffmann, G., White, S. D. M., & Guiderdoni, B. 1993, MNRAS, 264, 201 [Google Scholar]
- Kauffmann, G., Heckman, T. M., Tremonti, C., et al. 2003, MNRAS, 346, 1055 [Google Scholar]
- Kaviraj, S., Schawinski, K., Devriendt, J. E. G., et al. 2007, ApJS, 173, 619 [NASA ADS] [CrossRef] [Google Scholar]
- Kelvin, L. S., Driver, S. P., Robotham, A. S. G., et al. 2012, MNRAS, 421, 1007 [Google Scholar]
- Kelvin, L. S., Driver, S. P., Robotham, A. S. G., et al. 2014a, MNRAS, 444, 1647 [Google Scholar]
- Kelvin, L. S., Driver, S. P., Robotham, A. S. G., et al. 2014b, MNRAS, 439, 1245 [NASA ADS] [CrossRef] [Google Scholar]
- Kelvin, L. S., Bremer, M. N., Phillipps, S., et al. 2018, MNRAS, 477, 4116 [NASA ADS] [CrossRef] [Google Scholar]
- Kennicutt, R. C., Jr. 1983, ApJ, 272, 54 [NASA ADS] [CrossRef] [Google Scholar]
- Kennicutt, R. C., Jr. 1998, ARA&A, 36, 189 [Google Scholar]
- Kennicutt, R. C., Jr., & De Los Reyes, M. A. C. 2021, ApJ, 908, 61 [NASA ADS] [CrossRef] [Google Scholar]
- Kewley, L. J., Groves, B., Kauffmann, G., & Heckman, T. 2006, MNRAS, 372, 961 [Google Scholar]
- Knapen, J. H., Pérez-Ramírez, D., & Laine, S. 2002, MNRAS, 337, 808 [NASA ADS] [CrossRef] [Google Scholar]
- Kormendy, J., & Kennicutt, R. C., Jr. 2004, ARA&A, 42, 603 [Google Scholar]
- Kormendy, J., Fisher, D. B., Cornell, M. E., & Bender, R. 2009, ApJS, 182, 216 [Google Scholar]
- Kruk, S. J., Lintott, C. J., Bamford, S. P., et al. 2018, MNRAS, 473, 4731 [Google Scholar]
- Larson, R. B. 1975, MNRAS, 173, 671 [NASA ADS] [CrossRef] [Google Scholar]
- Larson, R. B., Tinsley, B. M., & Caldwell, C. N. 1980, ApJ, 237, 692 [Google Scholar]
- Lintott, C. J., Schawinski, K., Slosar, A., et al. 2008, MNRAS, 389, 1179 [NASA ADS] [CrossRef] [Google Scholar]
- Madau, P., & Dickinson, M. 2014, ARA&A, 52, 415 [Google Scholar]
- Mahajan, S., Drinkwater, M. J., Driver, S., et al. 2015, MNRAS, 446, 2967 [NASA ADS] [CrossRef] [Google Scholar]
- Mahajan, S., Drinkwater, M. J., Driver, S., et al. 2018, MNRAS, 475, 788 [NASA ADS] [CrossRef] [Google Scholar]
- Mahajan, S., Gupta, K. K., Rana, R., et al. 2020, MNRAS, 491, 398 [NASA ADS] [CrossRef] [Google Scholar]
- Makarov, D., Prugniel, P., Terekhova, N., Courtois, H., & Vauglin, I. 2014, A&A, 570, A13 [NASA ADS] [CrossRef] [EDP Sciences] [Google Scholar]
- Martin, G., Kaviraj, S., Devriendt, J. E. G., Dubois, Y., & Pichon, C. 2018, MNRAS, 480, 2266 [Google Scholar]
- Masters, K. L., Mosleh, M., Romer, A. K., et al. 2010, MNRAS, 405, 783 [NASA ADS] [Google Scholar]
- Masters, K. L., Nichol, R. C., Hoyle, B., et al. 2011, MNRAS, 411, 2026 [Google Scholar]
- McIntosh, D. H., Wagner, C., Cooper, A., et al. 2014, MNRAS, 442, 533 [NASA ADS] [CrossRef] [Google Scholar]
- Moffett, A. J., Ingarfield, S. A., Driver, S. P., et al. 2016, MNRAS, 457, 1308 [NASA ADS] [CrossRef] [Google Scholar]
- Moffett, A. J., Phillipps, S., Robotham, A. S. G., et al. 2019, MNRAS, 489, 2830 [NASA ADS] [CrossRef] [Google Scholar]
- Moore, B., Katz, N., Lake, G., Dressler, A., & Oemler, A. 1996, Nature, 379, 613 [Google Scholar]
- Moran, S. M., Ellis, R. S., Treu, T., et al. 2006, ApJ, 641, L97 [NASA ADS] [CrossRef] [Google Scholar]
- Mosenkov, A. V., Baes, M., Bianchi, S., et al. 2019, A&A, 622, A132 [NASA ADS] [CrossRef] [EDP Sciences] [Google Scholar]
- Nersesian, A., Xilouris, E. M., Bianchi, S., et al. 2019, A&A, 624, A80 [NASA ADS] [CrossRef] [EDP Sciences] [Google Scholar]
- Noeske, K. G., Weiner, B. J., Faber, S. M., et al. 2007, ApJ, 660, L43 [CrossRef] [Google Scholar]
- Noll, S., Burgarella, D., Giovannoli, E., et al. 2009, A&A, 507, 1793 [NASA ADS] [CrossRef] [EDP Sciences] [Google Scholar]
- Nyland, K., Young, L. M., Wrobel, J. M., et al. 2017, MNRAS, 464, 1029 [Google Scholar]
- Paccagnella, A., Vulcani, B., Poggianti, B. M., et al. 2016, ApJ, 816, L25 [NASA ADS] [CrossRef] [Google Scholar]
- Pak, M., Lee, J. H., Jeong, H., et al. 2019, ApJ, 880, 149 [NASA ADS] [CrossRef] [Google Scholar]
- Pappalardo, C., Bizzocchi, L., Fritz, J., et al. 2016, A&A, 589, A11 [NASA ADS] [CrossRef] [EDP Sciences] [Google Scholar]
- Park, C., Gott, J. R., III, & Choi, Y.-Y. 2008, ApJ, 674, 784 [NASA ADS] [CrossRef] [Google Scholar]
- Partridge, R. B., & Peebles, P. J. E. 1967, ApJ, 147, 868 [Google Scholar]
- Paspaliaris, E.-D., Xilouris, E. M., Nersesian, A., et al. 2021, A&A, 649, A137 [NASA ADS] [CrossRef] [EDP Sciences] [Google Scholar]
- Pearson, W. J., Wang, L., Brough, S., et al. 2021, A&A, 646, A151 [NASA ADS] [CrossRef] [EDP Sciences] [Google Scholar]
- Peng, C. Y., Ho, L. C., Impey, C. D., & Rix, H.-W. 2010a, AJ, 139, 2097 [Google Scholar]
- Peng, Y.-J., Lilly, S. J., Kovač, K., et al. 2010b, ApJ, 721, 193 [Google Scholar]
- Pilbratt, G. L., Riedinger, J. R., Passvogel, T., et al. 2010, A&A, 518, L1 [NASA ADS] [CrossRef] [EDP Sciences] [Google Scholar]
- Ravindranath, S., Ferguson, H. C., Conselice, C., et al. 2004, ApJ, 604, L9 [NASA ADS] [CrossRef] [Google Scholar]
- Renzini, A., & Peng, Y.-J. 2015, ApJ, 801, L29 [Google Scholar]
- Robotham, A. S. G., Norberg, P., Driver, S. P., et al. 2011, MNRAS, 416, 2640 [NASA ADS] [CrossRef] [Google Scholar]
- Roehlly, Y., Burgarella, D., Buat, V., et al. 2014, in Astronomical Data Analysis Software and Systems XXIII, eds. N. Manset, & P. Forshay, ASP Conf. Ser., 485, 347 [NASA ADS] [Google Scholar]
- Rowlands, K., Dunne, L., Maddox, S., et al. 2012, MNRAS, 419, 2545 [NASA ADS] [CrossRef] [Google Scholar]
- Salpeter, E. E. 1955, ApJ, 121, 161 [Google Scholar]
- Sampaio, V. M., de Carvalho, R. R., Ferreras, I., Aragón-Salamanca, A., & Parker, L. C. 2022, MNRAS, 509, 567 [Google Scholar]
- Sarzi, M., Falcón-Barroso, J., Davies, R. L., et al. 2006, MNRAS, 366, 1151 [Google Scholar]
- Schawinski, K., Kaviraj, S., Khochfar, S., et al. 2007, ApJS, 173, 512 [NASA ADS] [CrossRef] [Google Scholar]
- Schawinski, K., Lintott, C., Thomas, D., et al. 2009, MNRAS, 396, 818 [NASA ADS] [CrossRef] [Google Scholar]
- Shimakawa, R., Tanaka, M., Bottrell, C., et al. 2022, PASJ, 74, 612 [NASA ADS] [CrossRef] [Google Scholar]
- Skibba, R. A., & Sheth, R. K. 2009, MNRAS, 392, 1080 [NASA ADS] [CrossRef] [Google Scholar]
- Smith, M. W. L., Gomez, H. L., Eales, S. A., et al. 2012, ApJ, 748, 123 [NASA ADS] [CrossRef] [Google Scholar]
- Sorensen, S. A., Matsuda, T., & Fujimoto, M. 1976, Ap&SS, 43, 491 [NASA ADS] [CrossRef] [Google Scholar]
- Springel, V., Di Matteo, T., & Hernquist, L. 2005, MNRAS, 361, 776 [Google Scholar]
- Strateva, I., Ivezić, Ž., Knapp, G. R., et al. 2001, AJ, 122, 1861 [CrossRef] [Google Scholar]
- Tacchella, S., Diemer, B., Hernquist, L., et al. 2019, MNRAS, 487, 5416 [Google Scholar]
- Taylor, E. N., Hopkins, A. M., Baldry, I. K., et al. 2015, MNRAS, 446, 2144 [NASA ADS] [CrossRef] [Google Scholar]
- Thom, C., Tumlinson, J., Werk, J. K., et al. 2012, ApJ, 758, L41 [NASA ADS] [CrossRef] [Google Scholar]
- Thomas, D., Maraston, C., Schawinski, K., Sarzi, M., & Silk, J. 2010, MNRAS, 404, 1775 [NASA ADS] [Google Scholar]
- Tonry, J. L., Blakeslee, J. P., Ajhar, E. A., & Dressler, A. 2000, ApJ, 530, 625 [NASA ADS] [CrossRef] [Google Scholar]
- Toomre, A., & Toomre, J. 1972, ApJ, 178, 623 [Google Scholar]
- Trussler, J., Maiolino, R., Maraston, C., et al. 2020, MNRAS, 491, 5406 [Google Scholar]
- Vika, M., Vulcani, B., Bamford, S. P., Häußler, B., & Rojas, A. L. 2015, A&A, 577, A97 [NASA ADS] [CrossRef] [EDP Sciences] [Google Scholar]
- Vulcani, B., Poggianti, B. M., Finn, R. A., et al. 2010, ApJ, 710, L1 [NASA ADS] [CrossRef] [Google Scholar]
- Vulcani, B., Poggianti, B. M., Fritz, J., et al. 2015, ApJ, 798, 52 [Google Scholar]
- Wetzel, A. R., Tinker, J. L., & Conroy, C. 2012, MNRAS, 424, 232 [NASA ADS] [CrossRef] [Google Scholar]
- Whitaker, K. E., van Dokkum, P. G., Brammer, G., & Franx, M. 2012, ApJ, 754, L29 [Google Scholar]
- Wolf, C., Aragón-Salamanca, A., Balogh, M., et al. 2009, MNRAS, 393, 1302 [Google Scholar]
- Wright, A. H., Robotham, A. S. G., Bourne, N., et al. 2016, MNRAS, 460, 765 [Google Scholar]
- Wu, Y.-Z., & Zhang, W. 2021, MNRAS, 503, 2340 [NASA ADS] [CrossRef] [Google Scholar]
- Wuyts, S., Förster Schreiber, N. M., van der Wel, A., et al. 2011, ApJ, 742, 96 [NASA ADS] [CrossRef] [Google Scholar]
- Xu, K., Gu, Q., Lu, S., et al. 2022, MNRAS, 509, 1237 [Google Scholar]
- Yi, S. K., Yoon, S. J., Kaviraj, S., et al. 2005, ApJ, 619, L111 [NASA ADS] [CrossRef] [Google Scholar]
Appendix A: Validation of results
In order to investigate how accurately the derived parameters can be constrained from the multi-wavelength SED fitting that CIGALE performs, we examined the distribution of the reduced χ2 (estimated as the χ2 divided by the number of observations minus the population of the free parameters). The reduced χ2 distributions for different subsets of our sample are presented in Fig. A.1. The median reduced χ2 for all the 2,209 sources modelled is 0.38, while it is 0.36 for the ETGs and 0.40 for LTGs. Out of the sources modelled, 36 (1.6%) have  and only 5 (0.2%) have
  , with the highest
  being equal to 15.3.
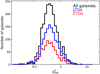 |
Fig. A.1. Distributions of the reduced χ2 for the 2,209 galaxies modelled with CIGALE (black line). The distributions of ETGs and LTGs are plotted in red and blue, respectively. |
A.1. Comparison between CIGALE and MAGPHYS
The GAMA sample investigated in the current work was already studied by Driver et al. (2016), and the basic parameters discussed in this paper have been computed using a similar approach with the SED fitting code MAGPHYS (da Cunha et al. 2008). In Fig. A.2, we compare what is computed in the current work with what is provided in the GAMA survey DR3 file server.
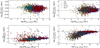 |
Fig. A.2. Comparison between CIGALE-derived (this work) and the MAGPHYS-derived (Driver et al. 2016) properties of the galaxies in our sample. Mstar, Mdust, SFR, and Ldust are shown in the top left, top right, bottom left, and bottom right panels, respectively. |
In the top left panel of Fig. A.2 we compare the stellar masses as derived by the two codes. Different colours indicate different morphological types as indicated in the top right panel. For the comparison of the stellar masses one needs to take into account that in da Cunha et al. (2008) the Chabrier (2003) IMF is considered, while the Salpeter (1955) IMF was used in our analysis, leading to a systematic underestimation of Mstar (see also da Cunha et al. 2010; Paspaliaris et al. 2021). To rescale stellar masses from Chabrier to Salpeter IMF, we divided by a constant factor of 0.61 as indicated in Madau & Dickinson (2014). The stellar masses seem to be in a good agreement with roughly a ±0.25 dex scatter and no obvious systematic offset (a median value of the differences of 0.0006 dex).
In the top right panel of Fig. A.2, the comparison of the dust masses as derived by MAGPHYS (da Cunha et al. 2008) and by CIGALE (current study) is presented. Compared to what is found for the stellar masses, the data show a larger dispersion, roughly ±1 dex, with a median offset of 0.2 dex. This large dispersion and offset are to be expected since a different SED model and a different dust grain model are used in each fitting code. In CIGALE, we used the THEMIS dust model. THEMIS is based on the optical properties of amorphous silicate and amorphous hydrocarbon materials measured in the laboratory (see Jones et al. 2017, and references therein), with a dust absorption coefficient κ250μm = 6.4 cm2 g−1. On the other hand, as described in da Cunha et al. (2008), MAGPHYS models the IR emission from stellar birth-clouds as the sum of a component of polycyclic aromatic hydrocarbons (PAHs), a mid-IR continuum component originating from hot grains (130-250 K) and a component of grains in thermal equilibrium (adjustable temperature 30-60 K). In addition, for the emission from the ISM it uses the latter three components to reproduce the spectral shape of the Milky Way diffuse cirrus emission along with a cold grain component in thermal equilibrium (adjustable temperature 15-25 K). The warm and cold components are described by modified blackbody spectra and absorption cross-section with spectral indices β equal to 1.5 and 2.0, respectively, normalised to κ850μm = 0.77 cm2 g−1 (Dunne et al. 2000; James et al. 2002).
The comparison of the SFR, as estimated by the two codes, is presented in the bottom left panel of Fig. A.2. In order to account for the different IMFs used between the two codes, we used a constant conversion factor of 0.63 to convert from the Chabrier SFRs to Salpeter SFRs (see Madau & Dickinson 2014). A systematic CIGALE underestimation of SFR is observed for sources with SFR less than about one M⊙ yr−1. This might be explained by the different SFH modules used in the two codes. In particular, the SFH used in the current study is a late burst or quench superimposed to a more passively evolving component, while the one used in MAGPHYS is a continuous exponentially declining SFH, with additional random bursts of star formation.
In the case of dust luminosity (bottom right panel), there is clear underestimation of Ldust, as computed by CIGALE, especially evident at low luminosities. A tendency of the MAGPHYS code to maximise the dust content within the bounds defined by the errors of the FIR observations has already been reported by Driver et al. (2011). Several other studies (e.g. Pappalardo et al. 2016; Bianchi et al. 2018; Hunt et al. 2019) have also reported a broader bump at the FIR emission, when MAGPHYS is used, especially in the case where insufficient wavelength coverage exists in the range of 24-100 μm. This effect is clearly observed in SEDs of Fig. A.3, where the median templates fitted in this work using CIGALE (solid curves) are compared with the ones produced by Driver et al. (2016) with MAGPHYS (dashed lines). While the SEDs of Sab-Scd (blue) and Sd-Irr galaxies (yellow) are almost identical up to the ∼10 μm regime, the FIR bump is broader in the MAGPHYS SEDs and peaks at shorter wavelengths. Thus the overestimation of the dust luminosity by MAGPHYS is expected, since in both cases it is calculated by integrating the SEDs in the area of 8-1000 μm.
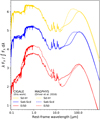 |
Fig. A.3. Comparison of median SEDs fitted by CIGALE in the current work (solid curves) and by MAGPHYS (dashed curves) presented in Driver et al. (2016). |
All Tables
List of the 21 broad-band filters provided by the GAMA database and used in the current SED fitting analysis.
Average values of the ratios of various combinations of the stellar and dust luminosity components extracted using the CIGALE SED fitting tool.
Median r-band Sérsic indices (nr) and effective radii (Re) for the different galaxy populations.
All Figures
|
Fig. 1. Typical GAMA galaxies with different morphologies (LBS, E, S0, Sa, Sab-Scd, Sd-Irr; from left to right) and different star-forming activity according to their dominant ionisation process (Q, SF; top and bottom, respectively). A composite g-, i-, H-band image is shown for each galaxy in a frame of 30 kpc × 30 kpc. The GAMA catalogue identification number and the redshift of each galaxy are indicated in the top right of each panel. |
| In the text | |
|
Fig. 2. WHAN diagram for the classification of the galaxies due to their dominant ionisation processes. Demarcation lines are from Cid Fernandes et al. (2011), for star-forming and quiescent galaxies (blue and red circles, respectively) and strong and weak AGNs (light and dark green circles, respectively). |
| In the text | |
|
Fig. 3. Median template SEDs for different morphological classes shifted arbitrarily for clarity. Solid curves represent the median SEDs of SF galaxies, while dashed SEDs stand for their Q counterparts. The two vertical lines (solid and dashed) approximately connect the dust emission peaks in the SEDs of the SF and Q galaxies, respectively. |
| In the text | |
|
Fig. 4. SFR versus Mstar diagram for the sub-samples separated by morphological classification. Early-type galaxies are plotted in the top panels, while late-type galaxies are plotted in the bottom panels. The colouring is the same as in Fig. 2. In the top right panel, Es are represented by circles, while stars show the S0 sources. The sSFR = 10−11 yr−1 line is also indicated, separating the galaxies in SF and Q in quite good agreement with the classification by the WHAN diagram. |
| In the text | |
|
Fig. 5. SFR versus Mstar (top panel) and fabs versus Lbol (bottom panel) for the late-type (Sa-Scd and Sd-Irr) galaxies in the GAMA and DustPedia samples. SF Sa-Scd and Sd-Irr galaxies are represented with blue and yellow symbols, respectively, while Q Sa-Scd galaxies (given that Q Sd-Irr are under-represented and are not shown here; see Sect. 2.2) are shown with red symbols. Blue and red stars stand for the GAMA SF and Q Sa galaxies, while Sab-Scd sources are represented by circles. Open symbols show the DustPedia Sa-Irr galaxies. All values are plotted along with their corresponding uncertainties. Solid lines are the linear fits for the GAMA SF and Q galaxies (blue and red, respectively), while the dashed lines are the linear fits for the DustPedia SF and Q galaxies (blue and red, respectively). |
| In the text | |
|
Fig. 6. Comparison of the distributions of the CIGALE-derived dust-to-stellar mass ratio (top panel) and sSFR (bottom panel) for the different sub-classes of late-type galaxies. The normalised distributions for the SF Sa-Scd, the Q Sa-Scd galaxies, and the SF Sd-Irr are shown in blue, red, and yellow, respectively. The median value of each parameter, for each population is given in the plot with the corresponding colour. The vertical dash-dotted line indicates the sSFR = 10−11 yr−1 threshold. |
| In the text | |
|
Fig. 7. SFR versus Mstar (top panel) and fabs versus Lbol (bottom panel) for the early-type (E/S0 and LBS) galaxies in the GAMA and DustPedia samples. SF E/S0 and SF LBS galaxies are represented with blue and cyan symbols, respectively, while Q E/S0 galaxies (given that Q LBSs are under-represented and are not shown here; see Sect. 2.2) are shown with red symbols. Blue and red stars stand for the GAMA SF and Q S0 galaxies, while E sources are represented by circles. Open symbols show the DustPedia E/S0 galaxies. All values are plotted along with their corresponding uncertainties. Solid lines are the linear fits for the GAMA SF and Q galaxies (blue and red, respectively), while the dashed lines are the linear fits for the DustPedia SF and Q galaxies (blue and red, respectively). |
| In the text | |
|
Fig. 8. Comparison of the distributions of the CIGALE-derived dust-to-stellar mass ratio (top panel) and sSFR (bottom panel) for the different sub-classes of early-type galaxies. The normalised distributions for the SF E/S0, the Q E/S0 galaxies, and the SF LBSs are shown in blue, red, and cyan, respectively. The median value of each parameter, for each population is given in the plot with the corresponding colour. The vertical dash-dotted line indicates the sSFR = 10−11 yr−1 threshold. |
| In the text | |
|
Fig. 9. Median SEDs of the GAMA ETGs (top panels) and the LTGs (bottom panels). The median total luminosity of each sub-class is indicated in black, while the old and young stellar components are shown in red and blue, respectively. The orange curve stands for the diffuse dust, while dust in PDRs is shown in green. Shaded areas correspond to the 16th–84th percentile range. |
| In the text | |
|
Fig. 10. The fraction of the old (red) and young (blue) stellar populations to the mean unattenuated ( |
| In the text | |
|
Fig. 11. Mean values of the fraction of the luminosity of each stellar population (red for old and blue for young stars) used for the heating of the dust. The ratio of the dust-absorbed luminosity to the unattenuated luminosity of the corresponding stellar component is indicated by the dashed bars ( |
| In the text | |
|
Fig. 12. Mean values of the ratios of old (red) and young (blue) stellar luminosity absorbed by dust to the dust luminosity ( |
| In the text | |
|
Fig. 13. Median SEDs for the different morphological classes (different colours are for different classes, as indicated in the upper right panel). The SEDs are grouped in SF galaxies (top panels) and Q galaxies (bottom panels). The unattenuated SEDs are plotted in the left panels, while the attenuated ones are plotted in the right panels. |
| In the text | |
|
Fig. 14. Kernel density estimates for the distribution of different kinds of galaxies in the nr − Re plane. ETGs and LTGs are plotted in the left and right panels, respectively. Different colours indicate different morphologies and star-forming activities (as described in the insets in each panel). The median values of each subset are indicated by ‘+’ symbols. The dashed grey line and the dashed-dotted line are from D’Onofrio (2001) and Graham (2013), respectively (see the text for details). |
| In the text | |
|
Fig. 15. The fractions of grouped (pink) and field (grey) galaxies for each subclass. The actual fraction of the grouped galaxies for each subclass is given in the top of each bar. |
| In the text | |
|
Fig. 16. The morphology-density relation for the different types of galaxies. Open circles and dashed lines stand for the Q galaxies, while full circles and solid lines represent the SF galaxies. Since Q LBSs and Q Sd-Irrs consist of a small number of sources they are not presented in this plot. |
| In the text | |
|
Fig. 17. Evolution of young stellar population (YSP; top panel) and SFR (bottom panel), along the U/LIRGs merging sequence and the post-U/LIRG phase. U/LIRGs from Paspaliaris et al. (2021) are shown in orange, while SF Es and Q Es are represented by blue and red squares, respectively. Error bars indicate the range between the 16th and 84th percentiles from the median. A black line connects the median values indicating the general trend. |
| In the text | |
|
Fig. A.1. Distributions of the reduced χ2 for the 2,209 galaxies modelled with CIGALE (black line). The distributions of ETGs and LTGs are plotted in red and blue, respectively. |
| In the text | |
|
Fig. A.2. Comparison between CIGALE-derived (this work) and the MAGPHYS-derived (Driver et al. 2016) properties of the galaxies in our sample. Mstar, Mdust, SFR, and Ldust are shown in the top left, top right, bottom left, and bottom right panels, respectively. |
| In the text | |
|
Fig. A.3. Comparison of median SEDs fitted by CIGALE in the current work (solid curves) and by MAGPHYS (dashed curves) presented in Driver et al. (2016). |
| In the text | |
Current usage metrics show cumulative count of Article Views (full-text article views including HTML views, PDF and ePub downloads, according to the available data) and Abstracts Views on Vision4Press platform.
Data correspond to usage on the plateform after 2015. The current usage metrics is available 48-96 hours after online publication and is updated daily on week days.
Initial download of the metrics may take a while.