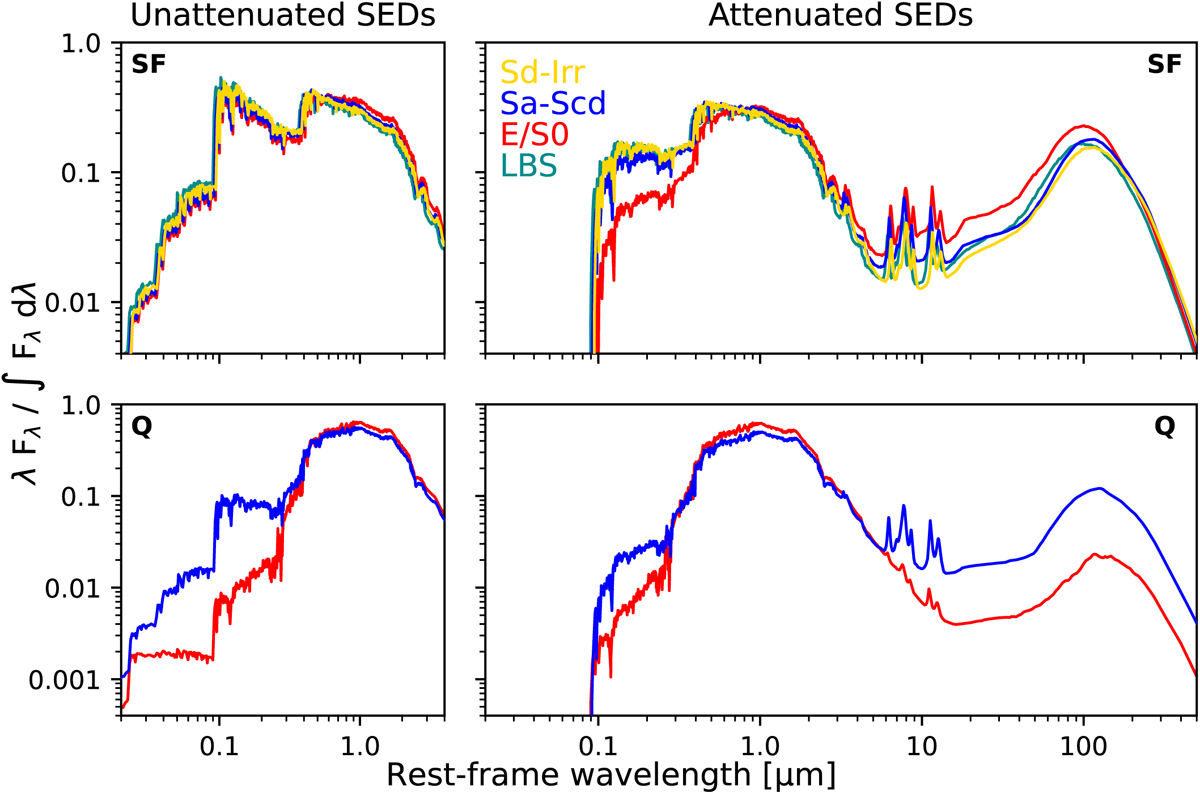
Fig. 13.
Download original image
Median SEDs for the different morphological classes (different colours are for different classes, as indicated in the upper right panel). The SEDs are grouped in SF galaxies (top panels) and Q galaxies (bottom panels). The unattenuated SEDs are plotted in the left panels, while the attenuated ones are plotted in the right panels.
Current usage metrics show cumulative count of Article Views (full-text article views including HTML views, PDF and ePub downloads, according to the available data) and Abstracts Views on Vision4Press platform.
Data correspond to usage on the plateform after 2015. The current usage metrics is available 48-96 hours after online publication and is updated daily on week days.
Initial download of the metrics may take a while.