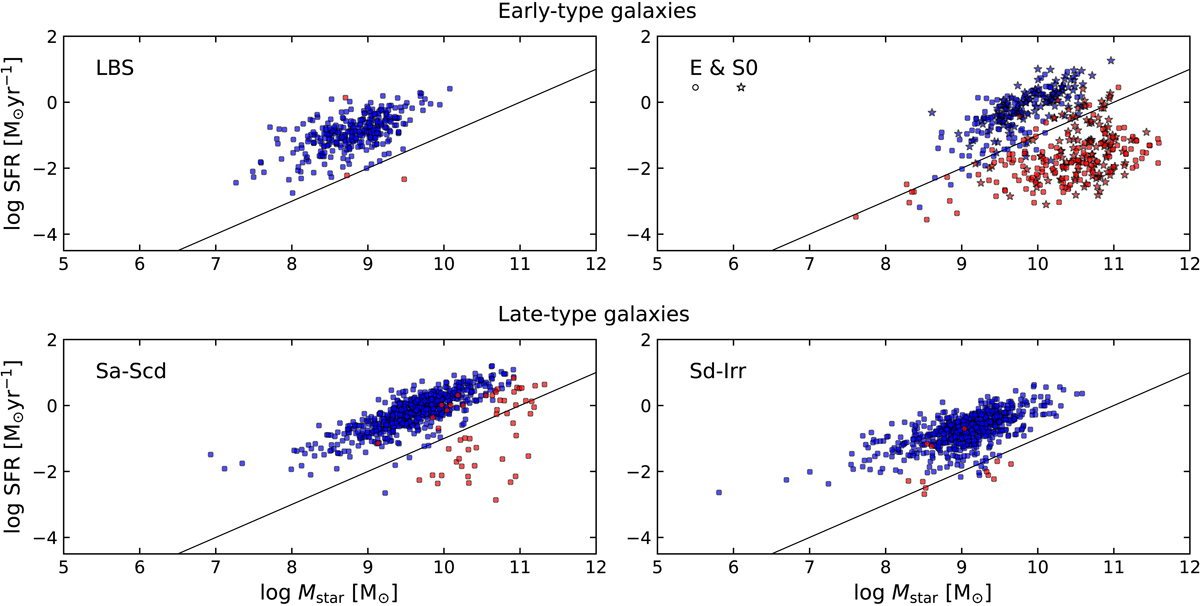
Fig. 4.
Download original image
SFR versus Mstar diagram for the sub-samples separated by morphological classification. Early-type galaxies are plotted in the top panels, while late-type galaxies are plotted in the bottom panels. The colouring is the same as in Fig. 2. In the top right panel, Es are represented by circles, while stars show the S0 sources. The sSFR = 10−11 yr−1 line is also indicated, separating the galaxies in SF and Q in quite good agreement with the classification by the WHAN diagram.
Current usage metrics show cumulative count of Article Views (full-text article views including HTML views, PDF and ePub downloads, according to the available data) and Abstracts Views on Vision4Press platform.
Data correspond to usage on the plateform after 2015. The current usage metrics is available 48-96 hours after online publication and is updated daily on week days.
Initial download of the metrics may take a while.