Fig. 6.
Download original image
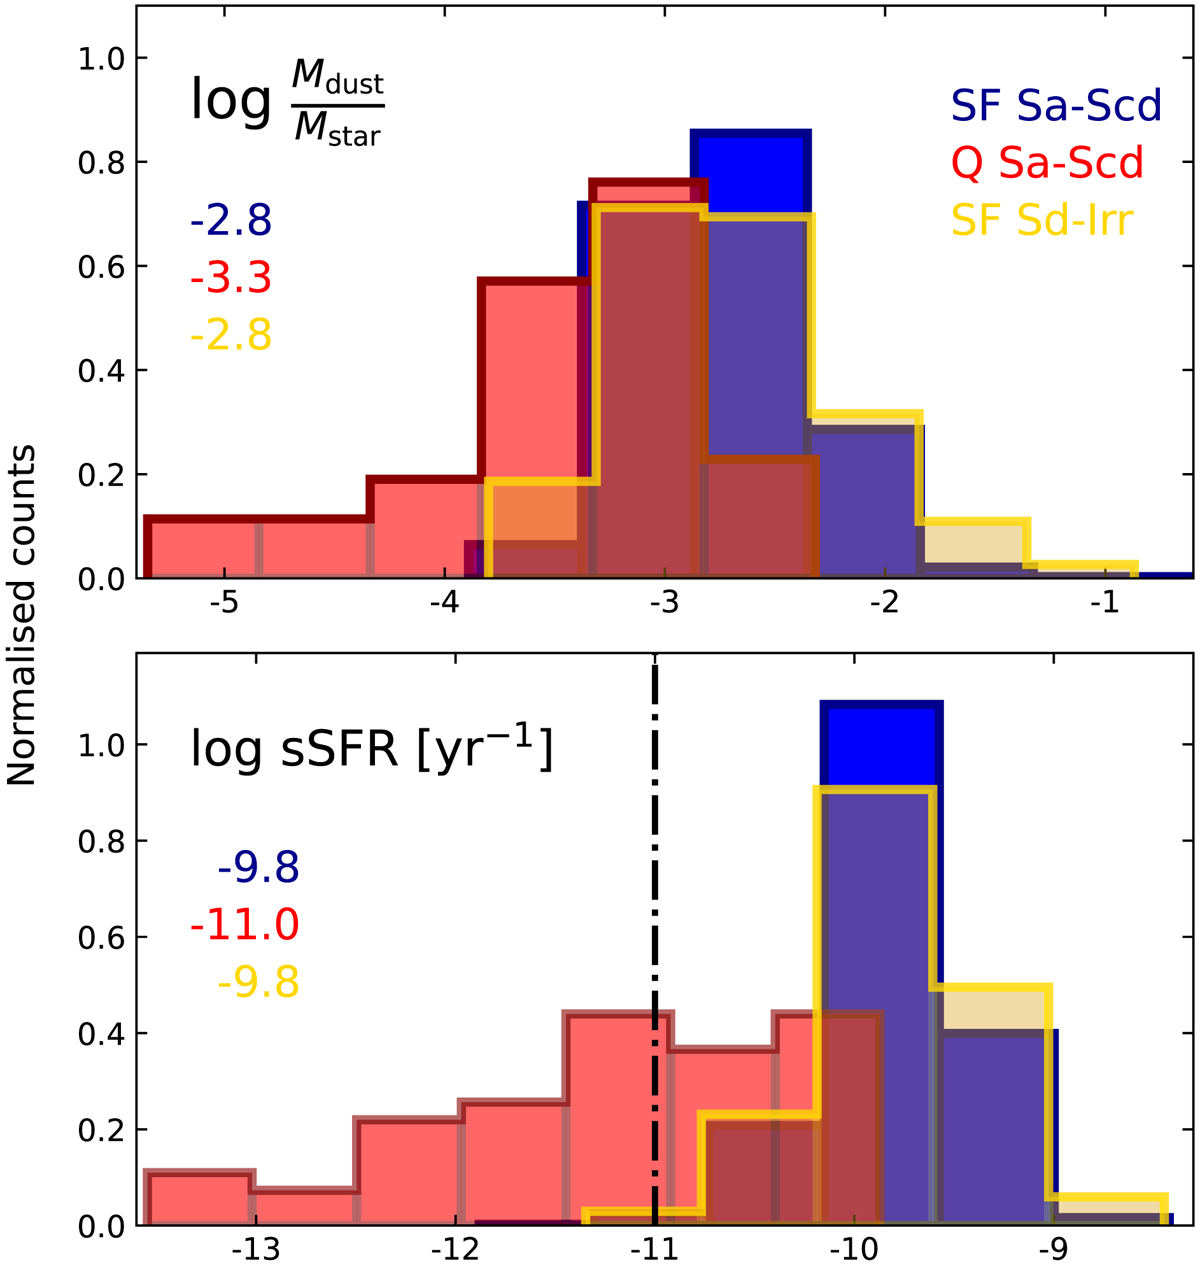
Comparison of the distributions of the CIGALE-derived dust-to-stellar mass ratio (top panel) and sSFR (bottom panel) for the different sub-classes of late-type galaxies. The normalised distributions for the SF Sa-Scd, the Q Sa-Scd galaxies, and the SF Sd-Irr are shown in blue, red, and yellow, respectively. The median value of each parameter, for each population is given in the plot with the corresponding colour. The vertical dash-dotted line indicates the sSFR = 10−11 yr−1 threshold.
Current usage metrics show cumulative count of Article Views (full-text article views including HTML views, PDF and ePub downloads, according to the available data) and Abstracts Views on Vision4Press platform.
Data correspond to usage on the plateform after 2015. The current usage metrics is available 48-96 hours after online publication and is updated daily on week days.
Initial download of the metrics may take a while.