Fig. 9.
Download original image
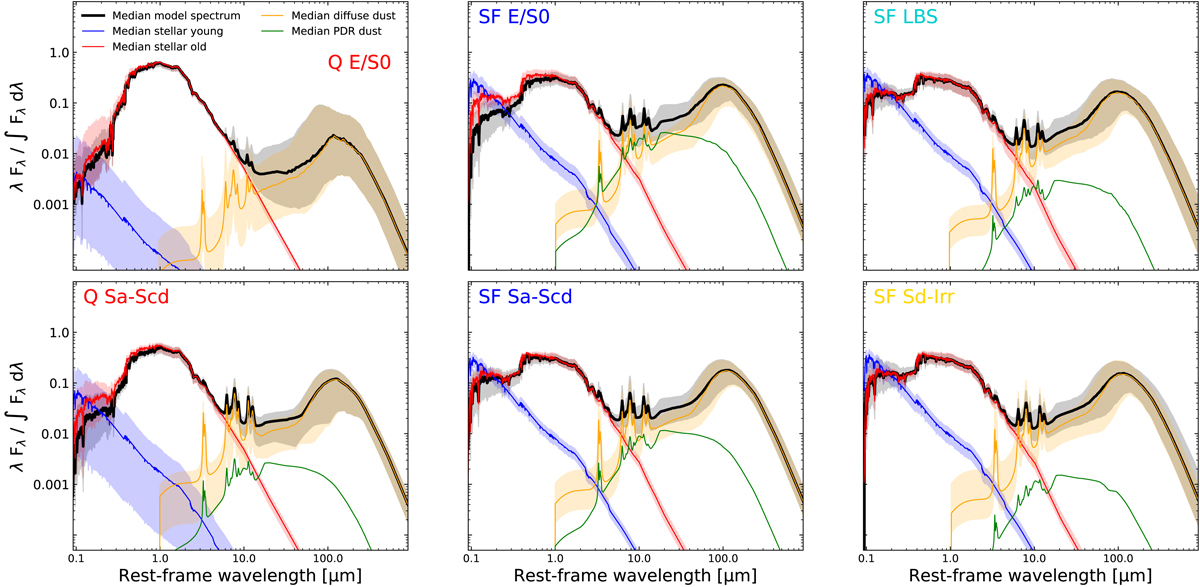
Median SEDs of the GAMA ETGs (top panels) and the LTGs (bottom panels). The median total luminosity of each sub-class is indicated in black, while the old and young stellar components are shown in red and blue, respectively. The orange curve stands for the diffuse dust, while dust in PDRs is shown in green. Shaded areas correspond to the 16th–84th percentile range.
Current usage metrics show cumulative count of Article Views (full-text article views including HTML views, PDF and ePub downloads, according to the available data) and Abstracts Views on Vision4Press platform.
Data correspond to usage on the plateform after 2015. The current usage metrics is available 48-96 hours after online publication and is updated daily on week days.
Initial download of the metrics may take a while.