Open Access
Fig. A.1.
Download original image
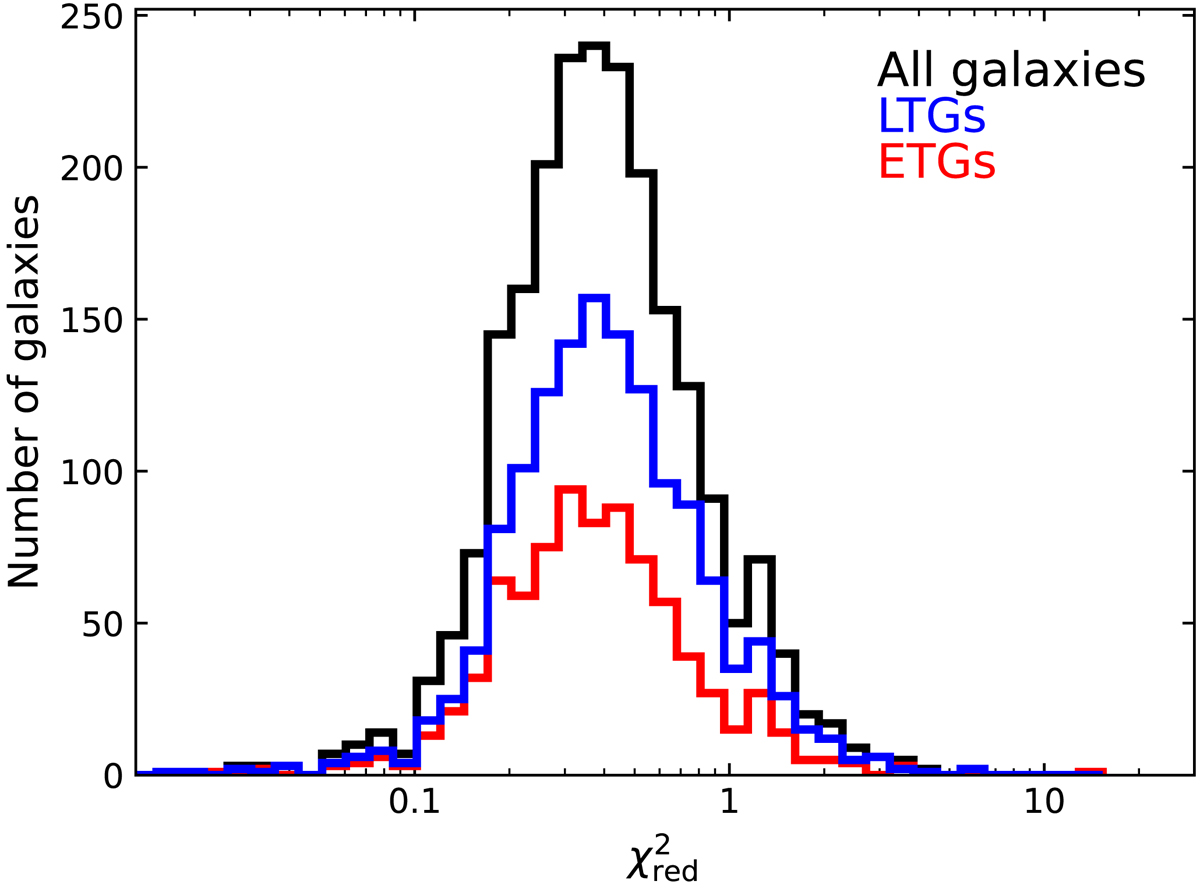
Distributions of the reduced χ2 for the 2,209 galaxies modelled with CIGALE (black line). The distributions of ETGs and LTGs are plotted in red and blue, respectively.
Current usage metrics show cumulative count of Article Views (full-text article views including HTML views, PDF and ePub downloads, according to the available data) and Abstracts Views on Vision4Press platform.
Data correspond to usage on the plateform after 2015. The current usage metrics is available 48-96 hours after online publication and is updated daily on week days.
Initial download of the metrics may take a while.