Fig. 17.
Download original image
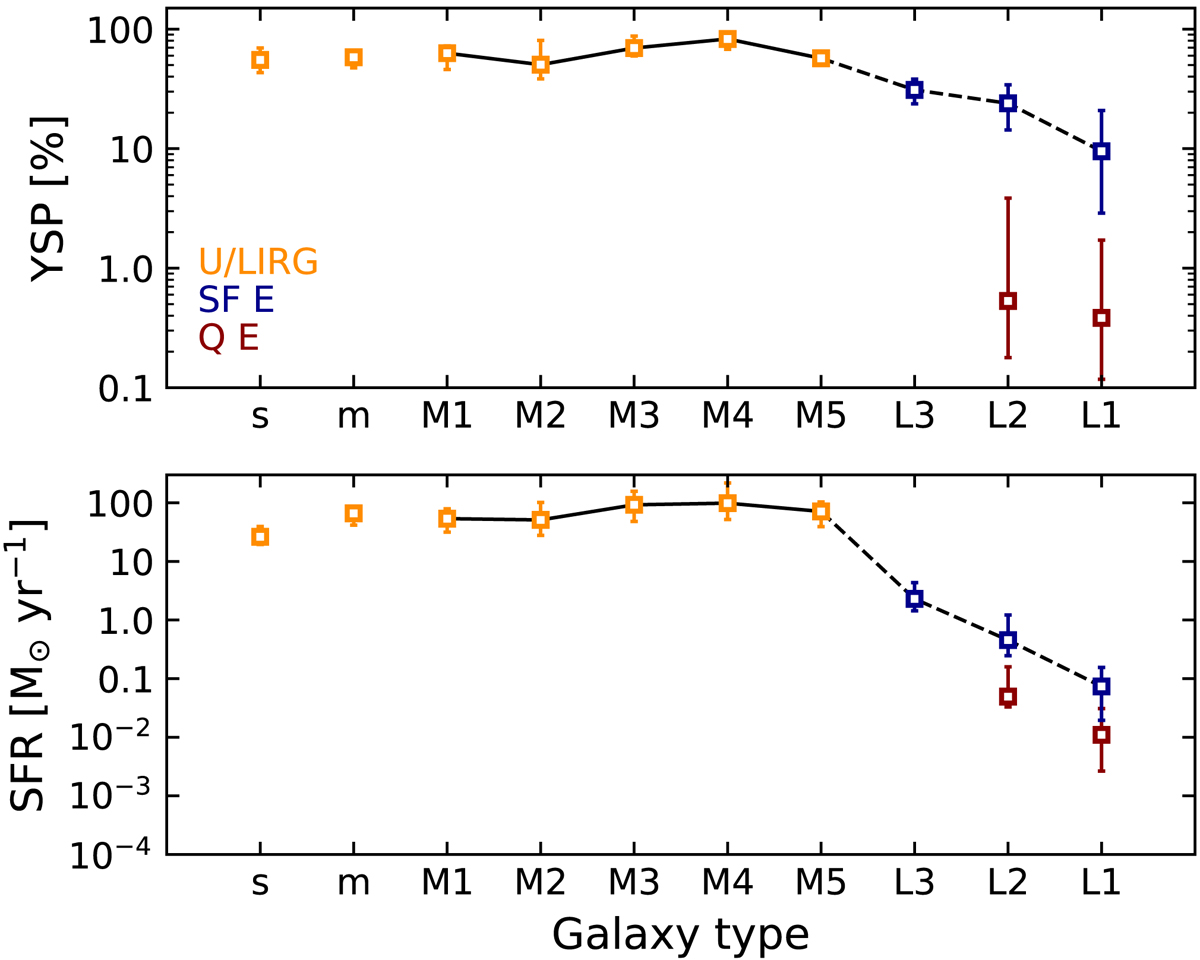
Evolution of young stellar population (YSP; top panel) and SFR (bottom panel), along the U/LIRGs merging sequence and the post-U/LIRG phase. U/LIRGs from Paspaliaris et al. (2021) are shown in orange, while SF Es and Q Es are represented by blue and red squares, respectively. Error bars indicate the range between the 16th and 84th percentiles from the median. A black line connects the median values indicating the general trend.
Current usage metrics show cumulative count of Article Views (full-text article views including HTML views, PDF and ePub downloads, according to the available data) and Abstracts Views on Vision4Press platform.
Data correspond to usage on the plateform after 2015. The current usage metrics is available 48-96 hours after online publication and is updated daily on week days.
Initial download of the metrics may take a while.