Fig. 14.
Download original image
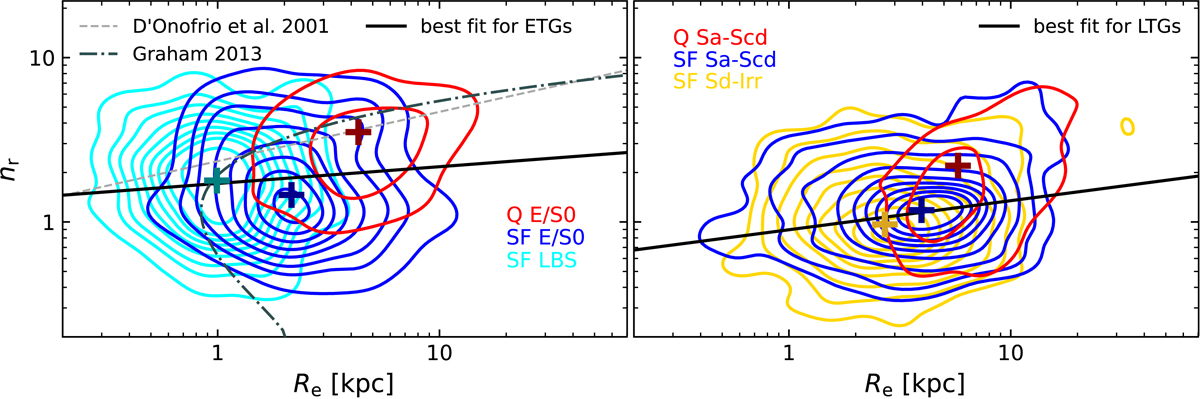
Kernel density estimates for the distribution of different kinds of galaxies in the nr − Re plane. ETGs and LTGs are plotted in the left and right panels, respectively. Different colours indicate different morphologies and star-forming activities (as described in the insets in each panel). The median values of each subset are indicated by ‘+’ symbols. The dashed grey line and the dashed-dotted line are from D’Onofrio (2001) and Graham (2013), respectively (see the text for details).
Current usage metrics show cumulative count of Article Views (full-text article views including HTML views, PDF and ePub downloads, according to the available data) and Abstracts Views on Vision4Press platform.
Data correspond to usage on the plateform after 2015. The current usage metrics is available 48-96 hours after online publication and is updated daily on week days.
Initial download of the metrics may take a while.