| Issue |
A&A
Volume 669, January 2023
|
|
|---|---|---|
| Article Number | A46 | |
| Number of page(s) | 20 | |
| Section | Extragalactic astronomy | |
| DOI | https://doi.org/10.1051/0004-6361/202243399 | |
| Published online | 04 January 2023 | |
Structure and kinematics of a massive galaxy at z ∼ 7
1
Núcleo de Astronomía, Facultad de Ingeniería y Ciencias, Universidad Diego Portales, Av. Ejército 441, Santiago, Chile
e-mail: This email address is being protected from spambots. You need JavaScript enabled to view it.
2
Las Campanas Observatory, Carnegie Institution of Washington, Casilla 601, La Serena, Chile
3
Cavendish Laboratory/Kavli Institute for Cosmology, University of Cambridge, 19 J. J. Thomson Ave., Cambridge CB3 0HE, UK
4
Department of Physics, University of Oxford, Denys Wilkinson Building, Keble Road, Oxford OX1 3RH, UK
5
Leiden Observatory, Leiden University, 2300 RA Leiden, The Netherlands
6
Joint ALMA Observatory, Alonso de Cordova 3107, Vitacura, Santiago, Chile
7
Institute of Astrophysics, Foundation for Research and Technology-Hellas (FORTH), Heraklion 70013, Greece
8
School of Sciences, European University Cyprus, Diogenes street, Engomi, 1516 Nicosia, Cyprus
9
Departamento de Astronomía, Universidad de Concepción, Barrio Universitario, Concepción, Chile
10
Kavli Institute for Astronomy and Astrophysics, Peking University, Beijing 100871, PR China
11
Astrophysics Research Institute, Liverpool John Moores University, 146 Brownlow Hill, Liverpool L3 5RF, UK
Received:
22
February
2022
Accepted:
22
June
2022
Abstract
Context. Observations of the rest-frame UV emission of high-redshift galaxies suggest that the early stages of galaxy formation involve disturbed structures. Imaging the cold interstellar medium (ISM) can provide a unique view of the kinematics associated with the assembly of galaxies.
Aims. In this paper, we analyze the spatial distribution and kinematics of the cold ionized gas of the normal star-forming galaxy COS-2987030247 at z = 6.8076, based on new high-resolution observations of the [C II] 158 μm line emission obtained with the Atacama Large Millimeter/submillimeter Array (ALMA).
Methods. The analysis of these observations allowed us to: compare the spatial distribution and extension of the [C II] and rest-frame UV emission, model the [C II] line data-cube using the 3DBAROLO code, and measure the [C II] luminosity and star formation rate (SFR) surface densities in the galaxy subregions.
Results. The system is found to be composed of a main central source, a fainter north extension, and candidate [C II] companions located 10-kpc away. We find similar rest-frame UV and [C II] spatial distributions, suggesting that the [C II] emission emerges from the star-forming regions. The agreement between the UV and [C II] surface brightness radial profiles rules out diffuse, extended [C II] emission (often called a [C II] halo) in the main galaxy component. The [C II] velocity map reveals a velocity gradient in the north-south direction, suggesting ordered motion, as commonly found in rotating-disk galaxies. However, higher resolution observations would be needed to rule out a compact merger scenario. Our model indicates an almost face-on galaxy (i ∼ 20°), with a average rotational velocity of 86 ± 16 km s−1 and a low average velocity dispersion, σ < 30 km s−1. This result implies a dispersion lower than the expected value from observations and semi-analytic models of high redshift galaxies. Furthermore, our measurements indicate that COS-2987030247 and its individual regions systematically lie within the local L[CII]-SFR relationship, yet slightly below the local Σ[CII]-ΣUV relation.
Conclusions. We argue that COS-2987030247 is a candidate rotating disk experiencing a short period of stability which will possibly become perturbed at later times by accreting sources.
Key words: galaxies: high-redshift / galaxies: ISM / galaxies: kinematics and dynamics / galaxies: star formation / galaxies: structure
© The Authors 2023
 Open Access article, published by EDP Sciences, under the terms of the Creative Commons Attribution License (https://creativecommons.org/licenses/by/4.0), which permits unrestricted use, distribution, and reproduction in any medium, provided the original work is properly cited.
This article is published in open access under the Subscribe-to-Open model. This email address is being protected from spambots. You need JavaScript enabled to view it. to support open access publication.
1. Introduction
The early stages of the build-up of galaxies are thought to be marked by gas accretion from the intergalactic medium (IGM) as well as from episodes of major galaxy mergers (Kereš et al. 2005; Hopkins et al. 2006; Dekel et al. 2009; Bournaud et al. 2011). These processes provide the fuel for star formation, which is regulated by stellar and AGN feedback (Heckman et al. 2000; Hopkins et al. 2008; Silk 2013; King & Pounds 2015). Furthermore, the far ultraviolet (FUV) photons produced by the first stars and early galaxies could ionize the previously neutral IGM. These effects ultimately led to the era of so-called cosmic reionization, which is believed to have taken place at z ∼ 20 − 6 (Robertson et al. 2015).
Normal star-forming galaxies in the early universe (z ∼ 8 − 6), located close to the knee of the UV luminosity function, are expected to be sufficiently abundant and produce enough ionizing photons to play an important role in the process of cosmic reionization (Dayal et al. 2020; Naidu et al. 2020). Thus, describing the physical properties and mechanisms of assembly of these early systems, through morphological and dynamical studies, remains a fundamental step to understand the formation and evolution of galaxies, as well how these sources influenced the evolution of the universe.
In the last few decades, a large number of studies have taken advantage of the high-angular resolution optical and near-infrared images to investigate the structure of z > 6 galaxies. The Hubble Space Telescope (HST) images, which at these redshifts trace the rest-frame UV emission and, thus the star-forming component of such galaxies as well, have mostly shown (multi-component) clumpy structures, likely indicating an early stage of mass assembly (Capak et al. 2015; Carniani et al. 2018a,b; Bowler et al. 2017; Matthee et al. 2017, 2019; Le Fèvre et al. 2020). The rest-frame UV radiation, however, might be affected by dust obscuration, which can lead to patchy geometry, thereby preventing us from acquiring a reliable picture of the galaxy structures. Observations of the different components of galaxies, including star formation processes, the stars themselves, and the cold interstellar medium (ISM) at wavelengths not affected by dust obscuration, are thus necessary to provide a full description of the galaxy structures and the related mechanisms involved in galaxy growth (Förster Schreiber & Wuyts 2020).
The Atacama Large Millimeter/submillimeter Array (ALMA), thanks to its great sensitivity and angular resolution, has opened a new window on the distribution of the cold ISM by exploring the far-infrared regime through dust continuum and fine-structure emission lines. In particular, the 2P3/2−2P1/2 transition of the singly ionized carbon atom (hereafter [C II]; centered at 158 μm) is one of the brightest cooling lines1 in the far-infrared regime (Stacey et al. 1991, 2010) and a tracer of multiple gaseous phases (cold molecular, neutral, and ionized gas associated with photon-dissociation regions; Wolfire et al. 2003; Vallini et al. 2015; Clark et al. 2019).
At z > 2, the [C II] emission line shifts into the (sub)millimeter atmospheric windows, which are widely accessible from the ground, thus making it a flagship focus of ISM studies of early galaxies. In recent years, a plethora of [C II] line detections have been reported (e.g., Capak et al. 2015; Willott et al. 2015; Harikane et al. 2018; Smit et al. 2018; Carniani et al. 2018a), including those carried out by the ALPINE (Le Fèvre et al. 2020) and REBELS (Bouwens et al. 2022) ALMA large programs that are especially designed to provide [C II] line measurements for normal star-forming galaxies at z = 4 − 6 and z = 6 − 9, respectively. While the number of [C II] detections have increased rapidly (mostly at ∼1″ resolution), only a few observations to date have been able to resolve the [C II] emission at z > 4 to enable the characterization of the galaxy’s structures and kinematics (Neeleman et al. 2020; Rizzo et al. 2020, 2021; Lelli et al. 2021; Herrera-Camus et al. 2021).
The wealth of relatively low-resolution (i.e., ∼1″) observations have shown complex [C II] structures, revealing clumpy, irregular ones in some cases (Inoue et al. 2016; Matthee et al. 2017; Carniani et al. 2018a,b), as well as regular velocity fields in others (Fig. 3 in Smit et al. 2018; Neeleman et al. 2020). In some systems, the brightest regions in [C II] and UV emission do not spatially match, while in others, the presence of [C II] (UV) clumps with no UV ([C II]) counterparts has been reported (Capak et al. 2015; Fujimoto et al. 2020). In a similar vein, several objects display extended [C II] emission when compared to the UV component. It is still unclear what the cause behind this difference is, but some possible explanations include differential dust obscuration, outflows, and infalling satellites (Fujimoto 2019; Fujimoto et al. 2020).
In this paper, we report sensitive ALMA high-resolution [C II] line observations of the typical star-forming galaxy COS-2987030247 (hereafter, COS2987) at z = 6.8076. This system was a z ∼ 7 Lyman-break galaxy candidate with a high [OIII]+Hβ equivalent-width (EW) obtained from optical to infrared spectral energy distribution (SED) modeling (Smit et al. 2015; Laporte et al. 2017), which was later confirmed to be a gas-rich star-forming galaxy based on the detection of its bright [C II] line with ALMA (Smit et al. 2018). Dynamical analyses of the [C II] line velocity field in low-resolution observations (1.1″ × 0.7″, translated to 5.8 × 3.7 kpc at z = 6.8), have suggested that disk rotation could be in place (Smit et al. 2018). Here, we analyze the morpho-kinematic properties of this galaxy and its close environment in detail.
In Sect. 2, we describe the general properties of our target, as well as the ALMA observations. In Sect. 3, we analyze the structure and spatial extension of the [C II] and UV emission, along with a dynamical analysis. In Sect. 4, we discuss the ISM properties derived from resolved measurements of the star formation rate (SFR) and [C II] surface densities. We discuss the implications of our results in the context of cosmic evolution of the intrinsic velocity dispersion of rotating disks. In Sect. 5, we list the main results. We assume a standard ΛCDM cosmology with: ΩΛ = 0.7, ΩM = 0.3, H0 = 70 km s−1 Mpc−1 throughout the paper, leading to a physical conversion of 5.312 kpc/″.
2. Data
2.1. Target
COS2987 is a star-forming galaxy located at z = 6.8076 ± 0.0002 2018smit. It was initially detected as a Lyman-break galaxy by Smit et al. (2015) in the CANDELS/COSMOS field (Scoville et al. 2007; Koekemoer et al. 2011). Rest-frame UV to far-infrared observations, as well as SED modeling indicate a massive star-forming galaxy, located within the expected main-sequence of star formation at this redshift, and low dust content due to a non-detection of dust continuum emission (Smit et al. 2018). The multi-wavelength SED (including 4.5 μm Spitzer/IRAC band) yields a stellar mass of  (Smit et al. 2018). Measurements of Lyman-α line emission indicates a broad and strong emission compared to other sources at the same redshift (Laporte et al. 2017).
Smit et al. (2018) identified tentative evidence that the galaxy is a rotating system based on the detection of the [C II] line emission using ALMA observations at ∼0.8″ resolution (PI: Smit et al. 2018, ALMA ID: 2015.1.01111.S). This finding makes the galaxy a unique target for confirmation of its dynamical state, given that most systems at z > 5 showed clumpy irregular morphology (Capak et al. 2015). The main physical properties of COS2987 from the literature as well as those derived from this work are listed in Table 1.
Observational and physical properties of COS2987.
2.2. ALMA observations
ALMA observations were obtained during Cycle 5 in the C43-5 configuration with 43 antennas, (PI: Aravena, PID: 2018.1.01359.S), with 3.6 h on-source integration time. The ALMA band 6 receivers were used to target the redshifted [C II] line emission at 243.3465 GHz. Observations were taken with four spectral windows (SPWs), each with a total bandwidth of 1.875 MHz, and a native channel resolution of 7.813 MHz (≈9.6 km s−1). One of the SPWs was centered on the [C II] emission line and the rest of the SPWs were used to measure the underlying continuum emission.
We combined the new ALMA Cycle 5 data with previous lower resolution observations from the original [C II] detection (PID: 2015.1.01111.S; Smit et al. 2018). These observations took 24 min of on-source integration. These data add important information on shorter baselines, which are sensitive to extended emission. The lower and higher resolution data sets were calibrated with the Common Astronomy Software Applications package pipeline (CASA; McMullin et al. 2007), using versions 4.5.3 and 5.4, respectively. The quasar J0948+0022 was used as the phase calibrator for both observations, while J1058+0133 and J0854+2006 were chosen as amplitude calibrators for the previous and latest data sets, respectively. No additional flagging was deemed necessary given the good quality of the observations.
We employed the tclean task to generate a continuum image and a data cube for the SPW containing the [C II] emission line, using natural weighting to preserve sensitivity. To obtain a continuum image, we used all the channels in each SPW, excluding the ones within the velocity range [−250, 250] km s−1, centered at the line. For the cube, we binned the data to a channel resolution of 30 km s−1, which is a compromise between the sensitivity and velocity resolution. The cleaning was done interactively until no significant emission was left in the residual. Since no continuum emission was detected, we did not perform a continuum subtraction in the uv plane. This procedure yielded a noise level of 6 μJy beam−1 and 0.134 mJy beam−1 for the continuum image and line cube, respectively, and a synthesized beam size of 0.44″ × 0.35″ (PA = 50deg; natural weighting). This scale translates into a physical size of 2.3 × 1.8 kpc2, at z = 6.84. The angular resolution obtained for previous observations of this galaxy is about two times coarser: 1.07″ × 0.72″, corresponding to 5.7 × 3.82 kpc2 (Appendix A).
2.3. Ancillary data
We used the F160W-band image (λrest−frame ∼ 2050 Å) obtained with the Wide Field Camera 3 (WFC3) of the HST from the CANDELS survey (PI: Sandra Faber, ID: 12440). It yields a view of the rest-frame near-UV emission at the redshift of the source. Rest-frame UV images are also available from the F125W-band (Koekemoer et al. 2011). We chose the F160W-band for the spatial analysis, mostly for consistency with the analysis conducted by Smit et al. (2018). The F125W-band was employed to measure the SFR, since it represents a rest-frame far-UV regime (λrf ∼ 1600 Å). Both F160W and F125W images have a point spread function (PSF) of 0.18″, a pixel scale of 0.06″/pix and have been astrometrically matched to the Gaia DR2 release (Gaia Collaboration 2018).
3. Results
3.1. Spatial distribution
We analyzed the spatial distribution of the rest-frame UV emission, traced by the HST F160W-band image, and the [C II] line emission from ALMA, in the left panel of Fig. 1. We find a good match between the spatial distribution of both emissions, particularly in the central region where most of the [C II] emission is detected. There is a small offset of 0.118″ (corresponding to 0.628 kpc) between the centroids of UV and [C II] emissions, which is less than the HST PSF and the ALMA beam size. Hence, we do not find any divergent locations for the UV and [C II] emission, as it has been observed in other objects at similar redshifts. We refer to this central region as the ‘C’ component in the left and central panel of Fig. 1. A 0.5″-circular aperture photometry reveals a [C II] line flux of 0.15 ± 0.02 Jy km s−1, which corresponds to an 8.4σ detection.
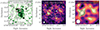 |
Fig. 1. Rest-frame UV and [C II] line maps of the galaxy COS2987 and its surroundings. Left: HST F160W-band image in the background shows the rest-UV emission in a 1.3″ × 1.3″ region around the galaxy. The [C II] integrated map (moment-0) is overlaid as black contours shown at 2-, 4- and 6-σ, where σ is the rms noise level of the moment-0 map. The region containing the foreground galaxy identified by Laporte et al. (2017) is highlighted by the purple line. Middle: zoom-out version of the [C II] moment-0 map toward COS2987 (6″ × 6″). The region shown in the left panel is represented by the dashed white line. We marked the locations of the central source (C), north-east emission (N1), north-west arm (N2), west emission (W1), and south-west emission (W2). The black contours represent the integrated [C II] line emission at 2-, 3-, 4-, 5-, and 6-σ levels and the dashed white contour represents the -2-σ level. The white star corresponds to a galaxy observed in the F160W-band map at zphot = 1.73 (Laigle et al. 2016). Right: [C II] line integrated map tapered to a 1″ beam size, showing the same region as in the central panel. The black contours represent the 2-, 4-, 6-, 8-, and 10-σ levels and the dashed white contour represents the -2-σ level. |
To the north of C, we find two clumpy structures traced by both the UV and [C II] emissions. One of them extends to the north-east, referred as “N1”, and the other resembles an arm-shaped structure to the north-west, labeled as “N2”. Component N1 is located 0.60″ north-east from C (measured at the centroids of C and N1 in the [C II] image), while N2 is located at 0.73″ north-west from C. This corresponds to a projected physical distance of 3.2 and 3.9 kpc for N1 and N2, respectively. Given the moderate significance of each of these structures, we performed aperture photometry to measure their individual [C II] fluxes. We find that N1 and N2 have integrated [C II] line fluxes of 0.02 ± 0.01 Jy km s−1 and 0.07 ± 0.02 Jy km s−1, yielding significances of 2.2σ and 4.1σ, respectively (Appendix B). We highlight the fact that these components were not seen by Smit et al. (2018), mainly because of the lower depth, and were likely blended with the main source.
Laporte et al. (2017) indicated that the rest-UV source associated with N1 corresponds to a foreground galaxy at zspec = 2.099. Based on this, and given that the candidate [C II] emission is of low significance, we consider it as a foreground object. Thus, for further analysis, we mask out the region within N1, which corresponds to the purple contour in the left panel of Fig. 1. In the case of N2, the significance of the [C II] line emission and its extended structure suggest that this is associated with the main galaxy C at z ∼ 7. The F160W-band image also shows an extended UV emission in the north-west of the central galaxy C, but not perfectly colocated to N2.
To check for the existence of other emitting regions at the redshift of the main galaxy, we searched for [C II] emitters in the wider field of the ALMA [C II] map (Fig. 1, center). Two other sources are identified as candidate [C II] line emitters to the west and south-west of COS2987 (labeled as W1 and W2, respectively). They are located at 15 kpc and 12 kpc from the central source C, with flux densities of 0.10 ± 0.03 Jy km s−1 (∼5.2σ) and 0.06 ± 0.02 Jy km s−1 (∼3.6σ), respectively. We only found a UV counterpart in the F160W image (Appendix A) to source W1, located at 0.95″ from the peak [C II] emission and marked as a white star in Fig. 1 (central panel). It is consistent with a photometric redshift of 1.73 based on the COSMOS2015 catalog (Laigle et al. 2016). The lack of a counterpart for W2 supports the fact that the candidate [C II] positive signal is spurious. Furthermore, the significant distance between the UV counterpart to W1 and the conflicting photometric redshift of this source imply either that this is not the actual counterpart, in which case the [C II] emission might be real but without a UV counterpart, or that the candidate [C II] line is a noise feature. The spectra centered at the [C II] observed frequency of C, N1+N2 and W1 are shown in Fig. 2.
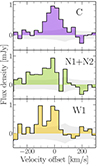 |
Fig. 2. Spectra ranging from −300 to 300 km s−1 centered at the [C II] observed-frame frequency at z = 6.8076 (243.3465 GHz), based on a channel resolution of 30 km s−1. The gray region corresponds to the rms per channel. The spectra represent the: (a) Upper panel: central source C; (b) Central panel: N1+N2 emissions; and (c) Bottom panel: west emission. The regions are marked in Fig. 1. |
A 1″-tapered map (to maximize the extended emission significance of the emitters; Fig. 1, right) reveals a tentative detection of the clumps, but the low significance of W2 and N2 require deeper observations to confirm or discard the sources. Finally, we performed two extra tests to check the reliability of the candidates. We started by splitting the visibility data into two different groups of observing scans (both containing scheduling blocks from the previous and latest data), and recreated the [C II] cubes and maps. We could recover sources N2 and W1, but we were not able to locate W2 in both maps, indicating that the latter is likely to be the product of a noise pattern. Secondly, we explored the moment-0 maps with different weightings and taperings to exclude the possibility that the four candidates are artifacts generated by the side-lobes of the beam. The candidates become fainter in the moment-0 maps, particularly when we use uniform parameters below 1. Nevertheless, as we combine the standard Briggs weighting with a uniform parameter of 0.5, and taper the visibilities, the N2 and W1 candidates still remain with moderately significance. Deeper observations will be key to ultimately confirm or reject the reality of these surrounding candidates sources.
3.2. Radial profile and sizes
We aimed to quantify whether the ISM component traced by the [C II] line emission has a similar spatial distribution to the star-forming component traced by the rest-UV emission. Thus, we measured their effective sizes and compared their radial profiles. We first fit a two-dimensional (2D) Sérsic profile (Sérsic 1963) to the [C II] brightness distribution in the moment-0 map and UV map using a Markov chain Monte Carlo (MCMC) approach (see Appendix C). The Sérsic profile is mainly composed of two parameters: the Sérsic index, n, which describes the curvature of the profile, and the effective radius, reff defined as the radius at which half of the total brightness was emitted. We convolved the intrinsic and not inclination-corrected model with the synthesized beam before making a comparison with the moment-0 map. We obtained a consistent radial profile distribution with ![Mathematical equation: $ n_{\mathrm{[CII]}}=1.62^{+0.59}_{-0.43} $](/articles/aa/full_html/2023/01/aa43399-22/aa43399-22-eq7.gif) and reff, [CII] = 0.47″
and reff, [CII] = 0.47″
 (∼2.3 kpc), but with a largely unconstrained nUV, possibly due to the faint data. When we set n = 1, we found a compatible effective radius for both components: reff, [CII] = 0.38″
 (∼2 kpc) and reff, F160W = 0.31″
 (∼1.6 kpc). In our further analysis, we stick with n = 1 to maintain consistency with other analyses in the literature (Fujimoto et al. 2020).
COS2987 has one clear component extending to the north-west (N2), as suggested by both the [C II] and rest-UV maps. This prompted us to compare the extension of the [C II] and rest-UV emission in the source (C + N2) and thus check for an extended [C II] halo. We measured the radial surface brightness profile in concentric rings as a function of radius. This procedure is not available for the dust component of the galaxy, since there is no detection of the continuum emission.
Since the ALMA [C II] and F160W rest-UV maps have different angular resolutions, we followed the procedure described in Fujimoto et al. (2020). We convolved the ALMA (HST/F160W) image with the HST/F160W (ALMA) PSF, generating a resolution of 0.47″ × 0.40″, which translates to 2.5 × 2.1 kpc2 in physical size. For each image, we computed the surface brightness measuring the [C II] and rest-UV flux in 0.2″-width rings, covering the region from the central peak to the end of the N2 structure. As stated in the previous section, there is a foreground galaxy located to the north-east (N1) of the central source. Thus, we masked the pixels corresponding to this structure in both the ALMA and HST/F160W images. However, given its faintness, the choice of whether or not we include this region reveals no significant difference in the resulting radial profile.
The [C II] and rest-UV emission radial profiles are shown in Fig. 3 and they are in good agreement within the uncertainties. There is a slight increase in [C II] emission for the region closer to the north arm N2 (r ∼ 0.6″), however, it does not represent a substantial difference compared to the rest-UV. We find that the [C II] emission in this case closely follows the rest-UV emission, in shape and size. Since we do not recognize major differences between the [C II] and rest-UV profiles, we conclude that COS2987 does not contain a particularly extended [C II] emission or a [C II] halo.
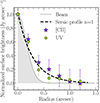 |
Fig. 3. Radial profile of the surface brightness of the UV continuum (green circles) and [C II] line (purple stars). Each map is convolved with the PSF/beam of the other image to match the resolution of 0.47″ × 0.40″. There is no detection of a dust continuum, therefore no radial profile is shown. As a reference, we added the radial profile of the convolved beam and a exponential profile (Sérsic index = 1) with a reff = 0.38″ as a solid gray line and dashed black line, respectively. |
3.3. Dynamical analysis
Based on low-resolution ALMA [C II] line imaging, Smit et al. (2018) identified a tentative velocity gradient suggesting that a rotating disk is in place in this galaxy. Thus, we analyzed the current dynamical state of COS2987 based on our higher-resolution data. Figure 4 shows the velocity field and dispersion maps (in the left and central panels, respectively) of the central source (C) and north arm (N2). These maps were generated considering the pixels with fluxes above 2 × the rms per channel from a cube with a channel resolution of 30 km s−1. We also only display pixels with a [C II] emission significance greater than 2.5-σ in the moment-0 map. The N2 structure does not show a clear trend, due to its fainter nature. Conversely, we confirmed a north-south velocity gradient across the central source (C). The velocity dispersion map is fairly homogeneous, with a low mean dispersion of 29 km s−1 and a scatter of 12 km s−1. The position-velocity diagram along the major axis of the velocity field (top right panel of Fig. 4) suggest a tentative pattern typical of rotating disks, as an increase of the radial velocity with the distance to the center of the galaxy and a flattening after a certain radius. However, this cannot be confirmed due to the limited sensitivity of the observations.
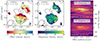 |
Fig. 4. Velocity (Moment-1) and dispersion (Moment-2) maps of the galaxy COS2987 (with respect to the observed frequency of [C II] at redshift z = 6.8076) are shown in the left and right panels, respectively. The black contours correspond to the 2-, 4-, 6-σ levels of the [C II] integrated (moment-0) map. In the right panel, we plot the position-velocity diagram of slits 1 and 2, shown on the left panel as dashed lines. The black contours correspond to the 2-, 3-, and 4-σ levels of the position-velocity diagram. |
We performed a dynamical modeling of our data cube with the 3DBAROLO code (Di Teodoro & Fraternali 2015). If we assume that COS2987 has a rotating gaseous disk, the modeling retrieves the kinematic parameters of the galaxy, such as the rotational and dispersion velocities. We discuss some of the scenarios that could lead to a gradient in the velocity map in Sect. 4.3.
3DBAROLO is based on a tilted-ring model in the case of a galaxy disk. It divides the model in a given number of concentric rings in order to provide a fit to the observed data cube, taking into account the three spatial and three velocity dimensions. To construct the model, initial guesses of all the parameters need to be provided: the disk position angle, central position of the disk, systemic velocity of the system, radial and rotational velocity, dispersion velocity, inclination, and thickness of the disk. This disk model is then convolved to the original data beam size so that the degraded product can reproduce the real data; the code can thereby deal with effects due to the resolution, such as beam smearing. The initial iterations begin in the inner annuli and if the parameters reproduce the data well, the code steps up to the next annuli. Otherwise, it updates the parameters until it finds the best fit.
We applied this modeling to the [C II] data cube. Using channel resolution higher than 30 km s−1, the performance of the fitting routine failed due to the low signal-to-noise per channel. We considered as a detection per channel any emission with intensity equals to or greater than 0.2 mJy beam−1 (2× the mean rms per channel). We also masked the region to consider pixels with significances above 2.5× the rms of the moment-0 map. We fixed the central position (x0, y0) on the centroid of the emission in the moment-0 map. The moment 1 map indicates a velocity gradient tilted by nearly 180deg from the negative y-axis, so we set this value as an initial guess position angle, and we allowed it to vary between 170 − 190deg. We let the systemic velocity as a free parameter, since the peak of the line emission seems to be offset by ∼−10 km s−1 from the [C II] observed frequency. We also fixed the radial velocity at 0 km s−1 since the depth and resolution cannot allow for the detection of outflows from stellar or AGN feedback. As a final step, we let the code run in three concentric rings, with a width of 0.18″. It satisfactorily covers the central source and excludes the north-arm region.
As often pointed out by previous studies (Rizzo et al. 2020; Fraternali et al. 2021), the initial inclination has a crucial influence on the best-fit model. Therefore, we performed trial-and-error tests with initial inclination guesses ranging from 0deg to 90deg and calculated the residuals (|data – model|, weighted by the moment-0 map) in the velocity and dispersion maps. The residuals are lowest when we consider low inclination values (Appendix D). The galaxy has a close to round shape, which likely means that it is close to a face-on configuration. Using these criteria, the galaxy agrees with a system tilted by ∼15deg. So, we set as an initial guess an inclination of 23deg, based on the minimized value found from the velocity and dispersion map.
In Figs. 5 and 6, we show the rotational and dispersion products for the best-fit model. We recovered an average rotational and dispersion velocity of 86 ± 16 km s−1 and 26 ± 16 km s−1, respectively. However, we preferred to consider in the following analysis the average velocity dispersion as an upper limit of 30 km s−1, since the data cube channel resolution is greater than the value found by the code. Smit et al. (2018) identified an observed velocity difference of 54 ± 20 km s−1, which is tentatively lower than the average rotational velocity found here. However, such value could be strongly affected by the blending of the central source (C) and north arm (N2) due to the lower resolution of the data.
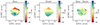 |
Fig. 5. Rotational velocity products of the tilted-ring model fitting obtained using 3DBAROLO. The maps are shown in the velocity range of [−60, 30] km s−1 with respect to the observed frequency of the [C II] line at z = 6.8076. Left: observed velocity map of COS2987. Middle: velocity map of the best-fit model with a inclination of i = 23deg. Right: residuals of the velocity map. |
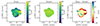 |
Fig. 6. Dispersion velocity products of the tilted-ring model fitting obtained using 3DBAROLO. The left and central maps are shown in the velocity range of [0, 50] km s−1 and the left map in the velocity range of [−20, 20] km s−1, with respect to the observed frequency of the [C II] line at z = 6.8076. Left: observed dispersion velocity map of COS2987. Middle: dispersion velocity map of the best-fit model with a inclination of i = 23deg. Right: residuals of the dispersion velocity map. |
4. Discussion
4.1. IR emission
We did not detect any far-infrared (FIR) continuum (Appendix A), leading to an upper limit (3σ) for the IR luminosity of  ≤ 1.15 × 10¹⁰ L⊙, assuming a single-component modified black body (MBB) approach and considering βIR = 1.6 and Tdust = 53 K (Eales et al. 1989; Klaas et al. 1997; Bouwens et al. 2020). This infrared luminosity can be translated into SFRIR ≲ 1.7 M⊙ yr−1, for the calibration provided by Kennicutt & Evans (2012) (Kroupa IMF), which is nine times lower than that estimated for the UV emission (see Sect. 4.2). Despite the non-detection of the dust continuum emission, the galaxy shows a red UV continuum slope of βUV = −1.18 (Smit et al. 2018), which indicates some dust absorption. This value is also much redder compared to βUV ∼ −2, which is the mean value expected for galaxies at z ∼ 7 (Dunlop et al. 2013; Bouwens et al. 2014, 2016). This suggests that COS2987 has either a slightly older stellar population than other galaxies at this redshift or is more dust obscured (or both).
The low infrared luminosity points to a lower IR excess (IRX = LIR/LUV ≤ 0.12) compared to the upper limit found by Smit et al. (2018). A similar non-detection of dust emission is seen in normal galaxies at z = 5 − 6 (Capak et al. 2015) and it could indicate a warmer dust, which can underestimate the infrared luminosity based on a MBB approach. It follows the conclusion of Fudamoto et al. (2020) and previous studies, which indicate a fast evolution of the ISM conditions in the first 4 billion years of the Universe. An alternative scenario for the non-detected dust emission is that the galaxy contains dust that is cold enough to be completely diluted by the cosmic microwave background, TCMB(z = 6.8076)∼22 K. However, we are limited with regard to our ability to infer how cold the dust needs to make the continuum undetectable at 158 μm, because this is strongly dependent on the optical depth assumption for the gas.
Finally, the galaxy has a lower-limit line to continuum luminosity ratio of [C II]/FIR ≥ 0.015, comparable to values found for nearby low-metallicity dwarfs and star-forming galaxies (0.1%–1%, Herrera-Camus et al. 2018). A similar finding was obtained for the non-dust-detected normal galaxies at z = 5 − 6 from Capak et al. (2015) (mean log[CII]/FIR ∼ −1.75 for the typical upper-limits of LIR ≲ 10.3). Such high ratios suggest a lower dust-to-gas ratio or more diffuse clouds than normal galaxies at z ∼ 0 (or both). Our results for COS2987 further confirms that the dust continuum emission is difficult to detect in galaxies at the Epoch of Reionization, even with the new ALMA sensitive observations. We still need to test the hypothesis that low metallicity or warm and cold dust components are the main culprits for such a lack of detections.
4.2. Resolved ΣSFR vs. ΣCII
In the past decade, a tight correlation between the [C II] luminosity and the total SFR in nearby, un-obscured star-forming galaxies has been established (z ∼ 0, De Looze et al. 2011; Herrera-Camus et al. 2015). The efforts to provide a similar relation for the early Universe reveal that this relation still exists (e.g., Schaerer et al. 2020), but it features a higher dispersion (Carniani et al. 2018a). This suggests that the physical conditions of high-redshift galaxies may vary significantly from galaxy-to-galaxy, affecting how we link the star forming activity to the ISM conditions. Furthermore, the observed relation of the SFR and [C II] luminosity surface densities in high-redshift galaxies shows an offset from the local relation, indicating a possible [C II] deficiency or a more extended [C II] effective radius with respect to the star forming components.
We performed a global (integrated) and resolved analysis of the relation between the SFR and [C II] luminosity and surface densities in COS2987. We defined apertures throughout the source and measured the corresponding fluxes (luminosities) in the ALMA [C II] and HST/F125W rest-UV maps. Given the lack of dust continuum detection in our data, we assumed that the SFR is largely dominated by the rest-UV emission and, thus, the SFRtot≃ SFRUV. We used the flux measured in the HST/F125W band as a tracer of the rest-UV emission and converted the corresponding luminosity to SFR using the calibration provided by Kennicutt & Evans (2012) and a Kroupa IMF (Kroupa & Weidner 2003). For the global measurement, we defined an aperture of 0.5″ radius (2.7 kpc), which roughly corresponds to the size of the central region of the galaxy C (as defined in Sect. 3.1). For the resolved measurements, we divided the source into nine subregions, defined by apertures of a 0.2″ radius. The central and subregions are labeled from 1 to 9 in Fig. 7 top and bottom left panels. The circle labeled as 9 corresponds to the foreground galaxy discussed in Sect. 3.1; therefore, we discarded any further analyses for this region.
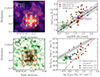 |
Fig. 7. LCII-SFR and Σ[CII]-ΣSFR relations for the galaxy COS2987 and its minor components. Upper-left panel: [C II] moment-0 map with the regions considered as the whole system of COS2987 and its substructures highlighted as a yellow dashed circle and red circles, respectively. The regions within COS2987 are number as displayed in the figure. The dashed-dotted white line shows the 2-σ significance level of the galaxy. Bottom-left panel: F125W-band map with the same regions displayed in the upper left panel. The 2-σ significance level of the [C II] moment-0 map is shown as a black dashed-dotted line. Upper-right panel: LCII-SFR relation. The single system of COS2987 and its substructures are displaced as a purple diamond and thin green/white diamond, respectively. As a reference, the single system and their corresponding substructures of galaxies at z = 5 − 6 are represented as red circles and orange stars, similarly as the original study (Carniani et al. 2018a). Normal star-forming galaxies from the ALPINE survey (Schaerer et al. 2020) are represented as black circles. The black solid line and filled area describes the best-fit for the distribution of galaxies at z ∼ 0 (De Looze et al. 2014). Bottom-right panel: Σ[CII]-ΣSFR relation. The lines and points are the same from the upper right panel, except for the black solid line and filled area that corresponds to the local Σ[CII]-ΣSFR relation by Herrera-Camus et al. 2015. The dashed black line represents the best-fit for the galaxies and its respective clumps (Carniani et al. 2018a). |
Figure 7 (top and bottom right panels) shows the global (dashed-yellow) and subregion (solid-red) apertures along with the measured L[CII]-SFR and Σ[CII]-ΣSFR relations of these regions. For comparison, we displayed measurements from Carniani et al. (2018a) (C18, in Fig. 7) in normal star-forming galaxies at z = 5 − 7 and from Schaerer et al. (2020) in ALPINE star-forming galaxies at z = 4 − 6. In the former case, measurements are provided for the full single systems (represented by red circles in Fig. 7) and their clumps (yellow stars), with the SFR defined as SFRUV + SFRIR (SFRs of galaxies with no dust continuum detection are defined as SFR ∼ SFRUV). For the ALPINE galaxies, the only integrated measurements of each galaxy are provided, and the SFRs were obtained by SED fitting.
Our target, COS2987, is shown as a purple diamond and the resolved measurements as thin diamonds. Since some apertures (labeled as 2, 4, 6, and 8; Fig. 7, left panels) are overlapped with the central one (labeled as 5) and may have considerable emission from the central region; we separate them in non-filled thin diamonds. The other spatially independent apertures (labeled as 1, 3, 5, 7, and 9; Fig. 7) are shown as green filled diamonds. The galaxy lies within the nearby [C II]-SFR relation (Fig. 7; top right panel). It also holds for the resolved measurements, which follow a similar trend of increasing [C II] luminosity with increasing SFR. This subregions are concentrated at a particular [C II] – SFR range, indicating a homogeneous, non-complex structure. This result for the single system is consistent to the previous finding from Smit et al. (2018).
The bottom right panel of Fig. 7 demonstrates how the spatial distribution is correlated with the [C II] luminosity and SFR. The positive correlation of galaxies at z = 5 − 6 is displaced from the local relation, such that galaxies and their substructures have a lower [C II] luminosity than previously expected (dashed black line; Carniani et al. 2018a). The [C II] and SFR surface densities of the integrated and resolved measurements of COS2987 are defined at the effective radius of the [C II] and UV emission, respectively. In this case, both the global system and subregions locate slightly below (within 3σ of) the local Σ[CII] − ΣUV relation (black solid line and gray area; Herrera-Camus et al. 2015). These results for both relations support the scenario shown by previous studies, where a [C II] deficiency may be in place in high redshift galaxies, even for galaxies which tightly follow the local LCII-SFR relation. In any case, COS2987 and its subregions are closer to the local relation than we would expect from the high-z relation from C18, hinting that the physical conditions are closer to local galaxies than in previous detections.
The high line-to-continuum ratio [C II]/LIR ≥ 1.5% and the fact that COS2987 lies within the local LCII-SFR relation evidence different physical mechanisms causing the [C II] deficit than those taking place in high-infrared-luminosity starbursts (CII/FIR ∼ 0.1%−0.01% Herrera-Camus et al. 2018). The [C II] deficiency could be a consequence of an underestimation of the LCII, as (Carniani et al. 2020) reported fluxes losses of 20–40% when the angular resolution is comparable to the size of the emitting region. Our high-resolution observations were combined to the shorter baselines of the previous low-resolution data set, and the latter has a 0.8″ resolution sufficiently greater than the typical [C II] emission size of COS2987 (∼0.5″ obtained by a Gaussian fit in the moment-0 map). Therefore, we conclude that this observational feature has no influence on the [C II] deficiency in COS2987.
Recent PDR models and simulations attribute the existence of [C II] under-luminous normal galaxies as a consequence of multiple conditions in the ISM such as a positive deviation from the Kennicutt-Schimidt relation (due to a starburst phase), low metallicity, and low gas density (Ferrara et al. 2019). Unless Z < 0.1 Z⊙, the metallicity and low gas density just play a sub-dominant role in the [C II] deficiency (Vallini et al. 2015; Lagache et al. 2018; Pallottini et al. 2019; Lupi & Bovino 2020). Any combination of these effects could be at play in COS2987, although such a low metallicity (Z < 0.1 Z⊙) would move COS2987 below the local LCII-SFR relation.
In any case, the [C II] emission cannot fully characterize the ionization state of COS2987 and thus disentangle the degenerate contribution of these parameters. Therefore, other far-infrared (FIR) lines, such as [O III]88 μm and [C III], are necessary to entirely resolve this tension (Vallini et al. 2020, 2021; Carniani et al. 2020).
4.3. Dynamical state and evolution of σ
4.3.1. Alternative scenarios
In Sect. 3, we characterized the velocity map of COS2987 with a velocity gradient (Fig. 4) and a homogeneous velocity dispersion map typical of rotating-disk galaxies, as previously pointed out by Smit et al. (2018). Nevertheless, this might not exclusively be produced by a rotating pattern, especially when it is associated with limited-resolution data. We thus consider two other possible origins to describe the observed velocity gradient in the galaxy: (i) flux of gas towards the circumgalactic medium caused by stellar and AGN feedback and (ii) major mergers. If it is not satisfactorily spatially resolved, both cases can reproduce in the velocity map blueshifted and redshifted lobes smoothed by the beam size. We discuss the reality of these scenarios as follows:
First, outflows can increase the dispersion of the system and add a broad component to the spectrum. Resolved observations and stacking spectrum of normal star-forming galaxies at z > 5 show an extra component with a typical FWHM of a few hundreds of km s−1 (Ginolfi et al. 2020; Herrera-Camus et al. 2021). To test this, we fit a two-component Gaussian profile (broad and narrow component) to the spectrum of the main source C (top panel, Fig. 2), but the resulting chi-square is indistinguishable from the fitting of a single Gaussian profile fit. Given the overall narrow line width of the [C II] line and the lack of evidence for a two component line profile, we consider this possibility unlikely.
Second, the large gas motions resulting from galaxy mergers can imprint multiple components on the moment-0 map and the spectrum and disturb considerably the velocity dispersion map (Romano et al. 2021). In the case of COS2987, we do not see any obvious secondary source component distribution in the [C II] moment-0 map or the spectrum and individual channel maps. Similarly, there is no evidence for merger activity in the central region of this source (C) in any of the available HST images. The latter is clearly described by a single Sersic profile (Fig. 3). Given the lack of dust detection at this position, it is unlikely that the rest-UV distribution seen in the HST images are affected by differential dust obscuration. The dispersion map shows a mainly homogenous low average dispersion ∼29 km s−1, compared to merging systems at z > 5 in the ALPINE survey (Romano et al. 2021). Moreover, COS2987 has a lower mass of 1.7 × 10⁹ M⊙, as compared to the mass of ∼1010 M⊙ of these merging systems. With the current ALMA [C II] and HST rest-UV data, we are able to discard a compact merger with separations larger than 2–3 kpc.
As suggested by Rizzo et al. (2022), after several tests with disks and mergers simulations, an accurate differentiation of disks and mergers galaxies requires observations to cover three beams over the major axis of the galaxy and S/N > 10, conditions that are not achieved by our data. With this caveat in mind, in the next two subsections, we examine the implications of an evolution of disk galaxies assuming that the velocity gradient in the velocity map and p–v diagram arrives from a rotating gaseous disk.
4.3.2. Stability and evolution
The evolution of the intrinsic velocity dispersion and the rotation-to-dispersion ratio with redshift elucidate which physical mechanisms can play a role during galaxy evolution (Girard et al. 2018; Übler et al. 2019, and references therein). Both simulations and observations point to an increase of the velocity dispersion with redshift indicating that high-redshift disks galaxies are “hotter” dynamically (Pillepich et al. 2019). Galaxies may have experienced constant turbulence caused by several physical mechanisms, such as: energy transfer by winds due to supernova episodes that can generate gas outflows to the outer regions (Mac Low & Klessen 2004), instability due to the accretion process of cold gas from cosmic filaments (Dekel et al. 2009), and instabilities generated by major and minor mergers (Bournaud et al. 2010; Pillepich et al. 2019). Furthermore, recent simulations indicate that rotation-supported systems should be expected in the first billion years after the Big Bang (Kereš et al. 2005; Dekel et al. 2009).
Sensitive CO and Hα imaging surveys of main-sequence galaxies at z ∼ 1 − 2 have shown that this population is dominated by rotation-supported systems (Tacconi et al. 2010; Übler et al. 2019; Genzel et al. 2020; Sharma et al. 2021). Recent studies, mainly based on [C II] analysis, point to the presence of fast cold rotators among massive galaxies with intense star formation already at z ∼ 4.5 (Neeleman et al. 2020; Rizzo et al. 2020; Fraternali et al. 2021; Lelli et al. 2021). Furthermore, analyses of ALPINE [C II] data cubes indicate that an important fraction (∼40%) of the massive main sequence galaxies at z = 4 − 6 can also be associated to rotating disks Jones et al. (2021; z = 4 − 6). Smit et al. (2018) showed that rotating disks are already in place at z ∼ 7. One of the big challenges in this regard is related to the limited resolution and depth of these studies aiming to confirm whether these systems are, in fact, rotating disks.
If we consider the velocity gradient of COS2987 comes from a rotating-disk, we can check the stability state of the system and put it into context of the dynamical evolution of disks. In Fig. 8, we show the intrinsic velocity dispersion and rotation-to-dispersion ratio as a function of redshift for COS2987 and recent observations. We compared them with the expected average dynamical parameters for galaxies from the semi-analytical model of Wisnioski et al. (2015, 2019; green area). We included a sample of main-sequence star-forming galaxies from the ALPINE survey (white crosses, Jones et al. 2021) at z > 4 and the following massive starburst galaxies: DLA0817g (z = 4.26, Neeleman et al. 2020), SPT-S J041839-4751.9 (z = 4.2, Rizzo et al. 2020), and finally AzTEC/C159 (z = 4.57) and J1000+0234 (z = 4.54, Fraternali et al. 2021). They are all signed as stars in Fig. 8. We also included available dynamical data from quasar host galaxies at z > 6 (orange circles; Neeleman et al. 2021).
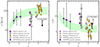 |
Fig. 8. Dynamical state of COS2987 in the context of the cosmic evolution of the expected dispersion velocity (left panel) and rotation-to-dispersion ratio (right panel). As a reference, other intermediate- and high-redshift sources are displayed in both panels: KMOS3D massive galaxies at z = 1 − 2 (purple hexagons; Übler et al. 2017), normal star-forming galaxies of ALPINE survey at z = 5 − 6 (white crosses; Jones et al. 2021), massive starbursts at z ∼ 4.5 (pink and white stars; Neeleman et al. 2020; Fraternali et al. 2021; Rizzo et al. 2020), and quasars at z > 6 (orange circles; Neeleman et al. 2021). The green filled-area represents the expected values for the dispersion and rotation-to-velocity from a semi-analytical model based on the Toomre parameter (Wisnioski et al. 2015). COS2987 is represented by upper-limits due to resolution limitation (see text). In the right panel, the black upper limit represents the rotation-to-dispersion ratio for the outer regions of the galaxy. The gray upper limit corresponds to the ratio for the average rotational and dispersion velocity. It is slightly offset from the black upper limit for better viewing. |
We noted that there are differences in the definitions of the rotational and dispersion velocity in the literature. We homogenized them as specified by Wisnioski et al. (2015), in which the velocity dispersion is defined at the outer regions of the galaxy to avoid beam smearing effects. The quasars (Neeleman et al. 2021) and the massive galaxy DLA0817g (Neeleman et al. 2020) were derived by assuming a constant dispersion and rotational velocity profile, therefore no change is needed. For the starburst massive galaxy SPT0418-47, Rizzo et al. (2020) assumed an exponential model for the dispersion velocity profile. We thus used the measurements for R > 1 kpc, where the rotational velocity and dispersion flatten. These two massive galaxies are represented as pink colors in Fig. 8. For the massive galaxies AzTEC/C159 and J1000+0234 (Fraternali et al. 2021) and the normal star-forming ALPINE galaxies (Jones et al. 2021), the rotational and dispersion velocities were obtained using 3DBAROLO and no fixed radial profile shape for the velocity dispersion was used. Due to the beam size, the points for the rotational and dispersion velocities profiles are not independent. For each galaxy, we thus simply took the average value in all rings and caution of possible conclusions for these systems. Therefore, all cases that could not be corrected are marked in white. Finally, for the galaxy COS2987, we computed values for three rings with a width of 0.18″, and we took the value for the third ring, located at 0.45″ (black upper limit in both panels of Fig. 8). However, since it is close to the [C II] effective radius (0.38″) and the points are not completely independent, we also display in the left panel the average rotational-to-dispersion ratio (gray upper limit slightly offset from the black one for better visualization).
From this comparison, we note that the model agrees with the average dynamical state of massive disks at z ∼ 1 − 2 (KMOS3D survey; Übler et al. 2017) and quasar host galaxies at z ∼ 6. However, it struggles to reproduce the velocity dispersion and rotation-to-dispersion ratios of most massive and star-forming galaxies at z ∼ 4 − 6. The typical star-forming galaxies and some of the massive galaxies may be affected by beam smearing, which can overestimate the values of the rotation-to-dispersion ratio. But the massive starburst galaxies, especially SPT0418-47 (σ = 18 ± 1 km s−1 and v/σ = 13.7 ± 0.7), also diverge from what is expected by the models and simulations.
We found a value of vrot/σ≥ 1.4 for COS2987, which agrees with the semi-analytical models, but we noted a low velocity dispersion (upper limit, Fig. 8, right panel), where the expectation is to have highly turbulent systems. This implies that the disk, if in place, is likely in a stable dynamical state. This is mildly at odds with our finding of a northern arm, which could represent an on-going minor merger (or gas inflow) and would thus imply a highly active stage of assembly. Such an event (and possibly subsequent ones) would result in a significant perturbation of the galaxy disk. As pointed out by Katz et al. (2019), observing stable disks at these epochs might represent a short-lived phase, likely coincidental with a particular line-of-sight and geometry, before the galaxy experiences further perturbations. In the case of quasars, it is likely that such objects are in a highly turbulent phase, due to the presence of a dominant AGN.
We noted that the choice of source inclinations for COS2987 would increase the resulting velocity dispersion, thus providing a better agreement with the expected dispersion velocity at z ∼ 7. To test this assumption, we ran 3DBAROLO with a fixed dispersion velocity of 65 km s−1, which matches the expected velocity dispersion at this redshift. Higher inclinations yield poorer fits to the velocity dispersion maps, making such a conclusion unlikely. These results rule out the possibility that our galaxy would represent a highly unstable system.
We diagnosed the prospect of the candidate gaseous disk to develop local instabilities by the Toomre Q-parameter (Toomre 1964). It is defined by Q = κ σ/(π G Σgas), where σ is the dispersion velocity; G is the gravitational constant; Σgas2 is the gas surface density, and κ = (2Ω/r)d(r2Ω)/dr = avc/r is the epicyclic frequency, where vc is the circular velocity and  for a flat rotational curve. For the gas surface brightness, we adopted the total gas mass at the effective radius of Mgas = (5 ± 3) × 109 M⊙ (Mgas ∼ Mdyn − M*/2, M*; see Sect. 4.3.3). If Q < 1, the gaseous disk is susceptible to local gravitational collapse. Otherwise (Q ≥ 1), the system would not be inclined to develop clumpiness. For the effective radius and maximum rotational velocity, we found a mean Q = 0.44, indicating that even thought COS2987 is a possible rotationally supported system, it is prone to face gravitational instabilities in its internal structure.
4.3.3. Conversion factor
We dynamically characterized the galaxy for a rotating-disk scenario, therefore, it is possible to measure the dynamical mass of the system within its effective radius. Rest-frame observations in the near-infrared (NIR) provide the measurement of the extension of the stellar population of the galaxy. Since the rest-frame optical data from Spitzer imaging does not resolve the galaxy sufficiently, we chose the [C II] effective radius as a proxy of the stellar extension, supported by the agreement of the [C II] and UV effective radii. From the maximum rotation velocity of the system, we obtained a dynamical mass of Mdyn = (6 ± 3) × 109 M⊙. We estimated the total mass of gas at the effective radius, given that the inner region of the galaxy is baryonic dominated (Mgas ∼ Mdyn − M*/2, M* = 1.7 × 10⁹ M⊙; Smit et al. 2018), leading to the value of Mgas = (5 ± 3) × 109 M⊙.
Considering the [C II] luminosity within the [C II] effective radius of the galaxy (0.38″ ∼ 2 kpc), we can get the [C II]-to-gas conversion factor. We estimated a conversion factor for the total galaxy gas mass as ![Mathematical equation: $ \alpha^{\mathrm{total}}_{\mathrm{[CII]}} $](/articles/aa/full_html/2023/01/aa43399-22/aa43399-22-eq13.gif) = 62 ± 7 M⊙/L⊙ which is a considerably larger value than the median (7
= 62 ± 7 M⊙/L⊙ which is a considerably larger value than the median (7 M⊙/L⊙) for starburst galaxies supported by rotation at z = 4.5 (Rizzo et al. 2021).
Finding the conversion factor for molecular gas is a harder task, since there is no direct measurement of the molecular gas mass at this redshift. If we assume that 70% of the [C II] emission is due to PDR regions (Stacey et al. 1991, 2010), we find an upper limit of ![Mathematical equation: $ \alpha^{\mathrm{mol}}_{\mathrm{[CII]}} \leq 90 $](/articles/aa/full_html/2023/01/aa43399-22/aa43399-22-eq15.gif) M⊙/L⊙3, a higher value than the one achieved by Zanella et al. (2018) (mean value of
M⊙/L⊙3, a higher value than the one achieved by Zanella et al. (2018) (mean value of ![Mathematical equation: $ \alpha^{\mathrm{mol}}_{\mathrm{[CII]}} = 31 $](/articles/aa/full_html/2023/01/aa43399-22/aa43399-22-eq16.gif) M⊙/L⊙).
M⊙/L⊙).
5. Conclusions
In this paper, we analyze the morphology and kinematics state of the normal star-forming galaxy COS2987, at z ∼ 7. Previous studies found a low dust content and a tentative evidence for a velocity gradient, suggesting possible disk rotation (but indistinguishable from a merger scenario). The new higher-resolution [C II] observations obtained with ALMA in Band 6 can resolve 2 kpc-scale structures, allowing us to perform a detailed study of the cold ionized gas conditions, distribution and kinematics. We compared the spatial distribution of the stellar and [C II] line emission components to search for hints of extended [C II] emission. We also performed a dynamical fitting using 3DBAROLO to study the possibility of rotation in the galaxy and put in context with the cosmic evolution of disk galaxies. Finally, the high resolution allowed us to look individually at the components of the galaxy and study the scattering of the LCII-SFR relation and offset in the ΣSFR vs. ΣCII relation.
We summarized our findings below:
No extended emission/[C II] halo. COS2987 presents a good match between the cold ionized gas ([C II]) and UV continuum distribution. The [C II] and UV spatial extension agrees within the uncertainties and the radial profile of the emissions is similar in shape and size, even though we could see a [C II] emitter satellite in the north-east portion of the galaxy. Therefore, we did not detect any signs of a [C II] halo, indicating that such structures are not ubiquitous at these redshifts.
Complex environment. The galaxy presents an extended arm-shaped structure, which can be associated to a satellite being accreted. Additional possible evidence for [C II] structures and clumps are found in its neighborhood, within a 10-kpc region. Deeper observations are needed to confirm these structures.
A disk candidate in the early Universe. The rotation-to-dispersion ratio agrees with the models, but a low velocity dispersion reveals that COS2987 is going through a non-turbulent phase. If the scenario of having a complex environment composed of other satellites is correct, the stability of the candidate disk can be a short event, with the disk being affected in posterior times. The suggested rotating disk nature hints that these structures appear as early as the first billion year of the universe. But the low fraction of rotation ordered normal star-forming galaxies (40%; Jones et al. 2021) at z > 4 indicate that this is a subdominant dynamic state in this cosmic epoch. Deeper and higher resolution observations are mandatory to rule out the scenario in which COS2987 is a compact merger.
[C II] deficiency. COS2987 and its substructures lie along the tight correlation L[CII] and SFR of nearby normal star-forming galaxies, but they fall below the local relation of ΣSFR vs. ΣCII. This suggests that the [C II] emission may be affected by a strong radiation field caused by a starburst phase, low metallicity, or low gas density. Complementary FIR lines are needed to fully understand the ionization structure of COS2987.
Our findings support the necessity of kpc-scale resolved observations to unveil the nature and properties of the ISM in galaxies early in the Universe. Forthcoming similar observations in larger samples (e.g., REBELS and CRISTAL ALMA large programs) will provide insights on the ubiquity of disks at early cosmic times. Future observations with JWST will also help us to constrain the high-ionization optical lines, which are critical tracers of warm, moderate density gas environments.
Due to its low ionization potential of 11.3 eV.
Σgas = ![Mathematical equation: $ \frac{M_{\mathrm{gas}}}{\pi \left(r^{\mathrm{eff}}_{\mathrm{[CII]}}\right)^{2}} $](/articles/aa/full_html/2023/01/aa43399-22/aa43399-22-eq17.gif) .
.
Derived from ![Mathematical equation: $ \alpha^{\mathrm{mol}}_{\mathrm{[CII]}} = \frac{M_{\mathrm{gas}}}{(70\% \times L_{\mathrm{[CII]}}/2)} $](/articles/aa/full_html/2023/01/aa43399-22/aa43399-22-eq18.gif) .
.
Acknowledgments
A. P. and M. A. acknowledge support from FONDECYT grant 1211951, “ANID+PCI+INSTITUTO MAX PLANCK DE ASTRONOMIA MPG 190030”, “ANID+PCI+REDES 190194”. M.A. acknowledges partial support from ANID BASAL project FB210003. G.C.J. acknowledges ERC Advanced Grants 695671 “QUENCH” and 789056 “FirstGalaxies”, as well as support by the Science and Technology Facilities Council (STFC). RJA was supported by FONDECYT grant number 1191124 and by ANID BASAL project FB210003. CR acknowledges support from the Fondecyt Iniciacion grant 11190831 and ANID BASAL project FB210003. RS acknowledges support from an STFC Ernest Rutherford Fellowship (ST/S004831/1). R.H.-C. thanks the Max Planck Society for support under the Partner Group project “The Baryon Cycle in Galaxies” between the Max Planck for Extraterrestrial Physics and the Universidad de Concepción. R.H-C. also gratefully acknowledge financial support from Millenium Nucleus NCN19058 (TITANs), and ANID BASAL projects ACE210002 and FB210003. This paper makes use of the following ALMA data: ADS/JAO.ALMA#2015.1.01111.S and ADS/JAO.ALMA#2018.1.01359.S. ALMA is a partnership of ESO (representing its member states), NSF (USA) and NINS (Japan), together with NRC (Canada), MOST and ASIAA (Taiwan), and KASI (Republic of Korea), in cooperation with the Republic of Chile. The Joint ALMA Observatory is operated by ESO, AUI/NRAO and NAOJ.
References
- Bournaud, F., Elmegreen, B. G., Teyssier, R., Block, D. L., & Puerari, I. 2010, MNRAS, 409, 1088 [CrossRef] [Google Scholar]
- Bournaud, F., Chapon, D., Teyssier, R., et al. 2011, ApJ, 730, 4 [NASA ADS] [CrossRef] [Google Scholar]
- Bouwens, R. J., Illingworth, G. D., Oesch, P. A., et al. 2014, ApJ, 793, 115 [Google Scholar]
- Bouwens, R. J., Aravena, M., Decarli, R., et al. 2016, ApJ, 833, 72 [NASA ADS] [CrossRef] [Google Scholar]
- Bouwens, R., González-López, J., Aravena, M., et al. 2020, ApJ, 902, 112 [NASA ADS] [CrossRef] [Google Scholar]
- Bouwens, R. J., Smit, R., Schouws, S., et al. 2022, ApJ, 931, 160 [NASA ADS] [CrossRef] [Google Scholar]
- Bowler, R. A. A., McLure, R. J., Dunlop, J. S., et al. 2017, MNRAS, 469, 448 [NASA ADS] [CrossRef] [Google Scholar]
- Capak, P. L., Carilli, C., Jones, G., et al. 2015, Nature, 522, 455 [NASA ADS] [CrossRef] [Google Scholar]
- Carniani, S., Maiolino, R., Amorin, R., et al. 2018a, MNRAS, 478, 1170 [NASA ADS] [CrossRef] [Google Scholar]
- Carniani, S., Maiolino, R., Smit, R., & Amorín, R. 2018b, ApJ, 854, L7 [Google Scholar]
- Carniani, S., Ferrara, A., Maiolino, R., et al. 2020, MNRAS, 499, 5136 [NASA ADS] [CrossRef] [Google Scholar]
- Clark, P. C., Glover, S. C. O., Ragan, S. E., & Duarte-Cabral, A. 2019, MNRAS, 486, 4622 [Google Scholar]
- Dayal, P., Volonteri, M., Choudhury, T. R., et al. 2020, MNRAS, 495, 3065 [Google Scholar]
- De Looze, I., Baes, M., Bendo, G. J., Cortese, L., & Fritz, J. 2011, MNRAS, 416, 2712 [Google Scholar]
- De Looze, I., Cormier, D., Lebouteiller, V., et al. 2014, A&A, 568, A62 [NASA ADS] [CrossRef] [EDP Sciences] [Google Scholar]
- Dekel, A., Birnboim, Y., Engel, G., et al. 2009, Nature, 457, 451 [Google Scholar]
- Di Teodoro, E. M., & Fraternali, F. 2015, MNRAS, 451, 3021 [Google Scholar]
- Dunlop, J. S., Rogers, A. B., McLure, R. J., et al. 2013, MNRAS, 432, 3520 [NASA ADS] [CrossRef] [Google Scholar]
- Eales, S. A., Wynn-Williams, C. G., & Duncan, W. D. 1989, ApJ, 339, 859 [NASA ADS] [CrossRef] [Google Scholar]
- Ferrara, A., Vallini, L., Pallottini, A., et al. 2019, MNRAS, 489, 1 [Google Scholar]
- Förster Schreiber, N. M., & Wuyts, S. 2020, ARA&A, 58, 661 [Google Scholar]
- Fraternali, F., Karim, A., Magnelli, B., et al. 2021, A&A, 647, A194 [NASA ADS] [CrossRef] [EDP Sciences] [Google Scholar]
- Fudamoto, Y., Oesch, P. A., Faisst, A., et al. 2020, A&A, 643, A4 [NASA ADS] [CrossRef] [EDP Sciences] [Google Scholar]
- Fujimoto, S. 2019, in ALMA2019: Science Results and Cross-Facility Synergies, 63 [Google Scholar]
- Fujimoto, S., Silverman, J. D., Bethermin, M., et al. 2020, ApJ, 900, 1 [Google Scholar]
- Gaia Collaboration (Brown, A. G. A. et al.) 2018, A&A, 616, A1 [NASA ADS] [CrossRef] [EDP Sciences] [Google Scholar]
- Genzel, R., Price, S. H., Übler, H., et al. 2020, ApJ, 902, 98 [NASA ADS] [CrossRef] [Google Scholar]
- Ginolfi, M., Jones, G. C., Béthermin, M., et al. 2020, A&A, 643, A7 [NASA ADS] [CrossRef] [EDP Sciences] [Google Scholar]
- Girard, M., Dessauges-Zavadsky, M., Schaerer, D., et al. 2018, A&A, 613, A72 [NASA ADS] [CrossRef] [EDP Sciences] [Google Scholar]
- Harikane, Y., Ouchi, M., Shibuya, T., et al. 2018, ApJ, 859, 84 [NASA ADS] [CrossRef] [Google Scholar]
- Heckman, T. M., Lehnert, M. D., Strickland, D. K., & Armus, L. 2000, ApJS, 129, 493 [Google Scholar]
- Herrera-Camus, R., Bolatto, A. D., Wolfire, M. G., et al. 2015, ApJ, 800, 1 [Google Scholar]
- Herrera-Camus, R., Sturm, E., Graciá-Carpio, J., et al. 2018, ApJ, 861, 95 [Google Scholar]
- Herrera-Camus, R., Förster Schreiber, N., Genzel, R., et al. 2021, A&A, 649, A31 [NASA ADS] [CrossRef] [EDP Sciences] [Google Scholar]
- Hopkins, P. F., Hernquist, L., Cox, T. J., et al. 2006, ApJS, 163, 1 [Google Scholar]
- Hopkins, P. F., Hernquist, L., Cox, T. J., & Kereš, D. 2008, ApJS, 175, 356 [Google Scholar]
- Inoue, A. K., Tamura, Y., Matsuo, H., et al. 2016, Science, 352, 1559 [NASA ADS] [CrossRef] [Google Scholar]
- Jones, G. C., Vergani, D., Romano, M., et al. 2021, MNRAS, 507, 3540 [NASA ADS] [CrossRef] [Google Scholar]
- Katz, H., Galligan, T. P., Kimm, T., et al. 2019, MNRAS, 487, 5902 [NASA ADS] [CrossRef] [Google Scholar]
- Kennicutt, R. C., & Evans, N. J. 2012, ARA&A, 50, 531 [NASA ADS] [CrossRef] [Google Scholar]
- Kereš, D., Katz, N., Weinberg, D. H., & Davé, R. 2005, MNRAS, 363, 2 [Google Scholar]
- King, A., & Pounds, K. 2015, ARA&A, 53, 115 [NASA ADS] [CrossRef] [Google Scholar]
- Klaas, U., Haas, M., Heinrichsen, I., & Schulz, B. 1997, A&A, 325, L21 [NASA ADS] [Google Scholar]
- Koekemoer, A. M., Faber, S. M., Ferguson, H. C., et al. 2011, ApJS, 197, 36 [NASA ADS] [CrossRef] [Google Scholar]
- Kroupa, P., & Weidner, C. 2003, ApJ, 598, 1076 [NASA ADS] [CrossRef] [Google Scholar]
- Lagache, G., Cousin, M., & Chatzikos, M. 2018, A&A, 609, A130 [NASA ADS] [CrossRef] [EDP Sciences] [Google Scholar]
- Laigle, C., McCracken, H. J., Ilbert, O., et al. 2016, ApJS, 224, 24 [Google Scholar]
- Laporte, N., Nakajima, K., Ellis, R. S., et al. 2017, ApJ, 851, 40 [NASA ADS] [CrossRef] [Google Scholar]
- Le Fèvre, O., Béthermin, M., Faisst, A., et al. 2020, A&A, 643, A1 [Google Scholar]
- Lelli, F., Di Teodoro, E. M., Fraternali, F., et al. 2021, Science, 371, 713 [Google Scholar]
- Lupi, A., & Bovino, S. 2020, MNRAS, 492, 2818 [Google Scholar]
- Mac Low, M.-M., & Klessen, R. S. 2004, Rev. Mod. Phys., 76, 125 [Google Scholar]
- Matthee, J., Sobral, D., Boone, F., et al. 2017, ApJ, 851, 145 [NASA ADS] [CrossRef] [Google Scholar]
- Matthee, J., Sobral, D., Boogaard, L. A., et al. 2019, ApJ, 881, 124 [NASA ADS] [CrossRef] [Google Scholar]
- McMullin, J. P., Waters, B., Schiebel, D., Young, W., & Golap, K. 2007, ASP Conf. Ser., 376, 127 [Google Scholar]
- Naidu, R. P., Tacchella, S., Mason, C. A., et al. 2020, ApJ, 892, 109 [NASA ADS] [CrossRef] [Google Scholar]
- Nayyeri, H., Hemmati, S., Mobasher, B., et al. 2017, ApJS, 228, 7 [NASA ADS] [CrossRef] [Google Scholar]
- Neeleman, M., Prochaska, J. X., Kanekar, N., & Rafelski, M. 2020, Nature, 581, 269 [Google Scholar]
- Neeleman, M., Novak, M., Venemans, B. P., et al. 2021, ApJ, 911, 141 [NASA ADS] [CrossRef] [Google Scholar]
- Pallottini, A., Ferrara, A., Decataldo, D., et al. 2019, MNRAS, 487, 1689 [Google Scholar]
- Pillepich, A., Nelson, D., Springel, V., et al. 2019, MNRAS, 490, 3196 [Google Scholar]
- Rizzo, F., Vegetti, S., Powell, D., et al. 2020, Nature, 584, 201 [Google Scholar]
- Rizzo, F., Vegetti, S., Fraternali, F., Stacey, H. R., & Powell, D. 2021, MNRAS, 507, 3952 [NASA ADS] [CrossRef] [Google Scholar]
- Rizzo, F., Kohandel, M., Pallottini, A., et al. 2022, A&A, 667, A5 [NASA ADS] [CrossRef] [EDP Sciences] [Google Scholar]
- Robertson, B. E., Ellis, R. S., Furlanetto, S. R., & Dunlop, J. S. 2015, ApJ, 802, L19 [Google Scholar]
- Romano, M., Cassata, P., Morselli, L., et al. 2021, A&A, 653, A111 [NASA ADS] [CrossRef] [EDP Sciences] [Google Scholar]
- Schaerer, D., Ginolfi, M., Béthermin, M., et al. 2020, A&A, 643, A3 [NASA ADS] [CrossRef] [EDP Sciences] [Google Scholar]
- Scoville, N., Abraham, R. G., Aussel, H., et al. 2007, ApJS, 172, 38 [NASA ADS] [CrossRef] [Google Scholar]
- Sérsic, J. L. 1963, Boletin de la Asociacion Argentina de Astronomia La Plata Argentina, 6, 41 [Google Scholar]
- Sharma, G., Salucci, P., Harrison, C. M., van de Ven, G., & Lapi, A. 2021, MNRAS, 503, 1753 [CrossRef] [Google Scholar]
- Silk, J. 2013, ApJ, 772, 112 [Google Scholar]
- Smit, R., Bouwens, R. J., Franx, M., et al. 2015, ApJ, 801, 122 [Google Scholar]
- Smit, R., Bouwens, R. J., Carniani, S., et al. 2018, Nature, 553, 178 [Google Scholar]
- Solomon, P. M., Downes, D., & Radford, S. J. E. 1992, ApJ, 398, L29 [Google Scholar]
- Stacey, G. J., Geis, N., Genzel, R., et al. 1991, ApJ, 373, 423 [NASA ADS] [CrossRef] [Google Scholar]
- Stacey, G. J., Hailey-Dunsheath, S., Ferkinhoff, C., et al. 2010, ApJ, 724, 957 [NASA ADS] [CrossRef] [Google Scholar]
- Tacconi, L. J., Genzel, R., Neri, R., et al. 2010, Nature, 463, 781 [Google Scholar]
- Toomre, A. 1964, ApJ, 139, 1217 [Google Scholar]
- Übler, H., Förster Schreiber, N. M., Genzel, R., et al. 2017, ApJ, 842, 121 [Google Scholar]
- Übler, H., Genzel, R., Wisnioski, E., et al. 2019, ApJ, 880, 48 [Google Scholar]
- Vallini, L., Gallerani, S., Ferrara, A., Pallottini, A., & Yue, B. 2015, ApJ, 813, 36 [NASA ADS] [CrossRef] [Google Scholar]
- Vallini, L., Ferrara, A., Pallottini, A., Carniani, S., & Gallerani, S. 2020, MNRAS, 495, L22 [Google Scholar]
- Vallini, L., Ferrara, A., Pallottini, A., Carniani, S., & Gallerani, S. 2021, MNRAS, 505, 5543 [NASA ADS] [CrossRef] [Google Scholar]
- Willott, C. J., Carilli, C. L., Wagg, J., & Wang, R. 2015, ApJ, 807, 180 [NASA ADS] [CrossRef] [Google Scholar]
- Wisnioski, E., Förster Schreiber, N. M., Wuyts, S., et al. 2015, ApJ, 799, 209 [Google Scholar]
- Wisnioski, E., Förster Schreiber, N. M., Fossati, M., et al. 2019, ApJ, 886, 124 [Google Scholar]
- Wolfire, M. G., McKee, C. F., Hollenbach, D., & Tielens, A. G. G. M. 2003, ApJ, 587, 278 [Google Scholar]
- Zanella, A., Daddi, E., Magdis, G., et al. 2018, MNRAS, 481, 1976 [Google Scholar]
Appendix A: Data products
A.1. [C II] moment-0 maps for the available observations
In Figure A.1, we display the [C II] moment-0 maps for the available observations: low-resolution data from Smit et al. (2018) (left panel; PI: Smit, ALMA ID: 2015.1.01111.S), high-resolution data obtained in Cycle 6 (central panel; PI: Aravena, PID: 2018.1.01359.S) and the combination of both data sets (right panel). The cubes were obtained using the tclean task of CASA software using natural weighting to preserve sensitivity. The maps represent the collapsed line cube, averaged over a 150 km s−1 centered at the [C II] line frequency.
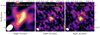 |
Fig. A.1. Comparison of the 5″ × 5″ zoom-in [C II] moment-0 maps for the available observations of COS2987. The left, central, and right panels correspond to the observation of Smit et al. (2018), our observation, and the combination of both, respectively. The overlaid black contours show the 2, 4, 6, and 8-σ levels, and the dashed dark gray contours show the -2σ level of each [C II] map. The white ellipse in the bottom right corner represents the beam size. |
A.2. Data cube
In Figure A.2, we provide the 2″ × 2″ [C II] channel map postage stamps in velocity steps of 30 km s−1, within the velocity range of [-180,180] km s−1.
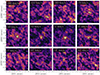 |
Fig. A.2. Channel maps of the cube within a velocity range of [-180,180] km s−1 (in bins of 30 km s−1), centered at the observed [C II] frequency. The overlaid black contours show the 2-, 4-, 6-, and 8-σ levels of the maps, and the dashed dark gray contours show the -2σ level of the [C II] maps. The central velocity of each channel is placed in the left corner of each image. |
A.3. Galaxy wide-field
In the left panel of Figure A.3, we display the F160W-band image overlapped by the [C II] moment-0 map in contours at significance levels of 2-, 3-, 4-, 5-, and 6-σ. In Section 3.1 we searched for a UV counterpart for the candidate [C II] emitter W1 and W2, and we just found a rest-frame UV emitter which is located east from W1. The centroid distance of 0.95″for the central source C and W1 translates into a projected physical separation of 5 kpc. It was previously identified as a galaxy with photometric redshift of 1.73 by Laigle et al. (2016). If the W2 candidate emitter was located at this redshift, the tentative emission would be explained by some emission at rest-frame frequency of 664.35 GHz. The closest bright possible emission would be the CO(6-5) at 691.47 GHz. Therefore, we ruled out this possibility.
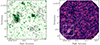 |
Fig. A.3. Wide-field rest-frame UV and continuum maps of COS2987 and surrounding regions. (a) Left panel: HST F160W-band image in a 6″ × 6″ region containing the central source and the candidate [C II] emitters (see Section 3.1). The [C II] moment-0 map is overlaid in black contours represented by the significance levels of 2-, 3-, 4-, 5-, 6-σ. (b) Right panel: Continuum map of the COS2987 field. The black lines correspond to the continuum significance levels from 2- to 7-σ at steps of 1-σ. In the bottom left panel within the main panel, we zoom in the central source in a 4″ × 4″ region. The overlaid white lines represent the [C II] moment-0 map for the significance levels from 2- to 6-σ, at steps of 1-σ. |
In the right panel of Figure A.3, we display the wide-field continuum image centered at the COS2987 galaxy. The image excludes any channel within the velocity range [-250,250] km s−1 centered at the line. We zoom in the region represented by the white dashed line in the bottom left panel. The black solid lines correspond to the continuum significance levels from 2- to 7-σ at steps of 1-σ and the white solid lines correspond to the [C II] emission significance level of 2-, 3-, 4-, 5-, 6-σ. We reported the continuum detection for the galaxy COSMOS 4104 (α, δ) =(10:00:29.6668, +02:13:14.591) at the photometric redshift 2.25 (Nayyeri et al. 2017).
Appendix B: Sources properties
In Section 3.1, we describe the properties of four [C II] emitters: the central source (C), north-east emission (N1), north-west arm (N2), west emission (W1), south-west emission (W2). The latter two are deemed as candidate [C II] emitters. They are shown in Figure 1 (central panel) and their properties are listed in Table B.1. The properties are taken from a region that contains the emission of each source. The central coordinates (right ascension and declination) represent the centroids of each emission. The [C II] luminosity is obtained following (Solomon et al. 1992), using:
![Mathematical equation: $$ \begin{aligned} L_{[CII]} = 1.04 \times 10^{-3} \; S_{[CII]} \Delta v \, D^{2}_{L} \, \nu _{obs}, \end{aligned} $$](/articles/aa/full_html/2023/01/aa43399-22/aa43399-22-eq19.gif) (B.1)
(B.1)
[C II] properties of the identified clump candidates around COS2987. The location of the emitters are indicated in Figure 1 (central panel).
where L[CII] is measured in L⊙, the velocity integrated flux, S[CII]Δv, in Jy km s−1, the observed frequency, νobs, in GHz, and the luminosity distance, DL, in Mpc.
Appendix C: Target extension
We employed a Monte Carlo Markov Chain (MCMC) technique to fit a two-dimensional Sérsic profile to the [C II] and UV surface brightness distribution. We use the Sersic2D task from the astropy package in python to generate the surface brightness map, which is described by the following parameters: amplitude (a; surface brightness at the effective radius), ellipticity (e), Sérsic index (n), effective half-light radius (reff), rotation angle (θ), and central pixel position (x0 and y0). For the rest-frame UV and [C II] emission, we follow two approaches: (i) setting all the parameters as free; and (ii) fixing the Sérsic index n = 1, for a fair comparison with previous studies(Fujimoto et al. 2020). We excluded the pixels within the region corresponding to the north-east foreground galaxy (located a z = 2.099; Laporte et al. 2017) and the north-west arm. In the case of ALMA maps, we assume a constant Gaussian noise across the whole image. In the case of HST images, we consider a background Gaussian noise and Poisson noise from the emission added in quadrature. We ran the MCMC routine with 100 walkers for 5000 interactions. In Figures C.1, C.2, C.3, and C.4 we show the posterior distributions of each parameter.
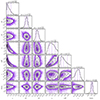 |
Fig. C.1. Posterior distributions of parameters of the two-dimensional UV surface brightness, setting the Sérsic index as a free parameter. The Sérsic profile model also includes the surface brightness at the effective radius (a), the central pixel position (x0 and y0), the effective half-light radius (reff), ellipticity (e), and the rotation angle (theta). Black contours in the 2D posterior distributions and the dashed purple lines in the histograms correspond to 16%, 50%, and 84% confidence regions. |
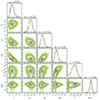 |
Fig. C.2. Posterior distributions of parameters of the two-dimensional UV surface brightness, setting the Sérsic index equals 1. Black contours in the 2D posterior distributions and the dashed green lines in the histograms correspond to 16%, 50%, and 84% confidence regions. |
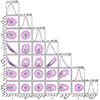 |
Fig. C.3. Posterior distributions of parameters of the two-dimensional [C II] surface brightness, setting the Sérsic index as a free parameter. The Sérsic profile model also includes the surface brightness at the effective radius (a), the central pixel position (x0 and y0), the effective half-light radius (reff), ellipticity (e), and the rotation angle (theta). Black contours in the 2D posterior distributions and the dashed pink lines in the histograms correspond to 16%, 50%, and 84% confidence regions. |
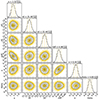 |
Fig. C.4. Posterior distributions of parameters of the two-dimensional [C II] surface brightness, setting the Sérsic index equals to 1. Black contours in the 2D posterior distributions and the dashed yellow lines in the histograms correspond to 16%, 50%, and 84% confidence regions. |
Appendix D: 3DBAROLO products
In Table D.1 we provide the best-fit values for each ring for the free parameters: rotational velocity, dispersion velocity, inclination, position angle and system velocity. In Figure D.1, we display the residuals (weighted by the moment-0 map) for the different inclination for the kinematics modeling.
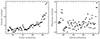 |
Fig. D.1. Residuals (data - model, weighted by the [C II] moment-0 map) of the trial-and-error tests for the radial (left panel) and dispersion velocities (right panel) maps for initial inclinations ranging from 10 to 90 deg. |
Best-fit parameters for each ring as a 3DBAROLO output.
All Tables
[C II] properties of the identified clump candidates around COS2987. The location of the emitters are indicated in Figure 1 (central panel).
All Figures
|
Fig. 1. Rest-frame UV and [C II] line maps of the galaxy COS2987 and its surroundings. Left: HST F160W-band image in the background shows the rest-UV emission in a 1.3″ × 1.3″ region around the galaxy. The [C II] integrated map (moment-0) is overlaid as black contours shown at 2-, 4- and 6-σ, where σ is the rms noise level of the moment-0 map. The region containing the foreground galaxy identified by Laporte et al. (2017) is highlighted by the purple line. Middle: zoom-out version of the [C II] moment-0 map toward COS2987 (6″ × 6″). The region shown in the left panel is represented by the dashed white line. We marked the locations of the central source (C), north-east emission (N1), north-west arm (N2), west emission (W1), and south-west emission (W2). The black contours represent the integrated [C II] line emission at 2-, 3-, 4-, 5-, and 6-σ levels and the dashed white contour represents the -2-σ level. The white star corresponds to a galaxy observed in the F160W-band map at zphot = 1.73 (Laigle et al. 2016). Right: [C II] line integrated map tapered to a 1″ beam size, showing the same region as in the central panel. The black contours represent the 2-, 4-, 6-, 8-, and 10-σ levels and the dashed white contour represents the -2-σ level. |
| In the text | |
|
Fig. 2. Spectra ranging from −300 to 300 km s−1 centered at the [C II] observed-frame frequency at z = 6.8076 (243.3465 GHz), based on a channel resolution of 30 km s−1. The gray region corresponds to the rms per channel. The spectra represent the: (a) Upper panel: central source C; (b) Central panel: N1+N2 emissions; and (c) Bottom panel: west emission. The regions are marked in Fig. 1. |
| In the text | |
|
Fig. 3. Radial profile of the surface brightness of the UV continuum (green circles) and [C II] line (purple stars). Each map is convolved with the PSF/beam of the other image to match the resolution of 0.47″ × 0.40″. There is no detection of a dust continuum, therefore no radial profile is shown. As a reference, we added the radial profile of the convolved beam and a exponential profile (Sérsic index = 1) with a reff = 0.38″ as a solid gray line and dashed black line, respectively. |
| In the text | |
|
Fig. 4. Velocity (Moment-1) and dispersion (Moment-2) maps of the galaxy COS2987 (with respect to the observed frequency of [C II] at redshift z = 6.8076) are shown in the left and right panels, respectively. The black contours correspond to the 2-, 4-, 6-σ levels of the [C II] integrated (moment-0) map. In the right panel, we plot the position-velocity diagram of slits 1 and 2, shown on the left panel as dashed lines. The black contours correspond to the 2-, 3-, and 4-σ levels of the position-velocity diagram. |
| In the text | |
|
Fig. 5. Rotational velocity products of the tilted-ring model fitting obtained using 3DBAROLO. The maps are shown in the velocity range of [−60, 30] km s−1 with respect to the observed frequency of the [C II] line at z = 6.8076. Left: observed velocity map of COS2987. Middle: velocity map of the best-fit model with a inclination of i = 23deg. Right: residuals of the velocity map. |
| In the text | |
|
Fig. 6. Dispersion velocity products of the tilted-ring model fitting obtained using 3DBAROLO. The left and central maps are shown in the velocity range of [0, 50] km s−1 and the left map in the velocity range of [−20, 20] km s−1, with respect to the observed frequency of the [C II] line at z = 6.8076. Left: observed dispersion velocity map of COS2987. Middle: dispersion velocity map of the best-fit model with a inclination of i = 23deg. Right: residuals of the dispersion velocity map. |
| In the text | |
|
Fig. 7. LCII-SFR and Σ[CII]-ΣSFR relations for the galaxy COS2987 and its minor components. Upper-left panel: [C II] moment-0 map with the regions considered as the whole system of COS2987 and its substructures highlighted as a yellow dashed circle and red circles, respectively. The regions within COS2987 are number as displayed in the figure. The dashed-dotted white line shows the 2-σ significance level of the galaxy. Bottom-left panel: F125W-band map with the same regions displayed in the upper left panel. The 2-σ significance level of the [C II] moment-0 map is shown as a black dashed-dotted line. Upper-right panel: LCII-SFR relation. The single system of COS2987 and its substructures are displaced as a purple diamond and thin green/white diamond, respectively. As a reference, the single system and their corresponding substructures of galaxies at z = 5 − 6 are represented as red circles and orange stars, similarly as the original study (Carniani et al. 2018a). Normal star-forming galaxies from the ALPINE survey (Schaerer et al. 2020) are represented as black circles. The black solid line and filled area describes the best-fit for the distribution of galaxies at z ∼ 0 (De Looze et al. 2014). Bottom-right panel: Σ[CII]-ΣSFR relation. The lines and points are the same from the upper right panel, except for the black solid line and filled area that corresponds to the local Σ[CII]-ΣSFR relation by Herrera-Camus et al. 2015. The dashed black line represents the best-fit for the galaxies and its respective clumps (Carniani et al. 2018a). |
| In the text | |
|
Fig. 8. Dynamical state of COS2987 in the context of the cosmic evolution of the expected dispersion velocity (left panel) and rotation-to-dispersion ratio (right panel). As a reference, other intermediate- and high-redshift sources are displayed in both panels: KMOS3D massive galaxies at z = 1 − 2 (purple hexagons; Übler et al. 2017), normal star-forming galaxies of ALPINE survey at z = 5 − 6 (white crosses; Jones et al. 2021), massive starbursts at z ∼ 4.5 (pink and white stars; Neeleman et al. 2020; Fraternali et al. 2021; Rizzo et al. 2020), and quasars at z > 6 (orange circles; Neeleman et al. 2021). The green filled-area represents the expected values for the dispersion and rotation-to-velocity from a semi-analytical model based on the Toomre parameter (Wisnioski et al. 2015). COS2987 is represented by upper-limits due to resolution limitation (see text). In the right panel, the black upper limit represents the rotation-to-dispersion ratio for the outer regions of the galaxy. The gray upper limit corresponds to the ratio for the average rotational and dispersion velocity. It is slightly offset from the black upper limit for better viewing. |
| In the text | |
|
Fig. A.1. Comparison of the 5″ × 5″ zoom-in [C II] moment-0 maps for the available observations of COS2987. The left, central, and right panels correspond to the observation of Smit et al. (2018), our observation, and the combination of both, respectively. The overlaid black contours show the 2, 4, 6, and 8-σ levels, and the dashed dark gray contours show the -2σ level of each [C II] map. The white ellipse in the bottom right corner represents the beam size. |
| In the text | |
|
Fig. A.2. Channel maps of the cube within a velocity range of [-180,180] km s−1 (in bins of 30 km s−1), centered at the observed [C II] frequency. The overlaid black contours show the 2-, 4-, 6-, and 8-σ levels of the maps, and the dashed dark gray contours show the -2σ level of the [C II] maps. The central velocity of each channel is placed in the left corner of each image. |
| In the text | |
|
Fig. A.3. Wide-field rest-frame UV and continuum maps of COS2987 and surrounding regions. (a) Left panel: HST F160W-band image in a 6″ × 6″ region containing the central source and the candidate [C II] emitters (see Section 3.1). The [C II] moment-0 map is overlaid in black contours represented by the significance levels of 2-, 3-, 4-, 5-, 6-σ. (b) Right panel: Continuum map of the COS2987 field. The black lines correspond to the continuum significance levels from 2- to 7-σ at steps of 1-σ. In the bottom left panel within the main panel, we zoom in the central source in a 4″ × 4″ region. The overlaid white lines represent the [C II] moment-0 map for the significance levels from 2- to 6-σ, at steps of 1-σ. |
| In the text | |
|
Fig. C.1. Posterior distributions of parameters of the two-dimensional UV surface brightness, setting the Sérsic index as a free parameter. The Sérsic profile model also includes the surface brightness at the effective radius (a), the central pixel position (x0 and y0), the effective half-light radius (reff), ellipticity (e), and the rotation angle (theta). Black contours in the 2D posterior distributions and the dashed purple lines in the histograms correspond to 16%, 50%, and 84% confidence regions. |
| In the text | |
|
Fig. C.2. Posterior distributions of parameters of the two-dimensional UV surface brightness, setting the Sérsic index equals 1. Black contours in the 2D posterior distributions and the dashed green lines in the histograms correspond to 16%, 50%, and 84% confidence regions. |
| In the text | |
|
Fig. C.3. Posterior distributions of parameters of the two-dimensional [C II] surface brightness, setting the Sérsic index as a free parameter. The Sérsic profile model also includes the surface brightness at the effective radius (a), the central pixel position (x0 and y0), the effective half-light radius (reff), ellipticity (e), and the rotation angle (theta). Black contours in the 2D posterior distributions and the dashed pink lines in the histograms correspond to 16%, 50%, and 84% confidence regions. |
| In the text | |
|
Fig. C.4. Posterior distributions of parameters of the two-dimensional [C II] surface brightness, setting the Sérsic index equals to 1. Black contours in the 2D posterior distributions and the dashed yellow lines in the histograms correspond to 16%, 50%, and 84% confidence regions. |
| In the text | |
|
Fig. D.1. Residuals (data - model, weighted by the [C II] moment-0 map) of the trial-and-error tests for the radial (left panel) and dispersion velocities (right panel) maps for initial inclinations ranging from 10 to 90 deg. |
| In the text | |
Current usage metrics show cumulative count of Article Views (full-text article views including HTML views, PDF and ePub downloads, according to the available data) and Abstracts Views on Vision4Press platform.
Data correspond to usage on the plateform after 2015. The current usage metrics is available 48-96 hours after online publication and is updated daily on week days.
Initial download of the metrics may take a while.