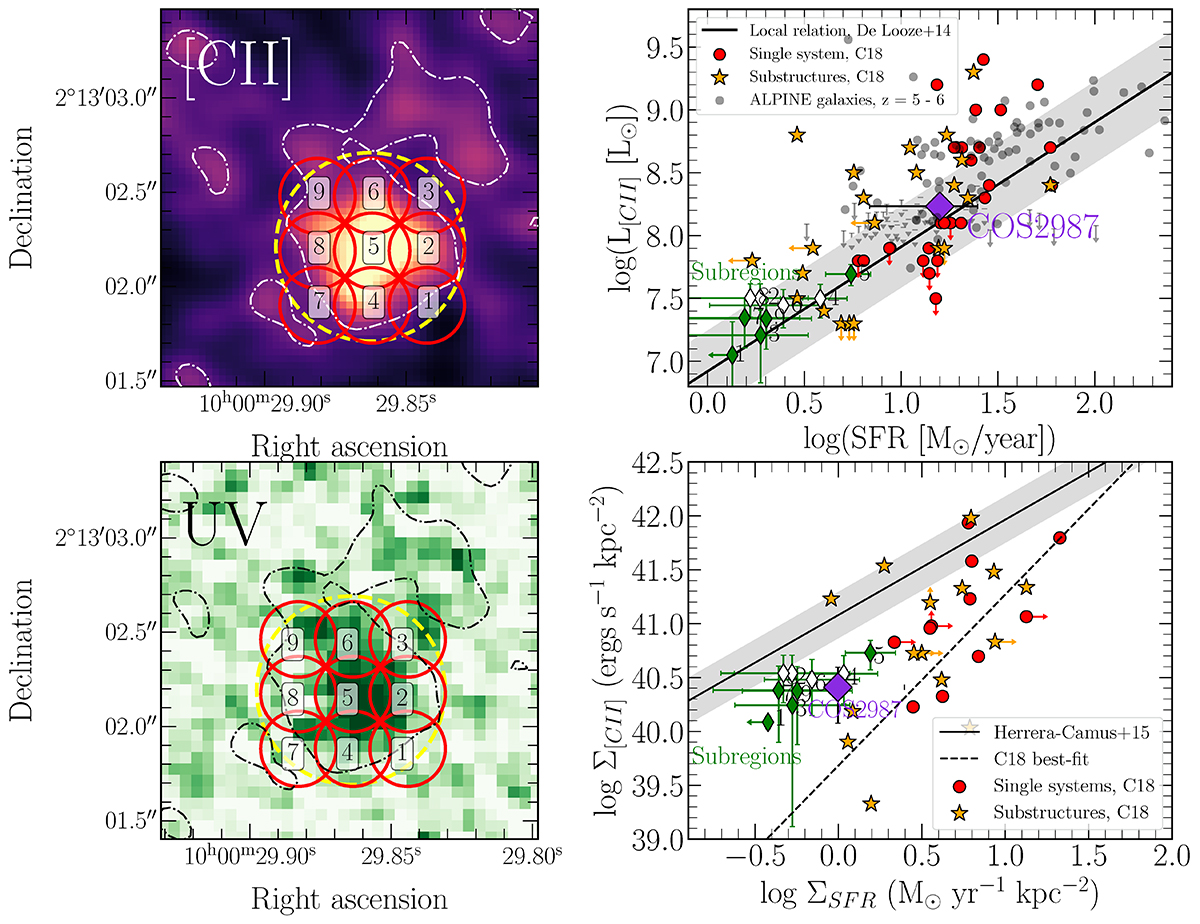
Fig. 7.
Download original image
LCII-SFR and Σ[CII]-ΣSFR relations for the galaxy COS2987 and its minor components. Upper-left panel: [C II] moment-0 map with the regions considered as the whole system of COS2987 and its substructures highlighted as a yellow dashed circle and red circles, respectively. The regions within COS2987 are number as displayed in the figure. The dashed-dotted white line shows the 2-σ significance level of the galaxy. Bottom-left panel: F125W-band map with the same regions displayed in the upper left panel. The 2-σ significance level of the [C II] moment-0 map is shown as a black dashed-dotted line. Upper-right panel: LCII-SFR relation. The single system of COS2987 and its substructures are displaced as a purple diamond and thin green/white diamond, respectively. As a reference, the single system and their corresponding substructures of galaxies at z = 5 − 6 are represented as red circles and orange stars, similarly as the original study (Carniani et al. 2018a). Normal star-forming galaxies from the ALPINE survey (Schaerer et al. 2020) are represented as black circles. The black solid line and filled area describes the best-fit for the distribution of galaxies at z ∼ 0 (De Looze et al. 2014). Bottom-right panel: Σ[CII]-ΣSFR relation. The lines and points are the same from the upper right panel, except for the black solid line and filled area that corresponds to the local Σ[CII]-ΣSFR relation by Herrera-Camus et al. 2015. The dashed black line represents the best-fit for the galaxies and its respective clumps (Carniani et al. 2018a).
Current usage metrics show cumulative count of Article Views (full-text article views including HTML views, PDF and ePub downloads, according to the available data) and Abstracts Views on Vision4Press platform.
Data correspond to usage on the plateform after 2015. The current usage metrics is available 48-96 hours after online publication and is updated daily on week days.
Initial download of the metrics may take a while.