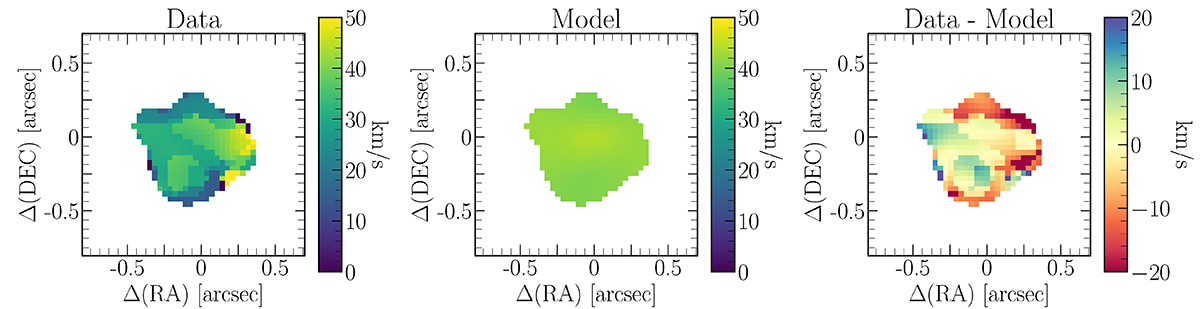
Fig. 6.
Download original image
Dispersion velocity products of the tilted-ring model fitting obtained using 3DBAROLO. The left and central maps are shown in the velocity range of [0, 50] km s−1 and the left map in the velocity range of [−20, 20] km s−1, with respect to the observed frequency of the [C II] line at z = 6.8076. Left: observed dispersion velocity map of COS2987. Middle: dispersion velocity map of the best-fit model with a inclination of i = 23deg. Right: residuals of the dispersion velocity map.
Current usage metrics show cumulative count of Article Views (full-text article views including HTML views, PDF and ePub downloads, according to the available data) and Abstracts Views on Vision4Press platform.
Data correspond to usage on the plateform after 2015. The current usage metrics is available 48-96 hours after online publication and is updated daily on week days.
Initial download of the metrics may take a while.