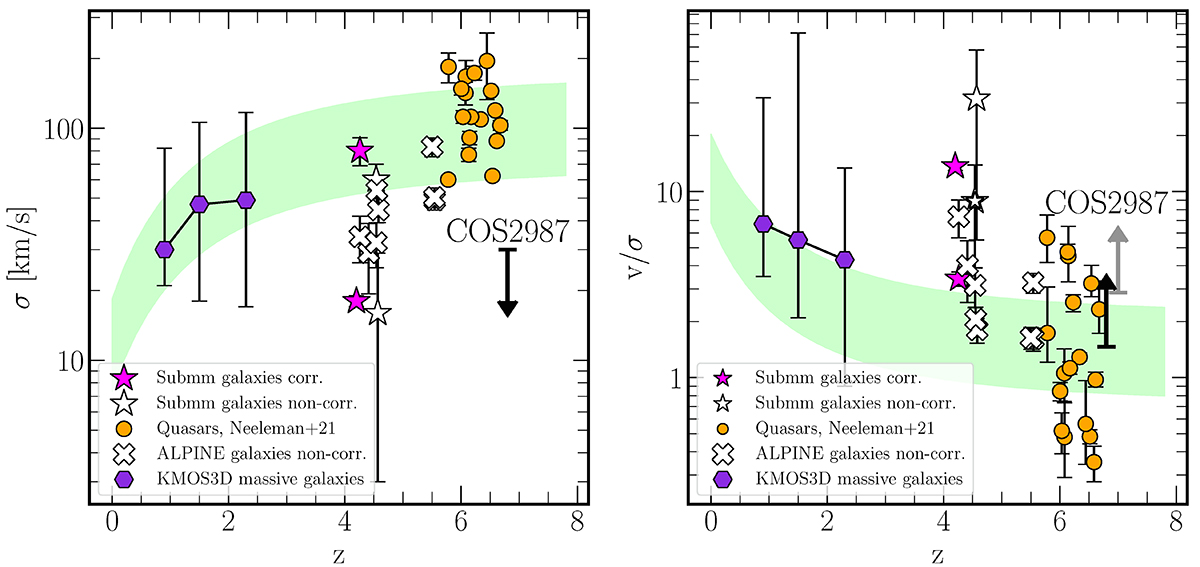
Fig. 8.
Download original image
Dynamical state of COS2987 in the context of the cosmic evolution of the expected dispersion velocity (left panel) and rotation-to-dispersion ratio (right panel). As a reference, other intermediate- and high-redshift sources are displayed in both panels: KMOS3D massive galaxies at z = 1 − 2 (purple hexagons; Übler et al. 2017), normal star-forming galaxies of ALPINE survey at z = 5 − 6 (white crosses; Jones et al. 2021), massive starbursts at z ∼ 4.5 (pink and white stars; Neeleman et al. 2020; Fraternali et al. 2021; Rizzo et al. 2020), and quasars at z > 6 (orange circles; Neeleman et al. 2021). The green filled-area represents the expected values for the dispersion and rotation-to-velocity from a semi-analytical model based on the Toomre parameter (Wisnioski et al. 2015). COS2987 is represented by upper-limits due to resolution limitation (see text). In the right panel, the black upper limit represents the rotation-to-dispersion ratio for the outer regions of the galaxy. The gray upper limit corresponds to the ratio for the average rotational and dispersion velocity. It is slightly offset from the black upper limit for better viewing.
Current usage metrics show cumulative count of Article Views (full-text article views including HTML views, PDF and ePub downloads, according to the available data) and Abstracts Views on Vision4Press platform.
Data correspond to usage on the plateform after 2015. The current usage metrics is available 48-96 hours after online publication and is updated daily on week days.
Initial download of the metrics may take a while.