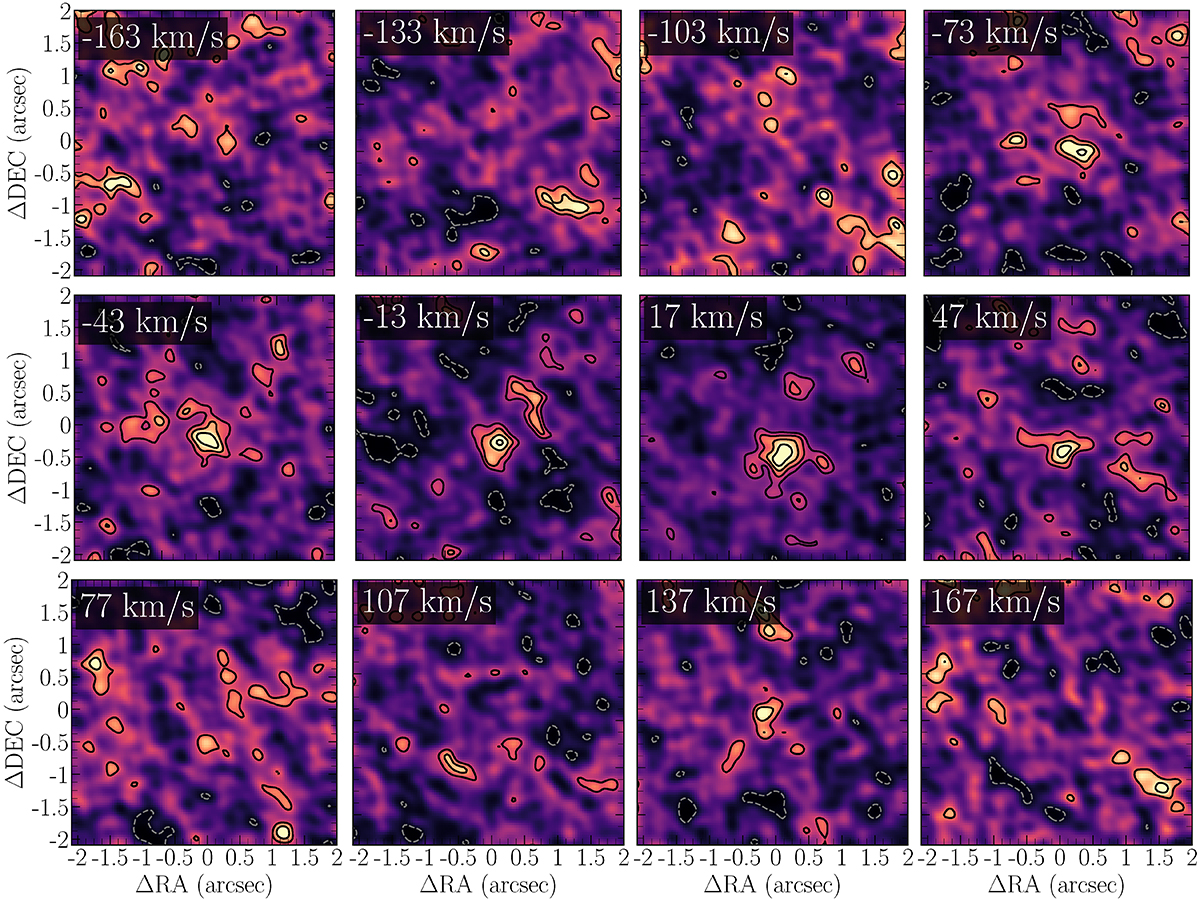
Fig. A.2.
Download original image
Channel maps of the cube within a velocity range of [-180,180] km s−1 (in bins of 30 km s−1), centered at the observed [C II] frequency. The overlaid black contours show the 2-, 4-, 6-, and 8-σ levels of the maps, and the dashed dark gray contours show the -2σ level of the [C II] maps. The central velocity of each channel is placed in the left corner of each image.
Current usage metrics show cumulative count of Article Views (full-text article views including HTML views, PDF and ePub downloads, according to the available data) and Abstracts Views on Vision4Press platform.
Data correspond to usage on the plateform after 2015. The current usage metrics is available 48-96 hours after online publication and is updated daily on week days.
Initial download of the metrics may take a while.