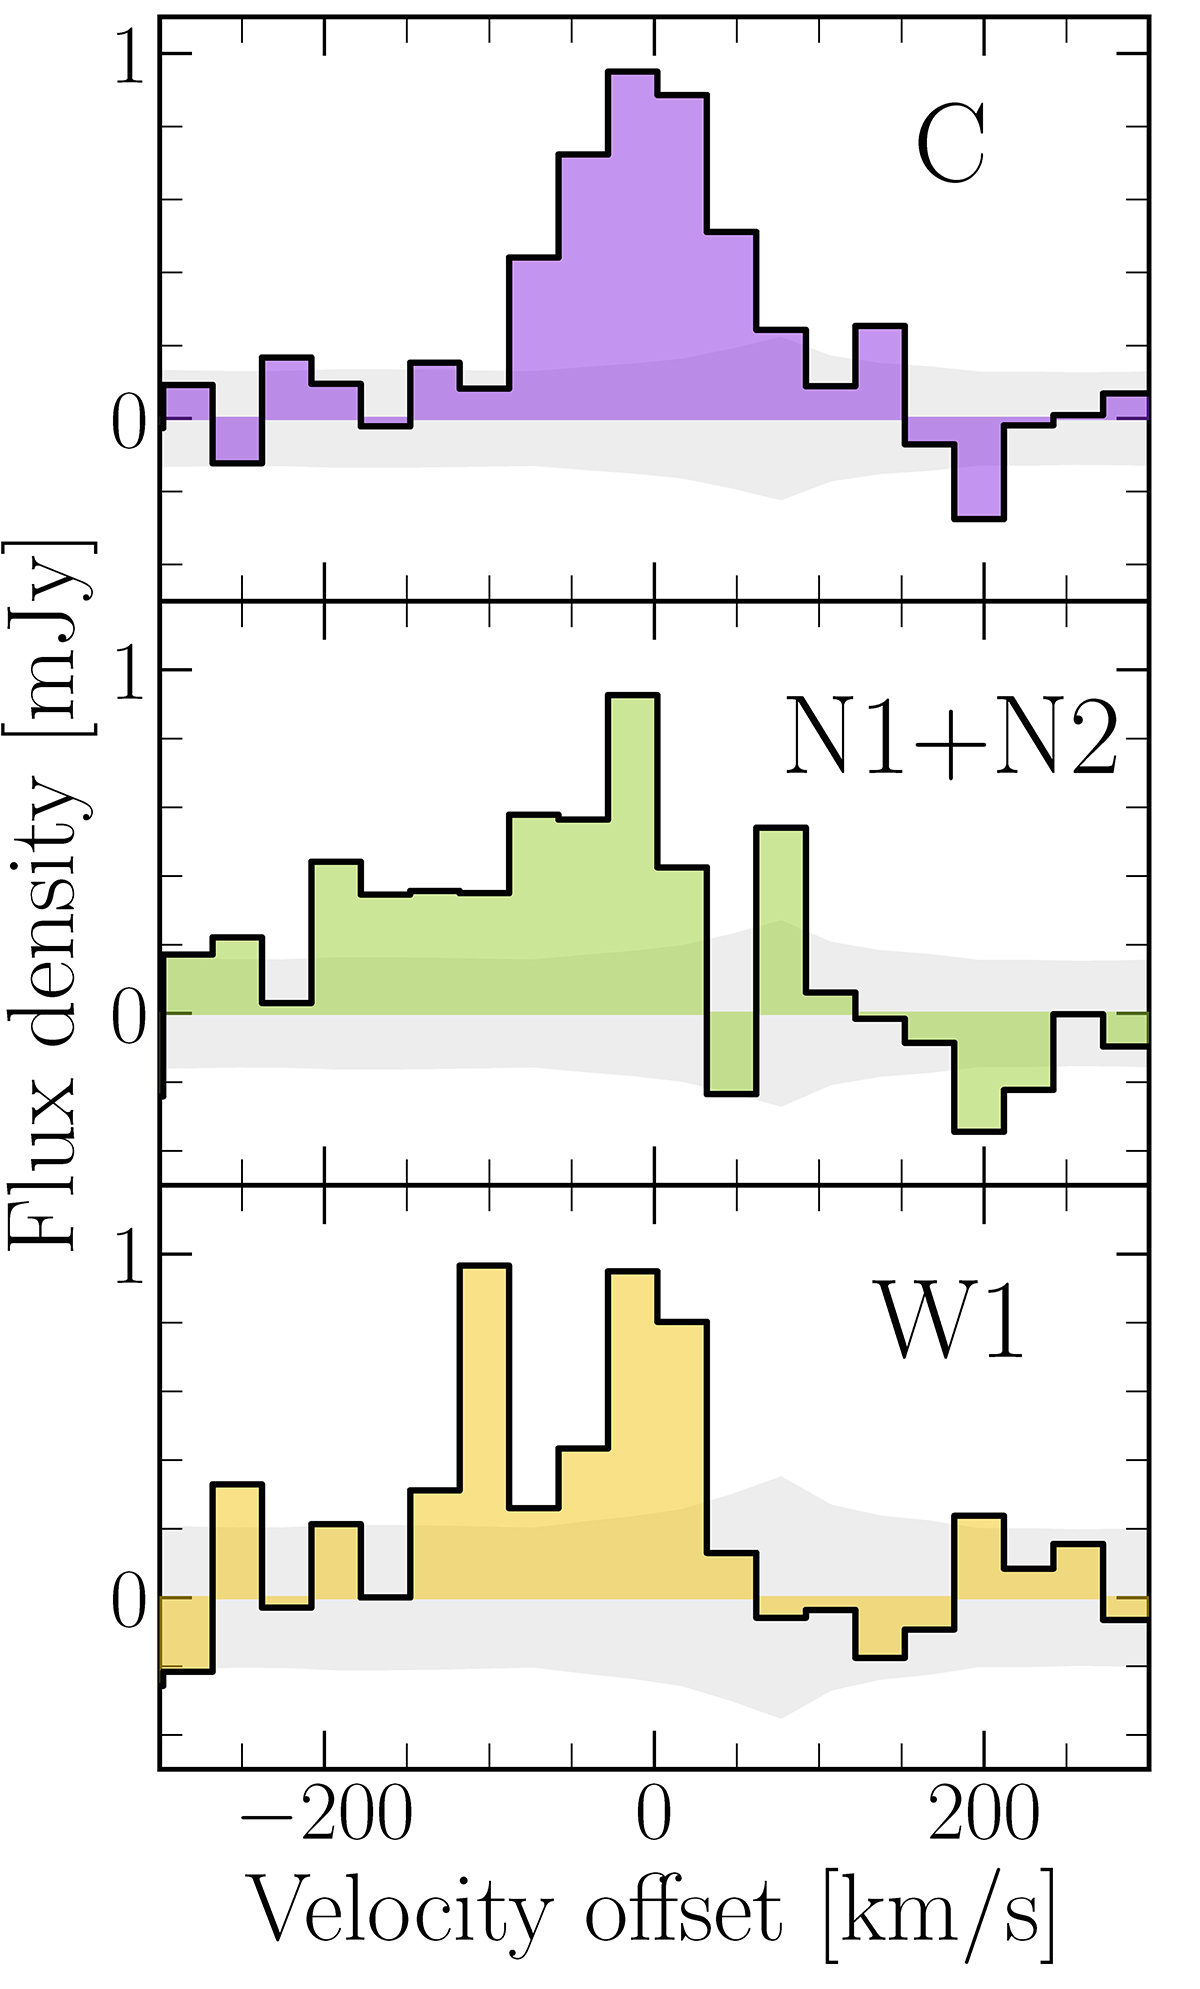
Fig. 2.
Download original image
Spectra ranging from −300 to 300 km s−1 centered at the [C II] observed-frame frequency at z = 6.8076 (243.3465 GHz), based on a channel resolution of 30 km s−1. The gray region corresponds to the rms per channel. The spectra represent the: (a) Upper panel: central source C; (b) Central panel: N1+N2 emissions; and (c) Bottom panel: west emission. The regions are marked in Fig. 1.
Current usage metrics show cumulative count of Article Views (full-text article views including HTML views, PDF and ePub downloads, according to the available data) and Abstracts Views on Vision4Press platform.
Data correspond to usage on the plateform after 2015. The current usage metrics is available 48-96 hours after online publication and is updated daily on week days.
Initial download of the metrics may take a while.