Fig. 1.
Download original image
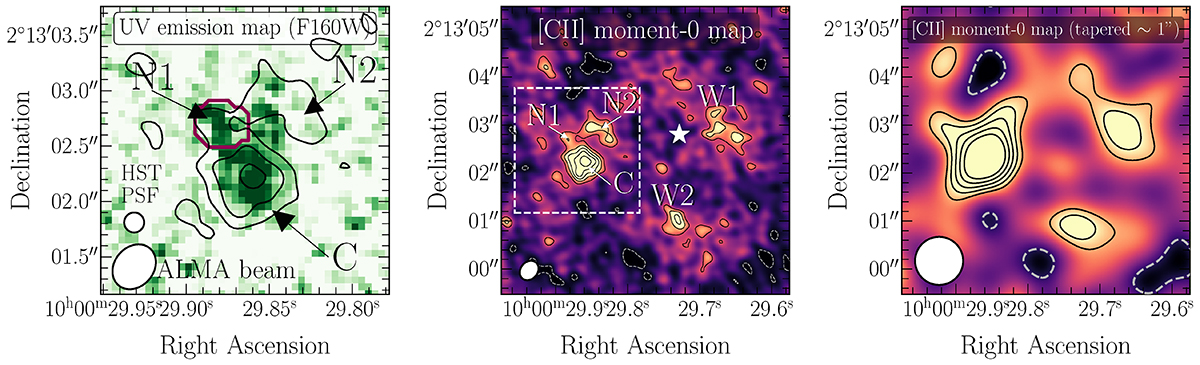
Rest-frame UV and [C II] line maps of the galaxy COS2987 and its surroundings. Left: HST F160W-band image in the background shows the rest-UV emission in a 1.3″ × 1.3″ region around the galaxy. The [C II] integrated map (moment-0) is overlaid as black contours shown at 2-, 4- and 6-σ, where σ is the rms noise level of the moment-0 map. The region containing the foreground galaxy identified by Laporte et al. (2017) is highlighted by the purple line. Middle: zoom-out version of the [C II] moment-0 map toward COS2987 (6″ × 6″). The region shown in the left panel is represented by the dashed white line. We marked the locations of the central source (C), north-east emission (N1), north-west arm (N2), west emission (W1), and south-west emission (W2). The black contours represent the integrated [C II] line emission at 2-, 3-, 4-, 5-, and 6-σ levels and the dashed white contour represents the -2-σ level. The white star corresponds to a galaxy observed in the F160W-band map at zphot = 1.73 (Laigle et al. 2016). Right: [C II] line integrated map tapered to a 1″ beam size, showing the same region as in the central panel. The black contours represent the 2-, 4-, 6-, 8-, and 10-σ levels and the dashed white contour represents the -2-σ level.
Current usage metrics show cumulative count of Article Views (full-text article views including HTML views, PDF and ePub downloads, according to the available data) and Abstracts Views on Vision4Press platform.
Data correspond to usage on the plateform after 2015. The current usage metrics is available 48-96 hours after online publication and is updated daily on week days.
Initial download of the metrics may take a while.