Fig. A.3.
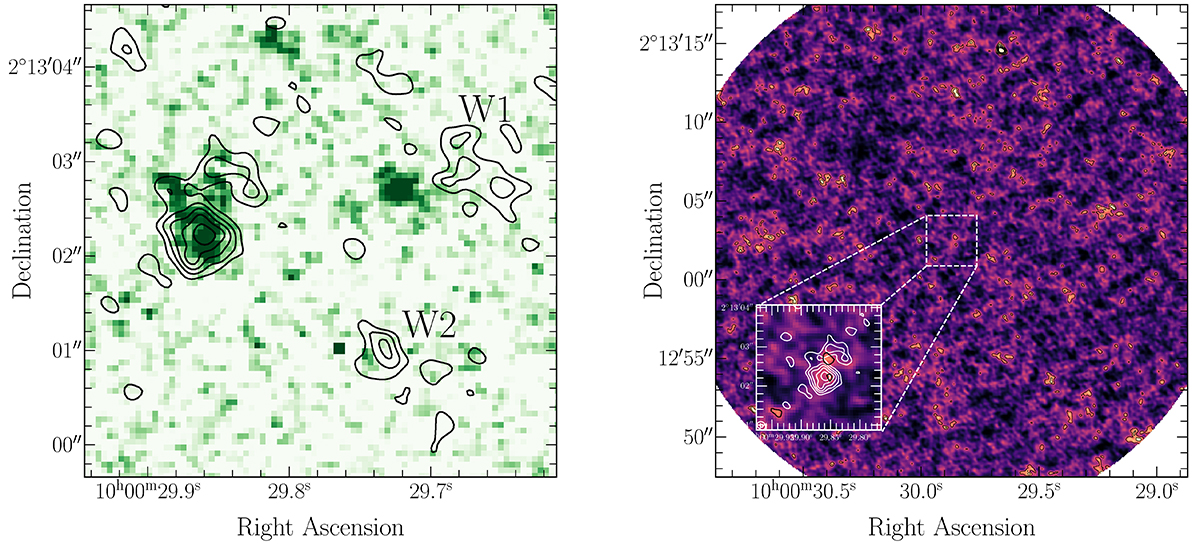
Download original image
Wide-field rest-frame UV and continuum maps of COS2987 and surrounding regions. (a) Left panel: HST F160W-band image in a 6″ × 6″ region containing the central source and the candidate [C II] emitters (see Section 3.1). The [C II] moment-0 map is overlaid in black contours represented by the significance levels of 2-, 3-, 4-, 5-, 6-σ. (b) Right panel: Continuum map of the COS2987 field. The black lines correspond to the continuum significance levels from 2- to 7-σ at steps of 1-σ. In the bottom left panel within the main panel, we zoom in the central source in a 4″ × 4″ region. The overlaid white lines represent the [C II] moment-0 map for the significance levels from 2- to 6-σ, at steps of 1-σ.
Current usage metrics show cumulative count of Article Views (full-text article views including HTML views, PDF and ePub downloads, according to the available data) and Abstracts Views on Vision4Press platform.
Data correspond to usage on the plateform after 2015. The current usage metrics is available 48-96 hours after online publication and is updated daily on week days.
Initial download of the metrics may take a while.