Fig. 4.
Download original image
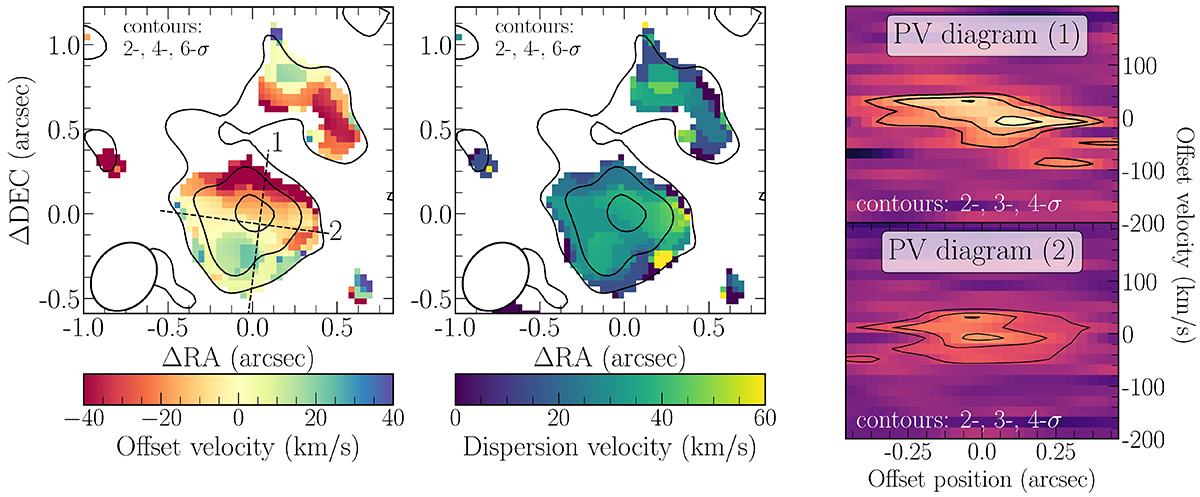
Velocity (Moment-1) and dispersion (Moment-2) maps of the galaxy COS2987 (with respect to the observed frequency of [C II] at redshift z = 6.8076) are shown in the left and right panels, respectively. The black contours correspond to the 2-, 4-, 6-σ levels of the [C II] integrated (moment-0) map. In the right panel, we plot the position-velocity diagram of slits 1 and 2, shown on the left panel as dashed lines. The black contours correspond to the 2-, 3-, and 4-σ levels of the position-velocity diagram.
Current usage metrics show cumulative count of Article Views (full-text article views including HTML views, PDF and ePub downloads, according to the available data) and Abstracts Views on Vision4Press platform.
Data correspond to usage on the plateform after 2015. The current usage metrics is available 48-96 hours after online publication and is updated daily on week days.
Initial download of the metrics may take a while.