| Issue |
A&A
Volume 665, September 2022
|
|
|---|---|---|
| Article Number | A8 | |
| Number of page(s) | 19 | |
| Section | Galactic structure, stellar clusters and populations | |
| DOI | https://doi.org/10.1051/0004-6361/202141912 | |
| Published online | 31 August 2022 | |
Extra-tidal star candidates in globular clusters of the Sagittarius dwarf spheroidal galaxy⋆
1
European Southern Observatory, Alonso de Córdova 3107, Vitacura, Santiago, Chile
e-mail: This email address is being protected from spambots. You need JavaScript enabled to view it.
2
Department of Physics and Astrophysics, University of Delhi, Delhi 110007, India
3
Millennium Institute of Astrophysics, Av. Vicuña Mackenna 4860, 782-0436 Macul, Santiago, Chile
4
Instituto de Alta Investigación, Sede Esmeralda, Universidad de Tarapacá, Av. Luis Emilio Recabarren 2477, Iquique, Chile
5
Instituto de Astronomía, Universidad Católica del Norte, Av. Angamos 0610, Antofagasta, Chile
6
Departamento de Ciencias Fisicas, Facultad de Ciencias Exactas, Universidad Andres Bello, Av. Fernandez Concha 700, Las Condes, Santiago, Chile
7
Vatican Observatory, V00120 Vatican City State, Italy
Received:
30
July
2021
Accepted:
25
May
2022
Abstract
Context. Globular clusters (GCs) associated with the Sagittarius dwarf spheroidal galaxy (Sgr dSph) have evolved under the gravitational potential of both Sgr dSph and the Milky Way. The effects of these potentials are most pronounced in the extra-tidal regions as compared to the central regions of the GCs.
Aims. We aim to study the extra-tidal regions of the GCs that are possibly associated with Sgr dSph, namely Arp 2, Terzan 8, NGC 5634, NGC 6284, Terzan 7, NGC 2419, NGC 4147, M 54 and Pal 12, using data from the Gaia early data release 3.
Methods. We selected the extra-tidal candidates based on their angular distances from the cluster centre in the RA-Dec plane, proper motions of the clusters and the individual extra-tidal star candidates, and their positions on the colour-magnitude diagrams of the clusters.
Results. We found extra-tidal candidates for the nine studied GCs. For eight of them, the surface density of candidate extra-tidal stars in the vicinity of the clusters is in significant excess with respect to more distant surrounding fields. No extended extra-tidal features beyond 5 tidal radii were detected for any of the clusters.
Conclusions. We publish a list of the most probable extra-tidal candidates that we determined using Gaia astrometric and photometric data. Our analysis shows that the clusters that are associated with Sgr dSph are more likely affected by the gravitational potential of the Sgr, as the distribution of extra-tidal stars is elongated in the same direction as the local stream. NGC 4147 is the only exception. We found some high-probability candidate extra-tidal stars in several of the analysed clusters. We failed to detect any coherent large-scale tidal tail around them.
Key words: globular clusters: general / galaxies: clusters: individual: Sgr dSph / galaxies: dwarf / Galaxy: formation / Galaxy: stellar content
Tables containing list of extra-tidal star candidates are only available at the CDS via anonymous ftp to cdsarc.u-strasbg.fr (130.79.128.5) or via http://cdsarc.u-strasbg.fr/viz-bin/cat/J/A+A/665/A8
© R. Kundu et al. 2022
 Open Access article, published by EDP Sciences, under the terms of the Creative Commons Attribution License (https://creativecommons.org/licenses/by/4.0), which permits unrestricted use, distribution, and reproduction in any medium, provided the original work is properly cited.
This article is published in open access under the Subscribe-to-Open model. This email address is being protected from spambots. You need JavaScript enabled to view it. to support open access publication.
1. Introduction
In the Λ cold dark matter universe, the growth of galaxies is hierarchical, meaning that dwarf galaxies are cannibalised by large galaxies (Rodriguez-Gomez et al. 2016; Bullock & Boylan-Kolchin 2017). The Sagittarius dwarf spheroidal galaxy (Sgr dSph) (Ibata et al. 1994, 1995) is a clear example of such a phenomenon. Soon after its discovery, the first numerical simulations predicted that Sgr dSph is undergoing tidal disruption (Johnston et al. 1995) due to its interaction with the Milky Way (MW). Indeed, thanks to all-sky and pencil-beam surveys, several clear detections of the stellar stream were achieved across the whole sky (e.g., Martínez-Delgado et al. 2001; Newberg et al. 2002; Majewski et al. 2003; Belokurov et al. 2006; Koposov et al. 2012; Huxor & Grebel 2015; Navarrete et al. 2017; Hasselquist et al. 2019; Hayes et al. 2020; Antoja et al. 2020; Ibata et al. 2020). Sgr dSph thus represents an excellent laboratory to study the past, present, and future dynamic states of stellar systems subject to ongoing tidal stripping. In this context, while its main body helps us to understand the state of the galaxy before the stripping process took place, the outer regions of the core and the remarkable streams provide information about the present and future stages, respectively (Law & Majewski 2016).
A number of globular clusters (GCs) are believed to have formed within Sgr dSph, with varying degrees of certainty (see e.g., Massari et al. 2019; Antoja et al. 2020; Forbes et al. 2020; Bellazzini et al. 2020; Minniti et al. 2021b, and references therein). Four of them, namely M 54 (NGC 6715), Terzan 7, Terzan 8, and Arp 2, are in close proximity or within the main body. They share distance, radial velocity (RV), and proper motion (PM) with this main body, and are thus believed to be still gravitationally bound to it (see e.g., Da Costa & Armandroff 1995; Law & Majewski 2010a; Sohn et al. 2018; Bellazzini et al. 2020, and references therein). In particular, M 54 was found to reside in the Sgr dSph core by Monaco et al. (2005) when they analysed the density profile of the galaxy, although it is possible that it formed outside the core and later fell in the central potential well, perhaps as a result of the interaction with the MW (Bellazzini et al. 2008). Based on the high-resolution analysis of five giant stars from Terzan 7, Sbordone et al. (2005) found that the cluster shares the same low α/Fe and low Ni/Fe ratios as Sgr dSph stars in the same metallicity range, confirming its association.
Many other MW clusters, currently not close to Sgr dSph, show (to varying degrees of confidence) kinematical, positional, or chemical indications of having formed in that galaxy, and having been subsequently stripped. Among them, the best case is Palomar 12 (Pal 12), which is considered as being associated with the Sgr stream on kinematical grounds (Martínez-Delgado et al. 2002; Bellazzini et al. 2003; Law & Majewski 2010a; Sohn et al. 2018). It also shares a number of highly peculiar chemical signatures with Sgr dSph (Cohen 2004; Sbordone et al. 2007b) and is thus considered a bonafide Sgr dSph member.
NGC 4147 has been proposed as a candidate member by some authors (Bellazzini et al. 2003; Law & Majewski 2010a), although recent studies have discarded any association with Sgr dSph by means of PM analysis and chemical abundances (see e.g., Villanova et al. 2016; Sohn et al. 2018). A possible connection between the cluster and one of the oldest arms of the Sgr stream has been recently proposed by Bellazzini et al. (2020), based on RR Lyrae stars. High-resolution abundance analyses of NGC 5053 and NGC 5634 (Sbordone et al. 2015; Carretta et al. 2017) show plausibly but inconclusively that they might have originated in Sgr dSph, while Tang et al. (2018) discard any association between NGC 5053 and Sgr dSph based on tentative chemical evidence (mostly different [Mg/Fe] abundances) and the past orbit of the cluster. Recent studies have associated the cluster with the LMS-1 stellar stream (Yuan et al. 2020); Malhan et al. 2021). The kinematic study of Withing 1 stars by Carballo-Bello et al. (2017) show that the velocity components of the cluster match with the velocity component of leading and trailing arms of the Sgr stream, supporting the association between this young (5 Gyr, Carraro et al. 2007) GC and Sgr dSph.
From the Law & Majewski (2010b, hereafter LM10) analysis, NGC 2419 was not considered to be associated with the Sgr stream due to its large distance. However, Belokurov et al. (2014) demonstrated that this cluster, the most distant GC from the Sgr dSph centre, is located at the apo-centre of the trailing arm of the stream. This association was recently confirmed, based on its kinematics and age, by Massari et al. (2019), along with Withing 1 and Pal 12.
The distribution of stars in the extra-tidal region of a GC is affected by various forces acting on it. The GCs associated with Sgr dSph have evolved under the potential of both MW and Sgr dSph itself. Therefore, by studying the outer regions of these clusters, we can gain insights into the prominent forces dominating the various regions of the Sgr dSph system. We aim to study the extra-tidal area around these clusters in a systematic way, using both astrometry and photometry to assess the level and distribution of possible extra-tidal stars on top of Sgr dSph and Sgr stream stars. To the best of our knowledge, no systematic study of the extra-tidal regions of these Sgr’s GCs has been performed, although some clusters have been individually studied searching for tidal tails, using different techniques and data sets (e.g., Leon et al. 2000; Carballo-Bello et al. 2014; Jordi & Grebel 2010).
The European Space Agency’s Gaia mission (Gaia Collaboration 2016) observations have been very helpful in the studies of MW tidal streams (Ibata et al. 2018, 2019a,b; Malhan et al. 2018; Palau & Miralda-Escudé 2019; Antoja et al. 2020), providing precise PMs for the first time, along with parallaxes for more than one billion sources. The Gaia early data release 3 (Gaia Collaboration 2021b, hereafter Gaia EDR3) published precise PMs (with errors of the order of 0.05 mas yr−1 for sources brighter than G = 17 mag) for an unprecedentedly large number (over 1.4 billion) of stars. We used Gaia EDR3 astrometry and photometry data to study the extra-tidal regions of 11 GCs, based on the recent results of Bellazzini et al. (2020, hereafter B20): M 54, Terzan 7, Arp 2, Terzan 8, Pal 12, Whiting 1 (confirmed members), NGC 2419, NGC 5634, NGC 4147 (likely to be associated with Sgr dSph), Pal 2 and NGC 6284 (unlikely candidate members). Recently, Minniti et al. (2021b,a) discovered 20 new GC candidate members of Sgr dSph. As the nature of some of these low-luminosity cluster candidates (Garro et al. 2021) embedded in the main body of Sgr is still under debate (Piatti 2021), they are not included in the present work.
This paper is organised as follows: in Sect. 2 we describe the methodology followed to select the extra-tidal candidates for the clusters; in Sect. 3 we estimate the level of contamination around the clusters, along with the possible directions of any extended extra-tidal features that may be present; in Sect. 4, we search for RV measurements in the literature of the extra-tidal star candidates to confirm their origin; and in the last two sections, we present our results and our concluding remarks.
2. Selecting extra-tidal candidates
In this work, astrometry and photometry data from Gaia EDR3 was used. We first selected a sub-sample of astrometrically well-behaved sources, following the same criteria suggested in the data release papers (Gaia Collaboration 2021a,b):
(1.) RUWE < 1.4
RUWE is the re-normalised unit weight error. This condition ensures that we use the stars whose astronomical observations are well fitted by a single-star model. Higher values may indicate some problematic or non-single sources.
(2.) ASTROMETRIC_EXCESS_NOISE_SIG ≤ 2
Excess noise is the extra noise in each observation assumed to explain the residual scatter in the astrometric solution. If ASTROMETRIC_EXCESS_NOISE_SIG is greater than two, then this excess noise is statistically significant.
(3.) ASTROMETRIC_GOF_AL < 3
This parameter represents how good the fit is between the astrometric model and the observations. Higher values indicate a bad fit.
(4.) VISIBILITY_PERIODS_USED > 10
This parameter indicates the set of observations separated by at least 10 days. A higher value indicates that the source is well observed.
(5.) 0.001+0.039(BP-RP) < log10 excess_flux < 0.12+0.039(BP-RP).
Excess_flux is the corrected phot_bp_rp_excess_factor (Riello et al. 2021). This factor can be estimated using the Python code provided by Gaia Collaboration (2021b, Fig. B.2). The sources that are out of this range have inconsistent fluxes for various reasons, such as the presence of another nearby source, or the observed source may be an extended source.
We applied the above criteria to all the stars within five times the King (1962) tidal radii (rt) of the nine clusters. Two additional clusters, Pal 2 and Withing 1 were originally part of the sample, but they did not have enough astrometrically well-behaved stars (310 and 13 sources inside their rt for Pal 2 and Withing 1, respectively) to get a clean colour–magnitude diagram (CMD) of the cluster stars and were therefore excluded.
In order to select the extra-tidal candidates of each cluster, we select the stars with similar PMs and CMDs as the cluster stars inside one rt, similar to the criteria used in Kundu et al. (2019b,a, 2021). Stars lying between rt to 5rt from the cluster centre were considered as the extra-tidal candidates in this study. The coordinates, adopted rt, and Jacobi radius (rJ)1 of each cluster are listed in Table 1.
Physical and kinematic parameters of the clusters studied in this work.
2.1. Proper motion selection
Using the sub-sample of astrometrically well-behaved sources inside their rt, we first estimate the PM distributions of each of the nine clusters. To do this, we used a Gaussian mixture model, including two components: one narrow Gaussian distribution for the cluster stars, and one broad Gaussian distribution for the field population. In order to fit the models, the Python package Scikit-Learn was used (Pedregosa et al. 2011), which finds the best model to fit the data using an expectation–maximisation algorithm. A full covariance was used, allowing asymmetrical distributions to be fitted. From the best fit, the mean and standard deviation for the cluster and field population were recovered. The linear correlation coefficient, ρ, was derived from the resulting (non-diagonal) correlation matrix, calculating the tangent of the eigenvalues of the covariance matrix. The central value of the prominent Gaussian distribution is taken as the PM of the cluster, and the sigma of the distribution, σcluster, is considered as the intrinsic dispersion of the cluster PM distribution. Figure 1 shows the PM vector-point diagram for each cluster, showing the one σ ellipse for the best fit model PM distribution. In the case of Arp 2, Terzan 7, NGC 6284 and Pal 12, only stars brighter than G = 19 mag and inside one-third of rt were used for the figure and the Gaussian fit, as the clusters are embedded in high-density regions that dominate the PM diagram over the scarce cluster population when all the sources inside the nominal rt are considered. The estimated PM values, along with the dispersion in each direction and the linear correlation coefficient for each of the clusters, are listed in Table 1. Tables A.1 and A.2 present the uncertainties associated with each measurement, including the parameters for the field population around each cluster region.
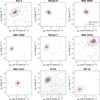 |
Fig. 1. Centre of the PM distribution ±3σ (red lines) for each cluster, determined as the centre and dispersion of the Gaussian fit of the cluster stars inside one rt (grey dots). For Arp 2, Terzan 7, NGC 6284 and Pal 12, one third of the nominal rt was used (see the text for further details). |
From Fig. 1 it can be seen that, for most of the clusters, the PMs are not completely symmetrical and their dispersions can be significant. Therefore, in order to include all possible extra-tidal candidates, we need to search for stars that have compatible PMs, and take into consideration the dispersion in the PM distributions. This is the reason why we decided to perform a fit to the PM distribution instead of using the values already reported in the literature. In fact, our adopted PM values agree with the values reported in Vasiliev & Baumgardt (2021), within the errors. However, the errors published in the aforementioned study do not represent the intrinsic dispersion on the PM distribution, but instead the error on the mean, and a selection based on these values would lead to the loss of many probable extra-tidal candidates. Vasiliev & Baumgardt (2021) published the PM dispersion profile for a sub-sample of clusters, including M 54, NGC 5634, NGC 4147 and NGC 6284, while the rest of the clusters studied in this work are not included. We compared these values with those derived in this work, for the four clusters in Appendix A.
As the clusters are embedded inside the Sgr stream stars, the PM distribution could have been fitted with a model including a superposition by three Gaussians. However, the Sgr stream stars’ PMs are almost indistinguishable from the PM distribution of the cluster, which is the most prominent inside one rt. To decide the number of Gaussians to be used in the fit, we used the Bayesian Information Criterion (BIC, Schwarz 1978) and Akaike Information Criterion (AIC, Akaike 1974), finding that there was no significant difference between the information criteria values obtained when using two or three Gaussian components. Repeating the fit to the data, through the expectation–maximisation algorithm, a narrow distribution for the cluster stars, and a broad distribution for the field stars were always recovered, while the third component’s mean and standard deviation change from one realisation to the next. Therefore, we decided to use a bivariate Gaussian fit considering only two Gaussians, at the expense of including Sgr core and stream stars in the fit for the Gaussian distribution of the cluster stars.
Given the mean and the dispersion of the PM distribution of the cluster stars, we proceed to estimate the probability of each star (up to five rt) to be associated with a given cluster, based on its PM. To estimate the probability, we tested the two following methods: (1) In the first method, for each star, the PM in the RA and Dec planes was modelled as a bivariate function, with mean value as the PM of the star, and the covariance matrix containing sigma errors and correlation in the PM. To estimate the probabilities, we integrated the bivariate function between the range of the PM defined by the cluster population (PMcluster ± 3σcluster; seventh and ninth columns in Table 1); (2) In the second method, membership probabilities were computed adopting the same formulation and methodology as described in Sect. 4 of Sariya & Yadav (2015). Here, we adopted the mean PM of the cluster from estimates in the previous section and assumed the radius of the distribution as the intrinsic dispersion on the cluster’s PM. The errors and the correlation between the two PM components used to estimate the probabilities were also determined using the member stars (the stars which are inside the rt of the cluster).
To select one of the above approaches, we tested both of them using RV data available in the literature. Kimmig et al. (2015) recently published RV data for 25 GCs. Two clusters, namely M 54 and NGC 4147, were common between their sample and ours. M 54 has a wide range of RVs (between 100 km s−1 and 180 km s−1, Bellazzini et al. 2008), which could lead to the inclusion of many false positives. Therefore, it does not present a good testing environment. Hence, we tested these approaches with NGC 4147. We had 14 stars in our search radius and five of them had RVs compatible with the cluster (183.2 ± 0.7 km s−1, Harris 2010), within 3σ error. We found that, based on the first approach, all 14 stars were selected as part of the cluster, with probabilities > 50%. However, based on the second approach, just three of the 14 stars had probabilities of being part of the cluster > 50% and were selected based on their PMs. These three stars had RVs compatible with the cluster. According to this simple test, in the case of NGC 4147, we found that the first approach provides a complete list of extra-tidal candidates but at the expense of including some false positives (in this case 64% false positives). However, in the second approach, the list of the extra-tidal candidates may not be complete but it contains the most probable extra-tidal candidates. In this paper, we adopted the second approach to analyse the extra-tidal regions of the clusters.
To select the extra-tidal candidates, first, the probabilities of the stars having compatible PM with the cluster were estimated. The PM of the clusters (especially in core clusters) is similar to the Sgr field stars. This could lead to the misclassification of Sgr field stars as cluster stars. Hence, we also calculated the probability of the stars being compatible with the PM of the Sgr dSph field population. To get the PM of the Sgr dSph field population, Eq. (1) from Ibata et al. (2020) was used, converting the PMs from the heliocentric Sagittarius coordinates into (RA, Dec) celestial coordinates using the Gala python module (Price-Whelan 2017). The stars from the main body of Sgr dSph generally have PMs that are similar to those of the inner clusters due to their dynamical common origin, and hence the Eq. (1) from Ibata et al. (2020) is helpful to separate both populations. Equation (1) in Ibata et al. (2020) is a linear fit to the PM in the Lambda direction, assuming that the Sgr stars are moving in a plane. Thus, we adopted μB + μB, reflex = 0.0 mas yr−1. We adopted the standard deviation on the mean PMs as 0.4 mas yr−1, also mentioned by Ibata et al. (2020). Then, only the stars whose total probability of having a PM compatible with the PMs derived for the cluster was greater than 50%, but also whose probability was equal to or greater than the probability of having a PM compatible with the Sgr dSph field population, were selected and further analysed in the next step.
2.2. Colour–magnitude selection
The CMDs of the cluster stars were constructed using the Gaia EDR3 photometry. To select the cluster stars, only the stars lying inside the rt of the cluster and having similar PMs as derived for the cluster were considered. Up to this point, the individual probabilities based on the PMs were not considered (for cluster stars), as the goal was to recover the CMD of the cluster, even if some faint cluster stars tend to have lower probabilities (due to large errors in PMs). The CMDs of the clusters were de-reddened using the E(B − V) value for each star from the Schlafly & Finkbeiner (2011) 2 reddening maps and the corresponding coefficients for the Gaia band-passes (retrieved from the PARSEC3 web interface). From the CMD of the clusters, we traced the cluster population with the PARSEC stellar isochrones (Bressan et al. 2012; Marigo et al. 2017), while the horizontal branch (HB) populations were traced using the zero-age horizontal branch (ZAHB) models4 from Valcarce et al. (2012), adopting the stellar parameters (distance, metallicity, [α/Fe], and initial mass on the HB) from various sources in the literature, as listed in Table 2.
Parameters of the clusters used to generate the isochrones and ZAHBs.
Figure 2 shows the isochrones (orange and pink lines), along with the ZAHBs (yellow line) and the Gaia EDR3 de-reddened CMDs of the clusters. Grey dots represent the cluster stars whose PMs match with the PMs of the clusters within a 1σ range. Black dots represent the cluster stars whose probability of having a PM compatible with the cluster is more than 50% and also equal to or more than the probability of having a PM compatible with the Sgr dSph population. The orange line represents the isochrone based on the adopted parameters (Forbes & Bridges 2010), while the pink line shows isochrones based on the parameters from Carretta et al. (2009), except for Terzan 7 (from Sbordone et al. 2007a) and Terzan 8 (from Harris 2010). It can be seen that the CMDs are in good agreement with the isochrones based on the Forbes & Bridges (2010) stellar parameters, although part of the red giant branch (RGB) tends to be slightly redder than the isochrone. The blue lines show the limits (±0.1 mag in colour and G-magnitude) adopted in this work for selecting a star as an extra-tidal star for the cluster. Finally, the extra-tidal candidates selected based on these limits are shown with red dots. Two stellar sequences can be seen in the case of M 54, both having similar PMs, inside one rt. The second, reddest sequence, belongs to a much younger population from Sgr dSph, which is traced by the light blue isochrone in Fig. 2, corresponding to the well known high-metallicity population in the core of Sgr dSph (Bonifacio et al. 2004; Sbordone et al. 2007a; Siegel et al. 2007). Both RGBs, from the cluster and the Sgr dSph population, could overlap around G ∼ 18 mag. Therefore, to avoid including contamination from Sgr dSph, the selection of potential extra-tidal candidates in this case was restricted to stars brighter than G = 18 mag.
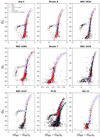 |
Fig. 2. Gaia EDR3 de-reddened CMDs of the clusters (grey dots) along with the selected extra-tidal candidates (red dots) and PARSEC isochrones (solid lines). The orange and pink lines represent the isochrones for each cluster based on parameters from the literature (see the text for further details). The yellow line corresponds to the ZAHB ridgeline at the distance of each cluster. The dashed blue lines define the selection cuts applied in order to select the extra-tidal candidates around the clusters. |
The mean parallax and corresponding dispersion for each cluster were calculated using the cluster stars. The distribution of some clusters includes also negative parallaxes, which are indicative of the uncertainty on the parallax measurement and the distribution itself (see e.g., Pancino et al. 2017). However, Lindegren et al. (2018) concluded that the negative parallaxes are a natural outcome of Gaia measurements. Therefore, extra-tidal star candidates whose parallaxes were out of the 3σ range of the parallax distribution were discarded, while the stars with parallaxes compatible with the cluster parallax distribution were kept, even if the values were negative. To discard nearby stars, sources with parallax values greater than 0.5 mas were discarded from the extra-tidal star candidates.
The density maps of the selected extra-tidal candidates (Nextra-tidal), along with the PM direction (red line), rt and rJ of each cluster are shown in Fig. 3. The contour lines represent the iso-density regions with a constant number of stars per square degree. In the title of each panel, the name of the cluster and the number of extra-tidal star candidates are indicated. The density maps were created using the kernel density estimator (KDE) routine from the scipy module (Virtanen et al. 2020). The bandwidths of the Gaussian KDE used were 5.0, 5.0, 12.8, 3.8, 8.0, 12.7, 7.43, 8.3, and 16.8 arcmin for Arp 2, Terzan 8, NGC 5634, NGC 6284, Terzan 7, NGC 2419, NGC 4147, M 54, and Pal 12, respectively. The figure also shows the direction towards the Galactic centre (pink) and towards the core of Sgr dSph (blue). The light blue circle, the inner grey circle, and the outer grey circle correspond to the rJ, one rt, and five rt, respectively. Finally, to have a better understanding of these extra-tidal candidates5, we estimated their significance over the field population in the next section.
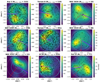 |
Fig. 3. Density map of the selected extra-tidal cluster candidates (black dots), along with the PMs (red), rt (grey), 5rt, and rJ (light blue). The directions of the Galactic centre (pink) and to the core of Sgr dSph (blue) are also shown. Contour lines represent the iso-density regions with a constant number of stars per square degree. |
3. Contamination Analysis
In this section, we estimate the amount of possible contaminations due to the Galaxy and Sgr dSph populations in the number of extra-tidal candidates that we estimated in the previous section. To do this, we selected several regions around each GC. These regions are at least 10rt away from the cluster centre and each has an area of 5rt. We cleaned the samples to retain only astrometrically well-behaved sources and then selected the stars by applying the same criteria as explained in Sect. 2. We do not consider any variation or gradient in the PMs of the Sgr dSph population because our aim is to estimate the number of Sgr or MW stars that randomly fall inside the same selection cuts, as the extra-tidal candidates.
In the contamination analysis, the clusters closest to the Sgr dSph main body were handled very carefully as the density of the field stars around them changes rapidly with a slight change in the coordinates. Hence, we used data from B20 to select as comparison fields those having a similar stellar density to that of the cluster (Bellazzini, priv. comm.). M 54 was not considered as it coincides with the Sgr dSph core and, therefore, we could not find any other region with a similar number density population to that of the cluster. In the case of Arp 2, Terzan 7, and Terzan 8 (the closest to the core of Sgr), we selected only two comparison fields, which approximately lie on the same iso-density contours of the Sgr dSph population as that of the clusters. The two comparison regions are located at an angular separation of 15, 21, and 34, and 18, 34, and 39 times rt for Arp 2, Terzan 7, and Terzan 8, respectively. This angular separation goes from 2.2 deg to 3.8 deg. The CMDs and vector point diagrams for these clusters and the two comparison fields are included in Appendix B.
For the other clusters that are more distant from the core of Sgr dSph, namely NGC 2419, NGC 4147, NGC 6284 and Pal 12, we selected eight comparison fields, in eight different directions around the clusters. These eight fields were in the northern, southern, eastern, western, north-eastern, north-western, south-eastern, and south-western directions from the cluster centres. The direction of increasing Dec was considered as north. For each of the clusters, northern, southern, eastern and western regions were 11rt, and north-eastern, north-western, south-eastern and south-western regions were 15.5rt from the corresponding cluster centre. Having several fields in different directions gave us the possibility of detecting the presence of any possible extended extra-tidal features beyond five times the rt, in a particular direction, if an overdensity of likely cluster star was found.
To get a full picture of the spatial distribution and orientation of the extra-tidal candidates, we overplotted their distribution over the spatial distribution of the LM10 model particles. Figure 4 displays the location of the centre of each cluster and comparison fields, along with the scaled number of field stars6. In Fig. 4, each cluster region is plotted including the particles from the model of LM10 that were likely stripped during the same perigalactic passage as each cluster (same Pcol as in Table 1 of B20). We compare the spatial distribution of the extra-tidal candidates with that of the LM10 model particle in that region to get a better idea if they are both governed by the same forces or not.
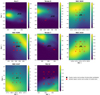 |
Fig. 4. Density map (stars per square degree) of Sgr dSph particles based on the LM10 model, along with the clusters (black) and the number of contaminants found around each cluster, and the scaled number of stars in each sample region (red), along with the corresponding number of extra-tidal candidates (black number and white dots). |
4. Results and discussion
extra-tidal star candidates are detected for nine GCs. We find 315, 110, 15, 248, 491, 38, 11, 233, and 77 stars for Arp 2, Terzan 8, NGC 5634, NGC 6284, Terzan 7, NGC 2419, NGC 4147, M 54, and Pal 12, respectively. Most of these stars lie on the RGB of the respective cluster CMD, except for stars belonging to NGC 4147 and Pal 12. For these two clusters, most of the stars lie on the main sequence of the clusters’ CMDs. Gaia photometry is good enough to get the CMDs of these clusters up to the main sequence turn-off, except for NGC 2419, which is the most distant cluster in our sample. HB extra-tidal candidates are detected for four of them, namely, Arp 2 (20 stars), Terzan 8 (seven stars), NGC 6284 (three stars), and M 54 (22 stars). Two of these HB stars are classified as RR Lyrae variable stars in the Gaia DR2 catalogue (Clementini et al. 2019); one star at 3.1 times rt from M 547, and one star at 4.3 times rt from Terzan 88. Given their position in the CMD, they are high-confidence extra-tidal stars from each cluster.
4.1. Level of contamination in the extra-tidal star candidates
We estimated the level of contamination in the number of extra-tidal candidates detected for each cluster by selecting sample regions in different directions around them and applying the same criteria we used to select the extra-tidal candidates. The distance between the centre of the cluster and the centre of the sample region was at least 10rt. This approach helps not only to detect the number of stars that may randomly fall under our selection criteria, but also to detect the presence of any extended tidal tail features around the cluster if there is an overdensity of stars in a preferred direction that could be connected to the overdensities recovered in the outskirts of the clusters.
It can be seen from Fig. 4 that the stars that pass our criteria to be selected as candidate extra-tidal stars are significantly more numerous (per unit area) in the surroundings of the cluster that in the control fields. This indicates that the selected extra-tidal candidates may have a very low level of contamination from MW foreground or background stars. This also indicates that the clusters do not seem to have any extended tidal-tails and the detected extra-tidal candidates seem to have a low level of contamination. This result could be due to the PM of the field stars in the sample regions (which are more than 10rt from the cluster centre), being significantly different from the PM of the cluster. However, some non-negligible contamination from the Sgr stream population could be present in the location of the extra-tidal stars.
4.2. Radial velocities
We expect the RV values of the stars belonging to a cluster to be concentrated around the mean RV of the cluster with small dispersion. Hence, a literature search was performed to get the RVs for the extra-tidal candidates to confirm their association with the corresponding clusters. Out of the 1538 extra-tidal candidates, we found RVs for eight stars from the extra-tidal star candidates around four of the studied clusters. In particular, one star with RV was found around NGC 2419 (from Ibata et al. 2011), three stars around NGC 4147 (from Kimmig et al. 2015), three stars around M 54 (from Majewski et al. 2017), and one star around Terzan 7 (from Frinchaboy et al. 2012) with measured RV values.
We considered a star as being compatible with the cluster population if its RV was within the RV dispersion of the cluster. The adopted mean RV and its dispersion value are those reported by Baumgardt et al. (2019). The mean RV for NGC 2419 is −21.1 ± 0.3 km s−1 (σRV = 5.6 km s−1), and so the star with RV equal to −19.04 ± 2.29 km s−1 was considered compatible with this cluster. The mean RV for NGC 4147 is 179.4 ± 0.3 km s−1 (σRV = 2.0 km s−1), and all three of the stars have RVs within the RV dispersion of the cluster, although one star has a large RV error of ∼80 km s−1. In order to select the compatible stars for M 54, we adopted the same limits as those adopted by Bellazzini et al. (2008), and stars with RVs between 100 km s−1 and 180 km s−1 were considered likely compatible with the cluster. Terzan 7 has a mean RV of 159.4 ± 0.4 km s−1 (σRV = 1.1 km s−1), and the extra-tidal candidate star has an RV value of 153.6 ± 1.4 km s−1, having no compatible RV with the cluster motion for only a few km s−1. Hence, based on this comparison, all but one of these eight stars have compatible RVs with their respective clusters. The positions of these stars on the respective Gaia EDR3 CMDs are shown in Fig. 5. Figure 6 shows the RVs of these eight stars with respect to their distances from the cluster centre. The grey line marks the mean RV of each cluster and the black lines represent the RV dispersion of the cluster. Red lines in the M 54 panel are the limits on the RV adopted by Bellazzini et al. (2008). The spatial distribution of the selected stars is shown as white dots in Fig. 3.
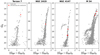 |
Fig. 5. Position of extra-tidal stars with compatible RVs on the respective Gaia EDR3 cluster CMDs. |
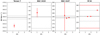 |
Fig. 6. Measured RVs of the stars with respect to their distances from cluster centres over the rt of each cluster. Red dots are the stars having RV measurements in the literature. The grey line is used for the mean RVs of the clusters, while the black lines represent the RV dispersion. Red lines in the M 54 panel are the limits on the RVs adopted by Bellazzini et al. (2008). The closest star to NGC 4147 has a larger RV error of ∼80 km s−1, extending beyond the limits of the plot. |
In the case of NGC 2419, the only extra-tidal star with a compatible RV is close to the rt of the cluster. Unfortunately, given the large distance of NGC 2419, there are very few studies in the literature that include RV measurements, and therefore no firm conclusions can be derived from this search. Conversely, for M 54 there are stars up to 4rt from the cluster centre, all of them having consistent RV. However, as the cluster is located inside the main body of Sgr dSph, it is difficult to separate the stars from the cluster itself from the stars that are part of the galaxy. Chemical abundances for these stars, which may become available in the future, could be the key to unambiguously separating both populations. In the case of NGC 4147, all the stars with compatible RVs are up to 15 arcmin from the cluster centre. This is already noticed in the work of Hanke et al. (2020), in which several extra-tidal stars are found, based on a chemodynamical search over the whole sky. However, inside 5rt, Hanke et al. (2020) only recover one star with a compatible RV. We have two additional stars from the sample of Kimmig et al. (2015). Having RVs in the literature compatible with the motion of the clusters for seven out of the eight extra-tidal star candidates with previous measurements confirms the fact that our candidate stars are most likely extra-cluster stars. RV measurements for all the candidates presented in this work are needed to confirm their individual nature.
4.3. Possible reasons for the presence of extra-tidal stars around the clusters
The list of extra-tidal candidates published in this work is not complete because, in an attempt to keep the sample as free as possible from false positives, we may have lost some genuine candidates. Once the RV measurements are available for all the candidates, it might be possible to confirm the overdensities detected in this work, and a better understanding of their origin could be assessed. Nonetheless, given the preliminary results obtained in this work, in particular those for the orientation of the overdensities of these candidates with respect the Sgr main body position, the Galactic centre, and the PM of the clusters, can be used for a cluster-by-cluster analysis. This could be further used to elucidate the reasons behind the presence of the detected extra-tidal star candidates.
Gnedin & Ostriker (1997) studied the effect of dynamical friction, relaxation, bulge, and disk shocks on GCs. Based on the destruction rates they provided, Arp 2, NGC 6284, M 54, and Pal 12 would be destroyed by bulge and disk shocks faster than by the other processes, while the rest of the clusters are equally affected by both relaxation and shocks. We analysed the destruction of these clusters based on the spatial distribution of the extra-tidal candidates around them.
Arp 2. Out of the 315 extra-tidal candidates, 271 are outside the cluster’s rJ. The density map, based on the extra-tidal candidates detected in this analysis, shows an overdensity contour towards the south-western direction. The overdensity is aligned with the PM in the leading direction. The morphology of extra-tidal candidates pointing towards and away from the cluster motion is typically due to tidal disruptions (Leon et al. 2000; Kuzma et al. 2015). However no overdensity in the opposite direction is seen. The core of Sgr dSph also lies on the western side (see Fig. 4) of the cluster. Hence, an explanation for these extra-tidal stars could be that these stars are being stripped apart due to the tidal forces acting on the cluster, and the gravitational force from the core of the Sgr is increasing its rate of destruction. It is worth mentioning that the level of possible contaminants among the extra-tidal stars (e.g., field stars with compatible PM and CMD positions) is very small, based on the scaled number of field stars in two adjacent, iso-density fields (see Sect. 4.2). Therefore, this large number of extra-tidal stars could indicate that the cluster is suffering more disruption than the other clusters in the main body and/or the adopted rt is underestimated. Salinas et al. (2012) also find an excess of blue stragglers beyond the rt of the cluster, and conclude that the cluster has already relaxed and is no longer under the process of two-body relaxation.
Terzan 8. 80 out of 110 detected extra-tidal stars are found outside the rJ of the cluster. The scaled number of field stars is negligible compared to the number of detected extra-tidal stars, which indicates a low level of contamination. The extra-tidal stars seem to be evenly distributed around the cluster in the region outside its rJ. This is an indication that the cluster may be most affected by the internal relaxation (Kuzma et al. 2016, 2017). However, a small overdensity aligned towards the leading direction of the PM of the cluster is seen inside its rJ. This overdensity of potential escapers is very similar to the one seen near Arp 2. It seems that the cluster is equally affected by internal relaxation and tidal forces, and being near to the core of the Sgr increases its destruction rate. Carretta et al. (2014) find a few stars with compatible RVs at distances from the cluster centre greater than 4 arcmin, up to 5.8 arcmin, considering all of them part of the cluster population. Salinas et al. (2012) find eight HBs lying outside the rt of the cluster, which may point towards a possible disruption of the cluster. Our findings support this scenario as we find extra-tidal candidates up to 19.8 arcmin.
NGC 5634. Five of the extra-tidal candidates detected for the cluster lie inside the rJ and the other ten lie outside. Although the number of extra-tidal stars around the cluster is small, the scaled number of field stars around this cluster is even smaller, indicating a low level of contamination among the extra-tidal stars. Based on the density map of the cluster, it seems to have two overdensities (within 5rt), aligned with the direction of the Sgr stream particles from the LM10 model (see Fig. 4), extending in the south-eastern and north-western directions. This could mean that the cluster is associated with Sgr dSph (also concluded by B20) as the extra-tidal candidates in the vicinity seem to be affected by the same gravitational field that is affecting the Sgr stream. Carballo-Bello et al. (2014) study this cluster (purely based on photometric data) and conclude that no extra-tidal features are seen around the cluster at the same distance as that of the cluster, but a similar population is seen in the background which is found to be two times more distant than the cluster itself.
NGC 6284. Based on B20, this cluster may not be associated with Sgr dSph. Nevertheless, we include it here for the sake of completeness of their published list of clusters. Its adopted rJ is a bit smaller than its rt, hence all the extra-tidal candidates should be unbound from the cluster. We again find a small scaled number of field stars around the cluster, indicating a low level of contamination. The number of extra-tidal stars is the largest among the clusters outside the main body of Sgr, reaching up to 248 stars. The density map of the extra-tidal candidates reveals that their overdensity contours point in the north-south direction. This does not seem to be aligned with the Sgr stream in that direction (based on the particles from the LM10 model, see Fig. 4). Based on B20 analysis, this cluster is not associated with Sgr dSph, which is also evident from the non-alignment of the extra-tidal stars with the Sgr stream particles. The morphology of the overdensity seems to resemble the typical S-shape of tidally stripped stars in the inner contour. Based on the destruction rates estimated in Gnedin & Ostriker (1997), this cluster is more prone to bulge and disk shocks, as its orbit crosses the Galactic plane (Baumgardt et al. 2019). If the overdensity were confirmed, this would be the first evidence of tidal tails emerging from the cluster, as far as we are aware.
Terzan 7. The adopted rt of the cluster is slightly smaller than its rJ, and therefore out of the 491 extra-tidal candidates, 484 are unbound from the cluster. The scaled number of field stars around the cluster again indicates a low level of contamination. The density map in Fig. 3 shows that the distribution of the extra-tidal candidates is mainly concentrated in the north-western semicircle around the cluster with an overdensity lying on the western side, between the PM direction and the direction towards the core. This is consistent with the distribution of the LM10 particles in the region (see Fig. 4). This may indicate that the extra-tidal region of the cluster may be mainly affected by the gravitational force of the Sgr dSph core. We find RV measurements for one of the extra-tidal candidates from Frinchaboy et al. (2012), having an almost compatible RV with the cluster motion, being less than 5 km s−1 offset from the mean RV ± RV dispersion of the cluster. We therefore consider this star as likely being compatible with its cluster. Although the star is outside the overdensities found in Fig. 3, it is still located on the north-western side of the cluster just outside its rJ.
NGC 2419. 12 stars out of the 38 extra-tidal candidates are outside the rJ of the cluster. Again, the scaled number of field stars around the cluster indicates that the extra-tidal candidates have a low contamination level. The density map of the region shows that the extra-tidal candidates outside the rJ are almost evenly distributed, without any preferred direction, forming an extended stellar envelope around the cluster (Kuzma et al. 2016, 2017). However, an overdensity of potential escapers is seen towards the western side of the cluster. This is again aligned with the direction of the Sgr stream, which indicates the association of the cluster with Sgr. The overdensity in the north-western direction, in the vicinity of the cluster, is also detected by Jordi & Grebel (2010), which could indicate that the cluster is dissolving with time. Previous studies on the presence of extra-tidal stars around the cluster did not agree on a single result (Ripepi et al. 2007; Bellazzini 2007). We also find RVs corresponding to one of the extra-tidal candidates in the literature (Ibata et al. 2011) and it is compatible with the mean RV of the cluster, which is reassuring as this is the most distant cluster of the sample and, therefore, the Gaia data astrometry for those stars is less precise.
NGC 4147. Out of the 11 candidates, six lie outside the rJ of the cluster and hence might be completely detached from it. The density map obtained for this cluster shows that the overdensity of extra-tidal candidates also lie inside the rJ. The scaled number of field stars around the cluster indicates a low level of contamination except in the north-western direction, which is also the direction of the overdensity. The cluster may have lost most of its loosely bound stars in the past and, presently, its stars are weakly affected by the gravitational forces affecting the Sgr stream. Jordi & Grebel (2010) also find an overdensity around the cluster in north-south direction, but our analysis only reveals one overdensity on the northern side. We find RVs for three extra-tidal candidates in the literature (Kimmig et al. 2015) and all of them are compatible with the RV of the cluster. The distribution of these stars (see Fig. 3) is very similar to the overdensity contour in the density map. The overdensity seen in this map is in the direction opposite to its motion and may be due to disk and/or bulge shocks.
M 54. This cluster almost coincides with the core of Sgr dSph galaxy in 3D space. The density map of these extra-tidal candidates shows an overdensity towards the western side of the cluster. We have searched up to 5rt of the cluster and the rJ is more than our search radius. Hence, although these stars are outside the rt of the cluster, they may not be out of its gravitational potential. The PM of the cluster is almost the same as the PM of the Sgr core and, therefore, we expect a lot of contamination among the selected extra-tidal stars around the cluster. However, its unique position makes it almost impossible for us to estimate the level of contamination in the extra-tidal candidates based solely on the photometric and astrometric data. We find RV measurements for three candidates (Majewski et al. 2017) and all of them have RVs compatible with the cluster up to almost four rt from the cluster centre (∼25 arcmin). This population of extra-tidal stars could extend even beyond the area studied in this work, although the identification of these stars depends on how different the PMs are from the cluster and the Sgr stream stars. Another approach to identify extra-tidal stars is based on peculiar chemical abundances. In fact, Fernández-Trincado et al. (2021) report a serendipitous discovery of a N-rich extra-tidal star at 45 arcmin (6rt) from the centre of M 54 with consistent chemical abundances as well as kinematics, including PM and RVs.
Pal 12. The adopted rt of the cluster is larger than its rJ and, therefore, all the 77 extra-tidal star candidates are gravitationally unbound from it. The overdensities are present in the southern part of the search radius (see the density map in Fig. 3). This direction is coincident with the location of the Sgr stream stars (based on the LM10 particles). Our results seem to be in good agreement with the scenario in which the cluster is associated with Sgr dSph, as both the cluster stars and the stream are aligned. Based on Musella et al. (2018, and B20) works, we a expect significant overdensity of Sgr stream stars in the same direction as the one detected in our analysis. Nonetheless, the PM of the cluster can be easily separated from the stream stars (see Fig. 4 in B20). Therefore, it is unlikely to have a significant number of Sgr stream stars to be included in the sample of extra-tidal star candidates recovered. In fact, from our analysis based on sample fields, a low contamination level is also indicated. In previous photometric studies, Leon et al. (2000) reported extended tidal tails around this cluster, and a larger rt based on the King profile. These results were later discarded by Musella et al. (2018), who find that the rt was overestimated due to an overdensity of Sgr stream stars, while no significant overdensity of extra-tidal Pal 12 stars was found. Our results agree with those of Musella et al. (2018) as there are no prominent, significant tidal tails emerging from this low-mass cluster, although there could be some unbound stars due to its stripping from the Sgr galaxy in the last peri-centric passage.
5. Conclusion
We analysed the extra-tidal regions of nine GCs possibly associated with Sgr dSph. We selected the extra-tidal candidates based on their position in the RA–Dec plane, on the PMs of the clusters and the stars, and on the position of the stars on the de-reddened CMDs of the clusters. We estimated the mean PMs and PM dispersion of the clusters using a superposition of two Gaussian models (one for the field stars and the other for the cluster population). We found extra-tidal candidates in nine of the clusters and determined the contamination levels around eight of them (excluding M 54 due to its unique position). For the contamination analysis, we selected two sample regions around the central clusters and eight sample regions around the rest of the clusters lying in different directions. This approach also enabled us to identify any real (not composed of field stars) extended extra-tidal features in a preferred direction that could be present around them. However, none of the fields had a scaled number of contaminants comparable with the number of extra-tidal stars around the corresponding cluster.
Clusters that are closer to the core of Sgr dSph (namely Arp 2, Terzan 7, and Terzan 8) seem to be more affected by Sgr dSph gravitational potential than the farthest clusters (NGC 4147, NGC 2419 and NGC 6284). Based on the findings by B20, NGC 5634 (likely member) and Pal 12 (confirmed member) are associated with Sgr dSph, whereas, NGC 6284 is most probably not associated with Sgr dSph, and the results based on the spatial distribution of the detected extra-tidal candidates are in agreement.
We do not find any extended (outside 5rt) extra-tidal features around any of the clusters. The reason for this could be that the stars that were lost in the past are no longer traceable based on the PMs and CMDs of the clusters, or the density of the stars is too low to be recovered based on RGB stars. They could have joined the Sgr stream and thus are no longer moving with the PM that might be related to the cluster. However, chemical analysis of stars in the regions surrounding these clusters might enable the discovery of such objects due to their similarity with the composition of the parent cluster.
To conclude, it is worth mentioning that all the candidates found in this work need to be confirmed by a star-by-star analysis of their RVs. Nonetheless, these are the most probable candidates based on the Gaia astrometry and photometry data available to date. Based on the adopted cuts, this list may not be complete as we may have lost a few of the real candidates at the expense of keeping the data free from false positives as much as possible. However, the membership of these stars could be confirmed once their RVs are available from future Gaia releases or spectroscopic follow-ups. Having the full 6D phase-space information for these candidates is crucial in order to really assess their origin and extension.
The stars that are outside the rJ are completely out of the gravitational potential of the cluster. However, the stars that are inside the rJ but outside the rt are potential escapers, and may still be bound to the cluster. See e.g., Fukushige & Heggie (2000), Baumgardt et al. (2010), Küpper et al. (2010), Carballo-Bello et al. (2011), Claydon et al. (2017).
The full list of the stars considered in each cluster with their classification will be made available as online material.
Scaled number of field stars = (number of selected stars in the region) × (total number of stars around the cluster) × (total number of stars in the region)−1.
Gaia ID 6761169716763303424.
Gaia ID 6741566416549068288.
Acknowledgments
Authors would like to thank the referee for constructive and useful comments which improved the quality of the draft significantly. We would like to thank M. Bellazzini for promptly providing the Sgr dSph population selection from B20. R.K. and D.M. are very grateful for the hospitality of the Vatican Observatory, where this collaboration was started. D.M. gratefully acknowledges support by the ANID BASAL projects ACE210002 and FB210003, and by Fondecyt Project No. 1220724. This research has made use of the NASA/IPAC Infrared Science Archive, which is funded by the National Aeronautics and Space Administration and operated by the California Institute of Technology. HPS acknowledges grant 03(1428)/18/EMR-II from Council of Scientific and Industrial Research (CSIR), India. J.G.F.-T. gratefully acknowledges the grant support provided by Proyecto Fondecyt Iniciación No. 11220340, and also from ANID Concurso de Fomento a la Vinculación Internacional para Instituciones de Investigación Regionales (Modalidad corta duración) Proyecto No. FOVI210020, and from the Joint Committee ESO-Government of Chile 2021 (ORP 023/2021). R.K. would also like to thank Riyal Rana, her daughter, who was born while the paper was still in the process, for giving her so much happiness.
References
- Akaike, H. 1974, IEEE Trans. Auto. Control, 19, 716 [Google Scholar]
- Antoja, T., Ramos, P., Mateu, C., et al. 2020, A&A, 635, L3 [NASA ADS] [CrossRef] [EDP Sciences] [Google Scholar]
- Baumgardt, H., Parmentier, G., Gieles, M., & Vesperini, E. 2010, MNRAS, 401, 1832 [CrossRef] [Google Scholar]
- Baumgardt, H., Hilker, M., Sollima, A., & Bellini, A. 2019, MNRAS, 482, 5138 [Google Scholar]
- Bellazzini, M. 2007, A&A, 473, 171 [NASA ADS] [CrossRef] [EDP Sciences] [Google Scholar]
- Bellazzini, M., Ferraro, F. R., & Ibata, R. 2003, AJ, 125, 188 [NASA ADS] [CrossRef] [Google Scholar]
- Bellazzini, M., Ibata, R. A., Chapman, S. C., et al. 2008, AJ, 136, 1147 [Google Scholar]
- Bellazzini, M., Ibata, R., Malhan, K., et al. 2020, A&A, 636, A107 [NASA ADS] [CrossRef] [EDP Sciences] [Google Scholar]
- Belokurov, V., Zucker, D. B., Evans, N. W., et al. 2006, ApJ, 642, L137 [Google Scholar]
- Belokurov, V., Koposov, S. E., Evans, N. W., et al. 2014, MNRAS, 437, 116 [NASA ADS] [CrossRef] [Google Scholar]
- Bonifacio, P., Sbordone, L., Marconi, G., Pasquini, L., & Hill, V. 2004, A&A, 414, 503 [NASA ADS] [CrossRef] [EDP Sciences] [Google Scholar]
- Bressan, A., Marigo, P., Girardi, L., et al. 2012, MNRAS, 427, 127 [NASA ADS] [CrossRef] [Google Scholar]
- Brown, J. A., Wallerstein, G., & Zucker, D. 1995, Am. Astron. Soc. Meet. Abstr., 187, 82.04 [NASA ADS] [Google Scholar]
- Brown, J. A., Wallerstein, G., & Gonzalez, G. 1999, AJ, 118, 1245 [NASA ADS] [CrossRef] [Google Scholar]
- Bullock, J. S., & Boylan-Kolchin, M. 2017, ARA&A, 55, 343 [Google Scholar]
- Carballo-Bello, J. A., Gieles, M., Sollima, A., et al. 2011, MNRAS, 419, 14 [Google Scholar]
- Carballo-Bello, J. A., Sollima, A., Martínez-Delgado, D., et al. 2014, MNRAS, 445, 2971 [Google Scholar]
- Carballo-Bello, J. A., Corral-Santana, J. M., Martínez-Delgado, D., et al. 2017, MNRAS, 467, L91 [Google Scholar]
- Carraro, G., Zinn, R., & Moni Bidin, C. 2007, A&A, 466, 181 [NASA ADS] [CrossRef] [EDP Sciences] [Google Scholar]
- Carretta, E., Bragaglia, A., Gratton, R., D’Orazi, V., & Lucatello, S. 2009, A&A, 508, 695 [NASA ADS] [CrossRef] [EDP Sciences] [Google Scholar]
- Carretta, E., Bragaglia, A., Gratton, R. G., et al. 2014, A&A, 561, A87 [NASA ADS] [CrossRef] [EDP Sciences] [Google Scholar]
- Carretta, E., Bragaglia, A., Lucatello, S., et al. 2017, A&A, 600, A118 [NASA ADS] [CrossRef] [EDP Sciences] [Google Scholar]
- Claydon, I., Gieles, M., & Zocchi, A. 2017, MNARS, 466, 3937 [CrossRef] [Google Scholar]
- Clementini, G., Ripepi, V., Molinaro, R., et al. 2019, A&A, 622, A60 [NASA ADS] [CrossRef] [EDP Sciences] [Google Scholar]
- Cohen, J. G. 2004, AJ, 127, 1545 [NASA ADS] [CrossRef] [Google Scholar]
- Da Costa, G. S., & Armandroff, T. E. 1995, AJ, 109, 2533 [Google Scholar]
- de Boer, T. J. L., Gieles, M., Balbinot, E., et al. 2019, MNRAS, 485, 4906 [Google Scholar]
- Fernández-Trincado, J. G., Beers, T. C., Minniti, D., et al. 2021, A&A, 648, A70 [Google Scholar]
- Forbes, D. A., & Bridges, T. 2010, MNRAS, 404, 1203 [NASA ADS] [Google Scholar]
- Forbes, D. A., Dullo, B. T., Gannon, J., et al. 2020, MNRAS, 494, 5293 [Google Scholar]
- Frinchaboy, P. M., Majewski, S. R., Muñoz, R. R., et al. 2012, ApJ, 756, 74 [NASA ADS] [CrossRef] [Google Scholar]
- Fukushige, T., & Heggie, D. C. 2000, MNRAS, 318, 753 [CrossRef] [Google Scholar]
- Gaia Collaboration (Prusti, T., et al.) 2016, A&A, 595, A1 [NASA ADS] [CrossRef] [EDP Sciences] [Google Scholar]
- Gaia Collaboration (Antoja, T., et al.) 2021a, A&A, 649, A8 [EDP Sciences] [Google Scholar]
- Gaia Collaboration (Brown, A. G. A., et al.) 2021b, A&A, 649, A1 [NASA ADS] [CrossRef] [EDP Sciences] [Google Scholar]
- Garro, E. R., Minniti, D., Gómez, M., & Alonso-García, J. 2021, A&A, 654, A23 [NASA ADS] [CrossRef] [EDP Sciences] [Google Scholar]
- Gnedin, O. Y., & Ostriker, J. P. 1997, ApJ, 474, 223 [Google Scholar]
- Hamanowicz, A., Pietrukowicz, P., Udalski, A., et al. 2016, Acta Astron., 66, 197 [NASA ADS] [Google Scholar]
- Hanke, M., Koch, A., Prudil, Z., Grebel, E. K., & Bastian, U. 2020, A&A, 637, A98 [EDP Sciences] [Google Scholar]
- Harris, W. E. 1996, AJ, 112, 1487 [Google Scholar]
- Harris, W. E. 2010, arXiv e-prints [arXiv:1012.3224] [Google Scholar]
- Hasselquist, S., Carlin, J. L., Holtzman, J. A., et al. 2019, ApJ, 872, 58 [Google Scholar]
- Hayes, C. R., Majewski, S. R., Hasselquist, S., et al. 2020, ApJ, 889, 63 [Google Scholar]
- Huxor, A. P., & Grebel, E. K. 2015, MNRAS, 453, 2653 [Google Scholar]
- Ibata, R. A., Gilmore, G., & Irwin, M. J. 1994, Nature, 370, 194 [Google Scholar]
- Ibata, R. A., Gilmore, G., & Irwin, M. J. 1995, MNRAS, 277, 781 [NASA ADS] [CrossRef] [Google Scholar]
- Ibata, R., Sollima, A., Nipoti, C., et al. 2011, ApJ, 738, 186 [NASA ADS] [CrossRef] [Google Scholar]
- Ibata, R. A., Malhan, K., Martin, N. F., & Starkenburg, E. 2018, ApJ, 865, 85 [NASA ADS] [CrossRef] [Google Scholar]
- Ibata, R. A., Bellazzini, M., Malhan, K., Martin, N., & Bianchini, P. 2019a, Nat. Astron., 3, 667 [Google Scholar]
- Ibata, R. A., Malhan, K., & Martin, N. F. 2019b, ApJ, 872, 152 [Google Scholar]
- Ibata, R., Bellazzini, M., Thomas, G., et al. 2020, ApJ, 891, L19 [NASA ADS] [CrossRef] [Google Scholar]
- Johnston, K. V., Spergel, D. N., & Hernquist, L. 1995, ApJ, 451, 598 [NASA ADS] [CrossRef] [Google Scholar]
- Jordi, K., & Grebel, E. K. 2010, A&A, 522, A71 [NASA ADS] [CrossRef] [EDP Sciences] [Google Scholar]
- Kimmig, B., Seth, A., Ivans, I. I., et al. 2015, AJ, 149, 53 [NASA ADS] [CrossRef] [Google Scholar]
- King, I. 1962, AJ, 67, 471 [Google Scholar]
- Koposov, S. E., Belokurov, V., Evans, N. W., et al. 2012, ApJ, 750, 80 [NASA ADS] [CrossRef] [Google Scholar]
- Kundu, R., Fernández-Trincado, J. G., Minniti, D., et al. 2019a, MNRAS, 489, 4565 [Google Scholar]
- Kundu, R., Minniti, D., & Singh, H. P. 2019b, MNRAS, 483, 1737 [Google Scholar]
- Kundu, R., Navarrete, C., Fernández-Trincado, J. G., et al. 2021, A&A, 645, A116 [EDP Sciences] [Google Scholar]
- Küpper, A. H. W., Kroupa, P., Baumgardt, H., & Heggie, D. C. 2010, MNRAS, 407, 2241 [NASA ADS] [CrossRef] [Google Scholar]
- Kuzma, P. B., Da Costa, G. S., Keller, S. C., & Maunder, E. 2015, MNRAS, 446, 3297 [NASA ADS] [CrossRef] [Google Scholar]
- Kuzma, P. B., Da Costa, G. S., Mackey, A. D., & Roderick, T. A. 2016, MNRAS, 461, 3639 [Google Scholar]
- Kuzma, P. B., Da Costa, G. S., & Mackey, A. D. 2017, MNRAS, 473, 2881 [Google Scholar]
- Law, D. R., & Majewski, S. R. 2010a, ApJ, 718, 1128 [Google Scholar]
- Law, D. R., & Majewski, S. R. 2010b, ApJ, 714, 229 [Google Scholar]
- Law, D. R., & Majewski, S. R. 2016, in The Sagittarius Dwarf Tidal Stream(s), eds. H. J. Newberg, & J. L. Carlin, Astrophys. Space Sci. Lib., 420, 31 [Google Scholar]
- Leon, S., Meylan, G., & Combes, F. 2000, A&A, 359, 907 [NASA ADS] [Google Scholar]
- Lindegren, L., Hernández, J., Bombrun, A., et al. 2018, A&A, 616, A2 [NASA ADS] [CrossRef] [EDP Sciences] [Google Scholar]
- Mackey, A. D., & Van Den Bergh, S. 2005, MNRAS, 360, 631 [NASA ADS] [CrossRef] [Google Scholar]
- Majewski, S. R., Skrutskie, M. F., Weinberg, M. D., & Ostheimer, J. C. 2003, ApJ, 599, 1082 [NASA ADS] [CrossRef] [Google Scholar]
- Majewski, S. R., Schiavon, R. P., Frinchaboy, P. M., et al. 2017, AJ, 154, 94 [NASA ADS] [CrossRef] [Google Scholar]
- Malhan, K., Ibata, R. A., & Martin, N. F. 2018, MNRAS, 481, 3442 [Google Scholar]
- Malhan, K., Yuan, Z., Ibata, R., et al. 2021, ApJ, 920, 51 [NASA ADS] [CrossRef] [Google Scholar]
- Marigo, P., Girardi, L., Bressan, A., et al. 2017, ApJ, 835, 77 [Google Scholar]
- Martínez-Delgado, D., Aparicio, A., Gómez-Flechoso, M. Á., & Carrera, R. 2001, ApJ, 549, L199 [CrossRef] [Google Scholar]
- Martínez-Delgado, D., Zinn, R., Carrera, R., & Gallart, C. 2002, ApJ, 573, L19 [CrossRef] [Google Scholar]
- Massari, D., Koppelman, H. H., & Helmi, A. 2019, A&A, 630, L4 [NASA ADS] [CrossRef] [EDP Sciences] [Google Scholar]
- Minniti, D., Gómez, M., Alonso-García, J., Saito, R. K., & Garro, E. R. 2021a, A&A, 650, L12 [NASA ADS] [CrossRef] [EDP Sciences] [Google Scholar]
- Minniti, D., Ripepi, V., Fernández-Trincado, J. G., et al. 2021b, A&A, 647, L4 [NASA ADS] [CrossRef] [EDP Sciences] [Google Scholar]
- Monaco, L., Bellazzini, M., Ferraro, F. R., & Pancino, E. 2005, MNRAS, 356, 1396 [CrossRef] [Google Scholar]
- Mottini, M., Wallerstein, G., & McWilliam, A. 2008, AJ, 136, 614 [NASA ADS] [CrossRef] [Google Scholar]
- Musella, I., Di Criscienzo, M., Marconi, M., et al. 2018, MNRAS, 473, 3062 [CrossRef] [Google Scholar]
- Navarrete, C., Belokurov, V., Koposov, S. E., et al. 2017, MNRAS, 467, 1329 [NASA ADS] [Google Scholar]
- Newberg, H. J., Yanny, B., Rockosi, C., et al. 2002, ApJ, 569, 245 [Google Scholar]
- Palau, C. G., & Miralda-Escudé, J. 2019, MNRAS, 488, 1535 [Google Scholar]
- Pancino, E., Bellazzini, M., Giuffrida, G., & Marinoni, S. 2017, MNRAS, 467, 412 [NASA ADS] [Google Scholar]
- Pedregosa, F., Varoquaux, G., Gramfort, A., et al. 2011, J. Mach. Learn. Res., 12, 2825 [Google Scholar]
- Piatti, A. E. 2021, AJ, 162, 261 [NASA ADS] [CrossRef] [Google Scholar]
- Price-Whelan, A. M. 2017, J. Open Source Softw., 2, 388 [NASA ADS] [CrossRef] [Google Scholar]
- Puzia, T. H., Kissler-Patig, M., Thomas, D., et al. 2005, A&A, 439, 997 [NASA ADS] [CrossRef] [EDP Sciences] [Google Scholar]
- Riello, M., De Angeli, F., Evans, D. W., et al. 2021, A&A, 649, A3 [NASA ADS] [CrossRef] [EDP Sciences] [Google Scholar]
- Ripepi, V., Clementini, G., Di Criscienzo, M., et al. 2007, ApJ, 667, L61 [NASA ADS] [CrossRef] [Google Scholar]
- Rodriguez-Gomez, V., Pillepich, A., Sales, L. V., et al. 2016, MNRAS, 458, 2371 [Google Scholar]
- Salinas, R., Jílková, L., Carraro, G., Catelan, M., & Amigo, P. 2012, MNRAS, 421, 960 [Google Scholar]
- Sariya, D. P., & Yadav, R. K. S. 2015, A&A, 584, A59 [NASA ADS] [CrossRef] [EDP Sciences] [Google Scholar]
- Sbordone, L., Marconi, G., Bonifacio, P., & Buonanno, R. 2003, IAU Joint Discuss., 25, E36 [Google Scholar]
- Sbordone, L., Bonifacio, P., Marconi, G., Buonanno, R., & Zaggia, S. 2005, A&A, 437, 905 [NASA ADS] [CrossRef] [EDP Sciences] [Google Scholar]
- Sbordone, L., Monaco, L., Moni Bidin, C., et al. 2015, A&A, 579, A104 [NASA ADS] [CrossRef] [EDP Sciences] [Google Scholar]
- Sbordone, L., Bonifacio, P., Buonanno, R., et al. 2007a, A&A, 465, 815 [NASA ADS] [CrossRef] [EDP Sciences] [Google Scholar]
- Sbordone, L., Bonifacio, P., Giuffrida, G., et al. 2007b, in Galaxy Evolution across the Hubble Time, eds. F. Combes,&J. Palouš, 235, 330 [NASA ADS] [Google Scholar]
- Schlafly, E. F., & Finkbeiner, D. P. 2011, ApJ, 737, 103 [Google Scholar]
- Schwarz, G. 1978, Ann. Stat., 6, 461 [Google Scholar]
- Sharina, M. E., Shimansky, V. V., & Davoust, E. 2013, Astron. Rep., 57, 410 [NASA ADS] [CrossRef] [Google Scholar]
- Siegel, M. H., Dotter, A., Majewski, S. R., et al. 2007, ApJ, 667, L57 [NASA ADS] [CrossRef] [Google Scholar]
- Sohn, S. T., Watkins, L. L., Fardal, M. A., et al. 2018, ApJ, 862, 52 [NASA ADS] [CrossRef] [Google Scholar]
- Tang, B., Fernández-Trincado, J. G., Geisler, D., et al. 2018, ApJ, 855, 38 [Google Scholar]
- Valcarce, A. A. R., Catelan, M., & Sweigart, A. V. 2012, A&A, 547, A5 [NASA ADS] [CrossRef] [EDP Sciences] [Google Scholar]
- Vasiliev, E., & Baumgardt, H. 2021, MNRAS, 505, 5978 [NASA ADS] [CrossRef] [Google Scholar]
- Villanova, S., Monaco, L., Moni Bidin, C., & Assmann, P. 2016, MNRAS, 460, 2351 [Google Scholar]
- Virtanen, P., Gommers, R., Oliphant, T. E., et al. 2020, Nat. Method, 17, 261 [NASA ADS] [CrossRef] [Google Scholar]
- Yuan, Z., Chang, J., Beers, T. C., & Huang, Y. 2020, ApJ, 898, L37 [Google Scholar]
Appendix A: Proper motion estimates
In this Appendix, we compare the results obtained in Section 2.1 with those reported in Vasiliev & Baumgardt (2021, hereinafter VB21). Table A.1 contains the mean PMs, observed dispersions, and intrinsic dispersions. To estimate the errors, the Gaussian Mixture Model fit was run 5000 times, randomly sampling 90% of the original sample of stars for each cluster, adopting as errors for each value the standard deviation of its distribution.
Mean PMs, dispersions and intrinsic PM dispersions for the clusters studied in this work.
Figure A.1 shows the comparison between the mean PMs derived in this work and the values reported in VB21. There is a very good agreement between the values used in this work and the ones reported in the literature. The clusters with the largest discrepancies are Terzan 7, Arp 2, and NGC 2419. This can be explained due to the relatively low number of cluster stars (∼100) in the case of Terzan 7 and the elongated PM distributions of Arp 2 and NGC 2419.
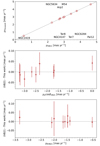 |
Fig. A.1. Comparison between the PMs derived in this work and those reported in VB21. Top panel: Total PM from VB21 and this work. The dashed line represents the 1:1 line. The middle and bottom panels show the difference between VB21 and this work for μα, 0 and μδ, respectively. |
In fact, Table A.2 shows the mean PM and its dispersions for the field populations fitted along the PM distribution of the cluster members. For most of the clusters, the dispersion of this broad component is more than 1 mas yr−1 in the μδ axis. It is worth mentioning that these values can change considerably depending on the stars used to do the fitting. In this work, only stars inside one rt, brighter than G = 19 mag, and having absolute PM values lower than 10 mas yr−1 in each direction were used. Being inside one rt of each cluster centre means that the field population is less significant in number and, due to this, the fitted parameters are not as well constrained as the parameters for the cluster population. This is the case for NGC 5634, in which the field population has almost the same mean PMs as the clusters, but a larger dispersion. This is due to the very low number of field stars inside one rt (see Figure 1).
Mean PM and dispersions for the field populations around each cluster, up to one rt.
The dispersions reported in columns 4 and 5 in Table A.1 are the observed dispersions in the PM distribution of the clusters. The intrinsic dispersion of the PMs of the clusters (column six) was obtained subtracting, in quadrature, the mean observational errors in each component. Figure A.2 shows the PM dispersion at the 50th percentile, using as error bars the values at 5% and 95%, based on the PM dispersion profiles published by VB21 (for the four clusters included in this work that are also part of the former study, namely M 54, NGC 5634, NGC 4147, and NGC 6284) compared to the values found in this work. There is a relatively good agreement, although the values derived in this work tend to be slightly larger than the ones reported by VB21. Given the extensive modelling performed in the aforementioned study, the most likely explanation is that the dispersion values found in the fitting done in this work are overestimated. Therefore, the values for the intrinsic dispersion presented in Table 1 should be considered as a rough estimate for those clusters without PM dispersion profiles in the work of VB21.
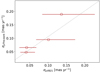 |
Fig. A.2. Comparison between the internal PM dispersion σμ at the centre of the cluster, as reported in VB21, and the intrinsic PM dispersion obtained in this work, as explained in the text. |
All the results presented above will need to be updated once the Gaia data release 3 data is available.
Appendix B: Comparison fields for the inner-region clusters
In order to illustrate the accuracy of the estimates from our contamination analysis, we take the two template cases of the GCs Arp 2 and Terzan 7, which have different ages and metallicities that nicely bracket the whole range exhibited in the Sgr Age-Metallicity Relation. In this Appendix, we show the CMDs of two control fields (upper panels of Figure B.1, Figure B.2, and Figure B.3) located on both sides of the clusters (the specific location of these control fields do not alter the results). We also show the corresponding PM vector point diagrams (lower panels of Figure B.1, Figure B.2, and Figure B.3) for these fields. Evidently, there is more background in Arp 2 than in Terzan 7, mostly because Arp 2 is a larger cluster, but the contamination by field stars (bulge and Sgr) along these lines of sight is not a major problem. Table B.1 lists the number of contaminants found around each control region, along with the scaled number of contaminants in that region.
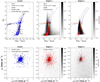 |
Fig. B.1. Upper left panel shows the CMD of the cluster (black dots) overplotted with the extra-tidal stars (blue dots). Arp 2 isochrone and ZAHB (orange and yellow lines) are also shown with the limits (blue dotted lines) used to select the stars. The middle and right panels show the scaled density of field stars along with the contaminants (red dots). The lower panels show the vector point diagram of the cluster and the two fields. |
Number of contaminants selected in the control regions.
All Tables
Mean PMs, dispersions and intrinsic PM dispersions for the clusters studied in this work.
Mean PM and dispersions for the field populations around each cluster, up to one rt.
All Figures
|
Fig. 1. Centre of the PM distribution ±3σ (red lines) for each cluster, determined as the centre and dispersion of the Gaussian fit of the cluster stars inside one rt (grey dots). For Arp 2, Terzan 7, NGC 6284 and Pal 12, one third of the nominal rt was used (see the text for further details). |
| In the text | |
|
Fig. 2. Gaia EDR3 de-reddened CMDs of the clusters (grey dots) along with the selected extra-tidal candidates (red dots) and PARSEC isochrones (solid lines). The orange and pink lines represent the isochrones for each cluster based on parameters from the literature (see the text for further details). The yellow line corresponds to the ZAHB ridgeline at the distance of each cluster. The dashed blue lines define the selection cuts applied in order to select the extra-tidal candidates around the clusters. |
| In the text | |
|
Fig. 3. Density map of the selected extra-tidal cluster candidates (black dots), along with the PMs (red), rt (grey), 5rt, and rJ (light blue). The directions of the Galactic centre (pink) and to the core of Sgr dSph (blue) are also shown. Contour lines represent the iso-density regions with a constant number of stars per square degree. |
| In the text | |
|
Fig. 4. Density map (stars per square degree) of Sgr dSph particles based on the LM10 model, along with the clusters (black) and the number of contaminants found around each cluster, and the scaled number of stars in each sample region (red), along with the corresponding number of extra-tidal candidates (black number and white dots). |
| In the text | |
|
Fig. 5. Position of extra-tidal stars with compatible RVs on the respective Gaia EDR3 cluster CMDs. |
| In the text | |
|
Fig. 6. Measured RVs of the stars with respect to their distances from cluster centres over the rt of each cluster. Red dots are the stars having RV measurements in the literature. The grey line is used for the mean RVs of the clusters, while the black lines represent the RV dispersion. Red lines in the M 54 panel are the limits on the RVs adopted by Bellazzini et al. (2008). The closest star to NGC 4147 has a larger RV error of ∼80 km s−1, extending beyond the limits of the plot. |
| In the text | |
|
Fig. A.1. Comparison between the PMs derived in this work and those reported in VB21. Top panel: Total PM from VB21 and this work. The dashed line represents the 1:1 line. The middle and bottom panels show the difference between VB21 and this work for μα, 0 and μδ, respectively. |
| In the text | |
|
Fig. A.2. Comparison between the internal PM dispersion σμ at the centre of the cluster, as reported in VB21, and the intrinsic PM dispersion obtained in this work, as explained in the text. |
| In the text | |
|
Fig. B.1. Upper left panel shows the CMD of the cluster (black dots) overplotted with the extra-tidal stars (blue dots). Arp 2 isochrone and ZAHB (orange and yellow lines) are also shown with the limits (blue dotted lines) used to select the stars. The middle and right panels show the scaled density of field stars along with the contaminants (red dots). The lower panels show the vector point diagram of the cluster and the two fields. |
| In the text | |
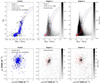 |
Fig. B.2. Same as fig B.1 but for Terzan 7. |
| In the text | |
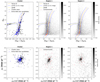 |
Fig. B.3. Same as fig B.1 but for Terzan 8. |
| In the text | |
Current usage metrics show cumulative count of Article Views (full-text article views including HTML views, PDF and ePub downloads, according to the available data) and Abstracts Views on Vision4Press platform.
Data correspond to usage on the plateform after 2015. The current usage metrics is available 48-96 hours after online publication and is updated daily on week days.
Initial download of the metrics may take a while.