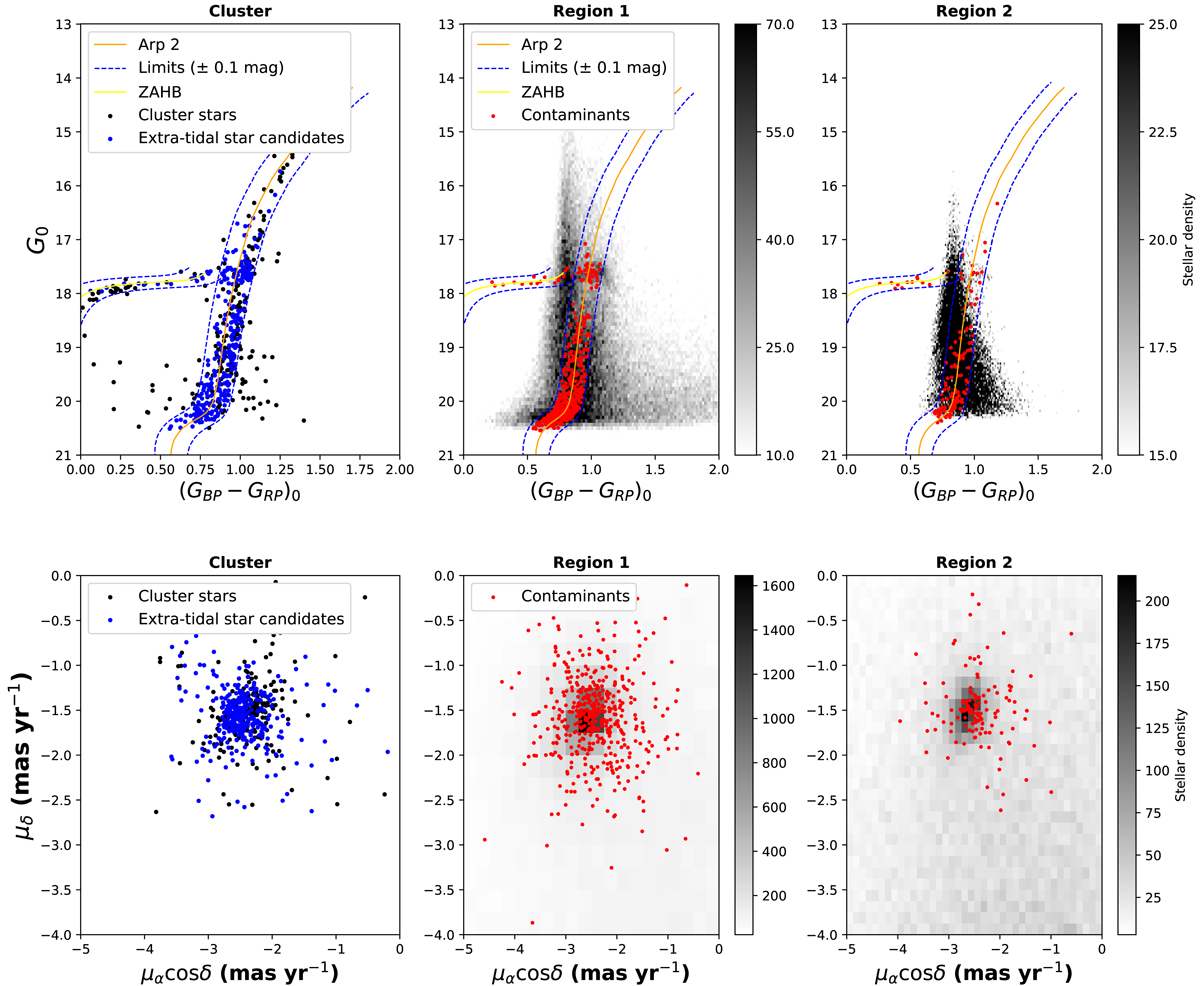
Fig. B.1.
Download original image
Upper left panel shows the CMD of the cluster (black dots) overplotted with the extra-tidal stars (blue dots). Arp 2 isochrone and ZAHB (orange and yellow lines) are also shown with the limits (blue dotted lines) used to select the stars. The middle and right panels show the scaled density of field stars along with the contaminants (red dots). The lower panels show the vector point diagram of the cluster and the two fields.
Current usage metrics show cumulative count of Article Views (full-text article views including HTML views, PDF and ePub downloads, according to the available data) and Abstracts Views on Vision4Press platform.
Data correspond to usage on the plateform after 2015. The current usage metrics is available 48-96 hours after online publication and is updated daily on week days.
Initial download of the metrics may take a while.