Open Access
Fig. 1.
Download original image
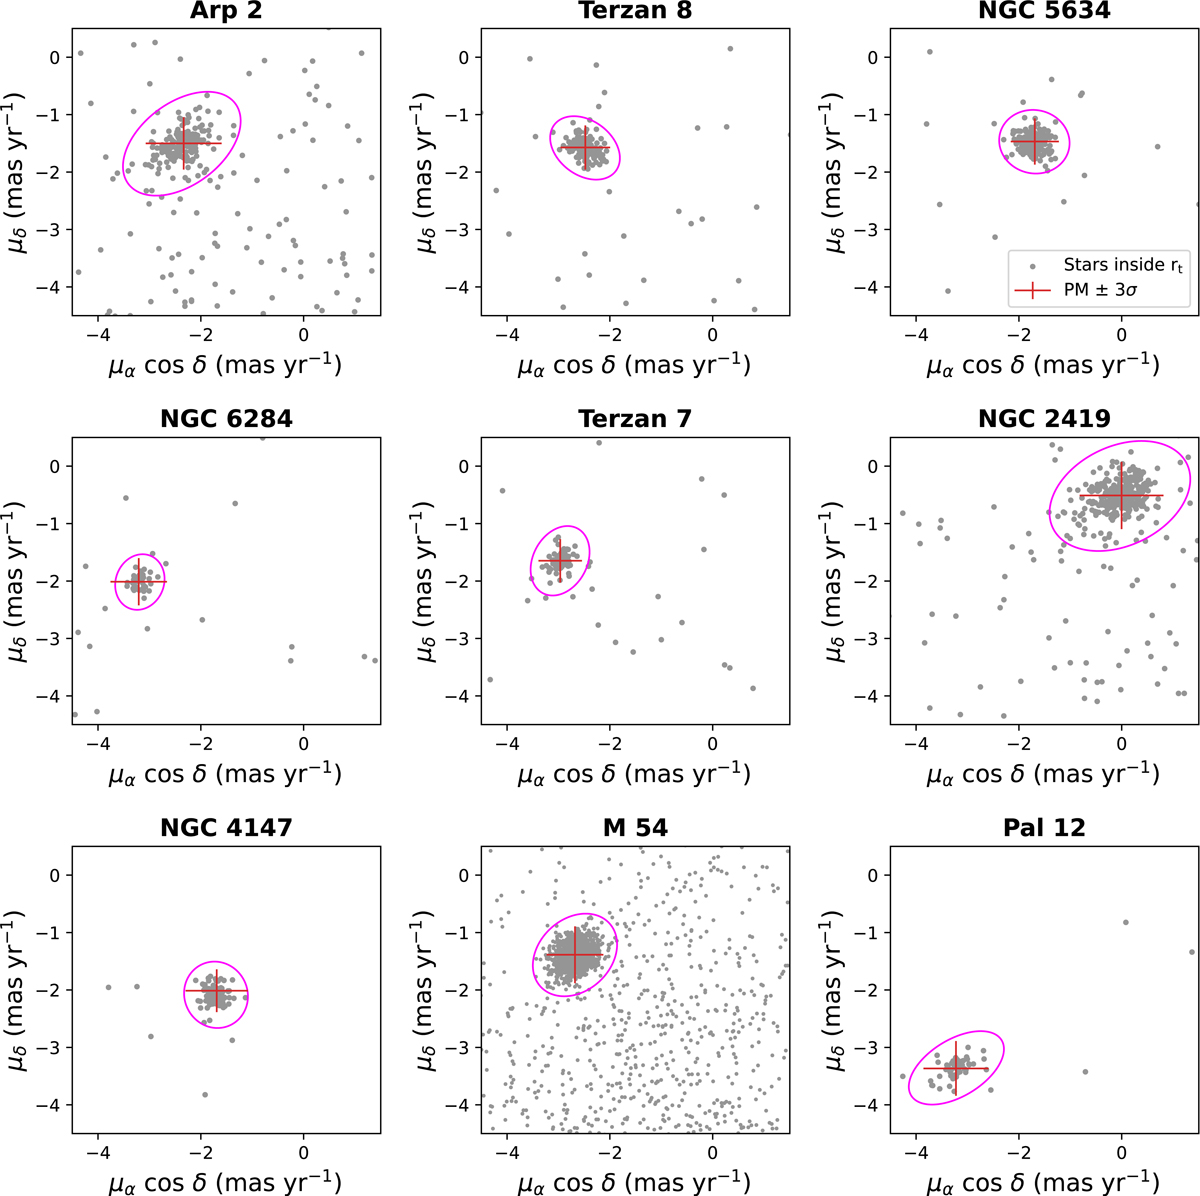
Centre of the PM distribution ±3σ (red lines) for each cluster, determined as the centre and dispersion of the Gaussian fit of the cluster stars inside one rt (grey dots). For Arp 2, Terzan 7, NGC 6284 and Pal 12, one third of the nominal rt was used (see the text for further details).
Current usage metrics show cumulative count of Article Views (full-text article views including HTML views, PDF and ePub downloads, according to the available data) and Abstracts Views on Vision4Press platform.
Data correspond to usage on the plateform after 2015. The current usage metrics is available 48-96 hours after online publication and is updated daily on week days.
Initial download of the metrics may take a while.