Fig. 4.
Download original image
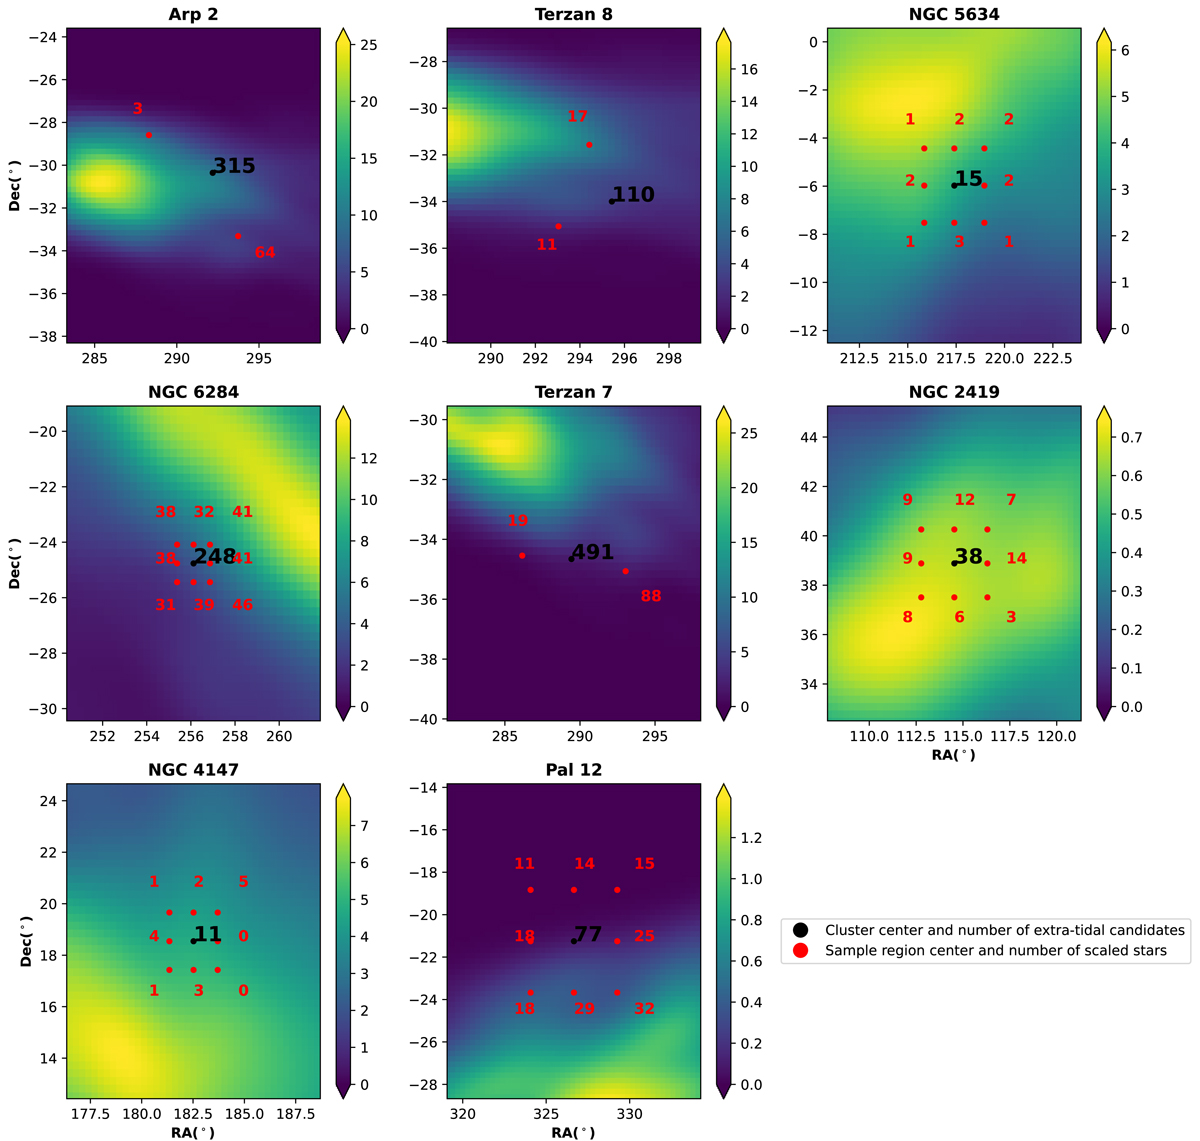
Density map (stars per square degree) of Sgr dSph particles based on the LM10 model, along with the clusters (black) and the number of contaminants found around each cluster, and the scaled number of stars in each sample region (red), along with the corresponding number of extra-tidal candidates (black number and white dots).
Current usage metrics show cumulative count of Article Views (full-text article views including HTML views, PDF and ePub downloads, according to the available data) and Abstracts Views on Vision4Press platform.
Data correspond to usage on the plateform after 2015. The current usage metrics is available 48-96 hours after online publication and is updated daily on week days.
Initial download of the metrics may take a while.