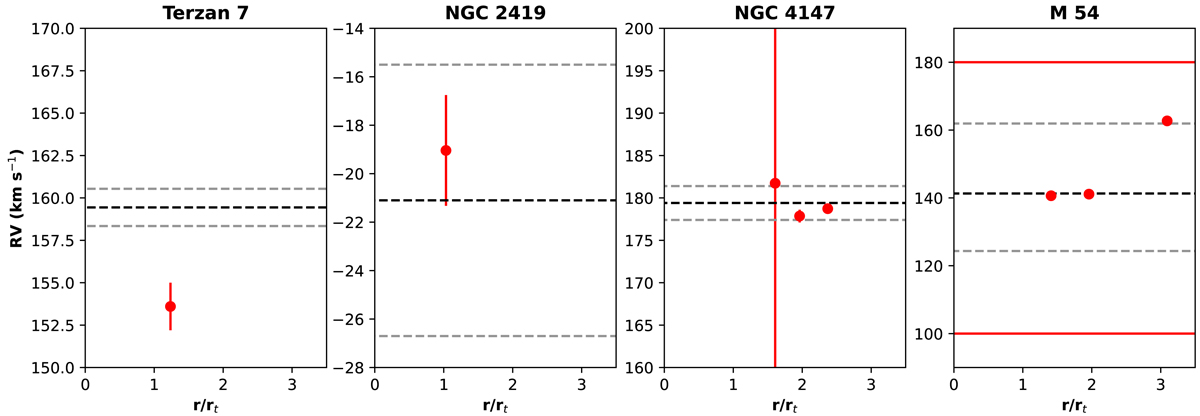
Fig. 6.
Download original image
Measured RVs of the stars with respect to their distances from cluster centres over the rt of each cluster. Red dots are the stars having RV measurements in the literature. The grey line is used for the mean RVs of the clusters, while the black lines represent the RV dispersion. Red lines in the M 54 panel are the limits on the RVs adopted by Bellazzini et al. (2008). The closest star to NGC 4147 has a larger RV error of ∼80 km s−1, extending beyond the limits of the plot.
Current usage metrics show cumulative count of Article Views (full-text article views including HTML views, PDF and ePub downloads, according to the available data) and Abstracts Views on Vision4Press platform.
Data correspond to usage on the plateform after 2015. The current usage metrics is available 48-96 hours after online publication and is updated daily on week days.
Initial download of the metrics may take a while.