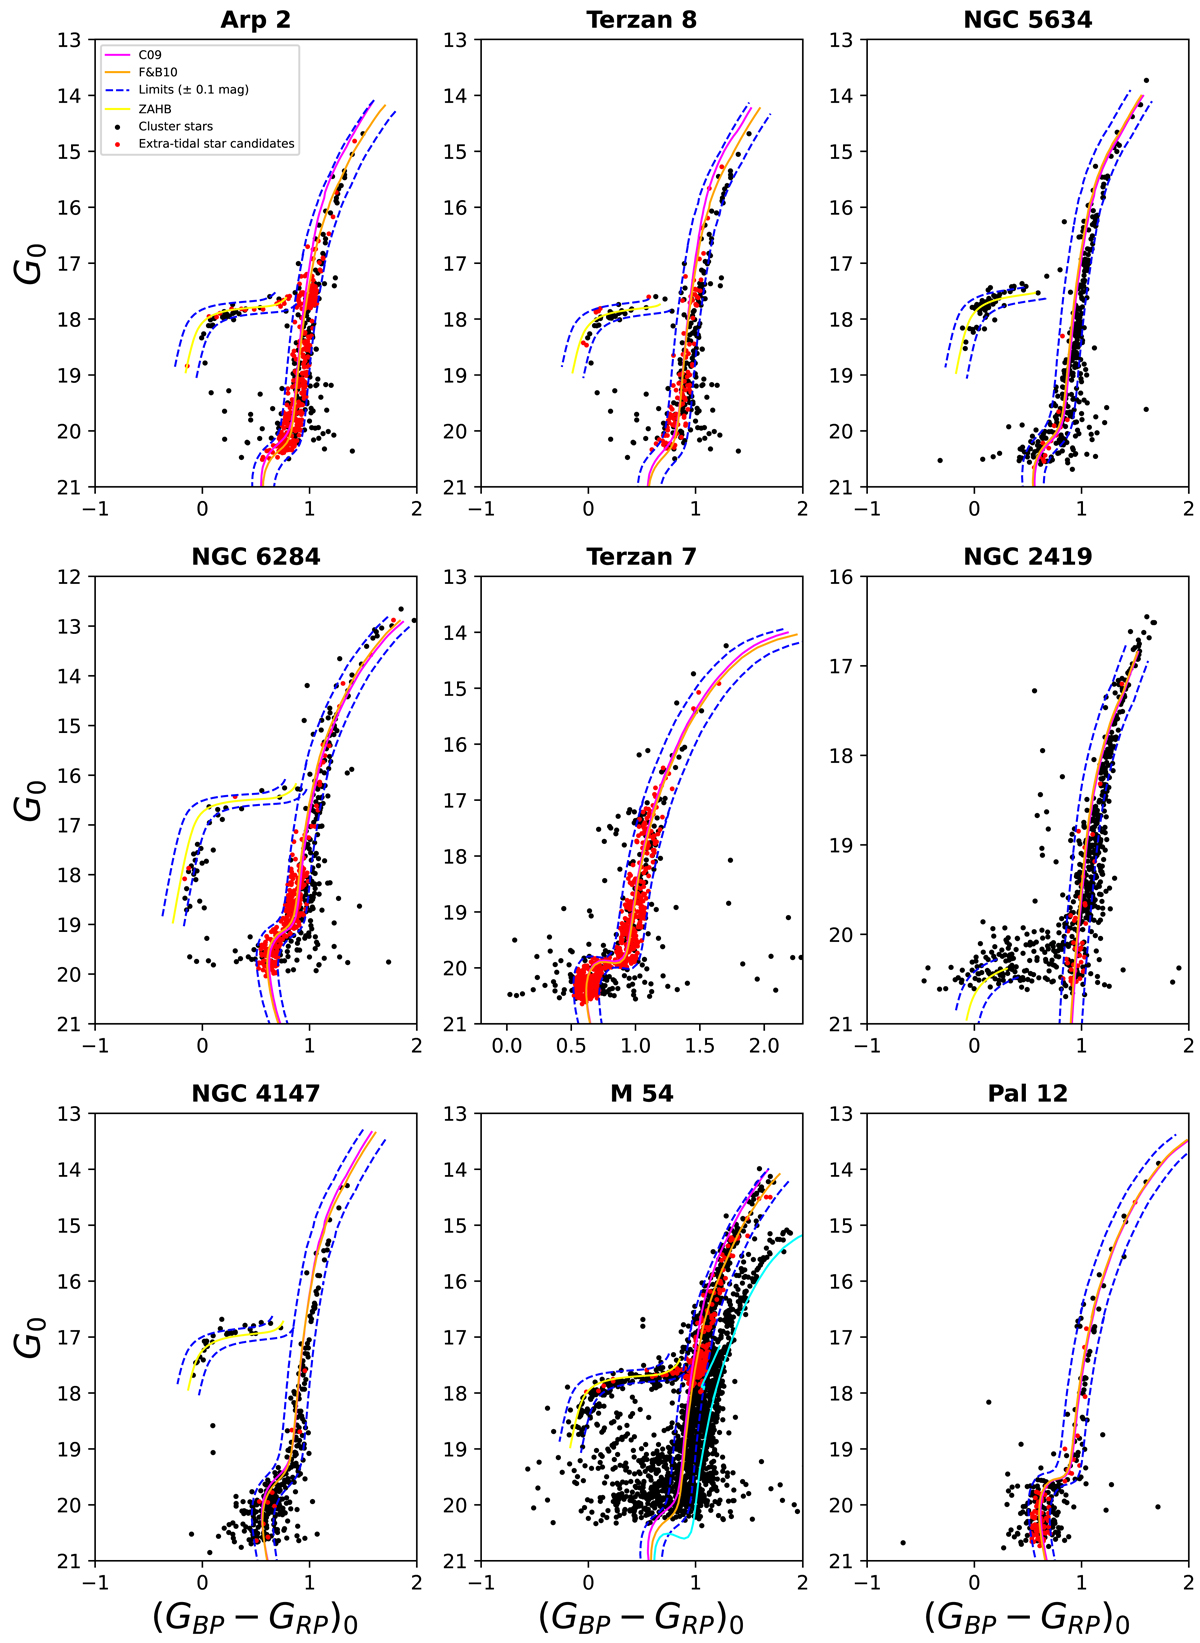
Fig. 2.
Download original image
Gaia EDR3 de-reddened CMDs of the clusters (grey dots) along with the selected extra-tidal candidates (red dots) and PARSEC isochrones (solid lines). The orange and pink lines represent the isochrones for each cluster based on parameters from the literature (see the text for further details). The yellow line corresponds to the ZAHB ridgeline at the distance of each cluster. The dashed blue lines define the selection cuts applied in order to select the extra-tidal candidates around the clusters.
Current usage metrics show cumulative count of Article Views (full-text article views including HTML views, PDF and ePub downloads, according to the available data) and Abstracts Views on Vision4Press platform.
Data correspond to usage on the plateform after 2015. The current usage metrics is available 48-96 hours after online publication and is updated daily on week days.
Initial download of the metrics may take a while.