| Issue |
A&A
Volume 648, April 2021
|
|
|---|---|---|
| Article Number | A110 | |
| Number of page(s) | 20 | |
| Section | Planets and planetary systems | |
| DOI | https://doi.org/10.1051/0004-6361/202040166 | |
| Published online | 21 April 2021 | |
HD 142527: quantitative disk polarimetry with SPHERE★
1
ETH Zurich, Institute for Astronomy,
Wolfgang-Pauli-Strasse 27,
8093
Zurich,
Switzerland
e-mail: This email address is being protected from spambots. You need JavaScript enabled to view it.
2
LESIA, CNRS, Observatoire de Paris, Université Paris Diderot, UPMC,
5 place J. Janssen,
92190
Meudon,
France
3
Aix Marseille Université, CNRS, LAM (Laboratoire d’Astrophysique de Marseille) UMR 7326,
13388
Marseille,
France
4
Université Grenoble Alpes, IPAG,
38000
Grenoble,
France
5
Anton Pannekoek Astronomical Institute, University of Amsterdam,
PO Box 94249,
1090 GE
Amsterdam,
The Netherlands
6
INAF – Osservatorio Astronomico di Padova,
Vicolo dell’Osservatorio 5,
35122
Padova,
Italy
7
Max-Planck-Institut für Astronomie,
Königstuhl 17,
69117
Heidelberg,
Germany
8
Centre de Recherche Astrophysique de Lyon, CNRS/ENSL Université Lyon 1,
9 Ave. Ch. André,
69561
Saint-Genis-Laval,
France
9
CNRS, IPAG,
38000
Grenoble,
France
10
Leiden Observatory, Leiden University,
PO Box 9513,
2300 RA
Leiden,
The Netherlands
Received:
18
December
2020
Accepted:
2
March
2021
Abstract
Aims. We present high-precision photometry and polarimetry based on visual and near-infrared imaging data for the protoplanetary disk surrounding the Herbig Ae/Be star HD 142527, with a strong focus on determining the light scattering parameters of the dust located at the surface of the large outer disk.
Methods. We re-reduced existing polarimetric differential imaging data of HD 142527 in the VBB (735 nm) and H-band (1625 nm) from the ZIMPOL and IRDIS subinstruments of SPHERE at the VLT. With polarimetry and photometry based on reference star differential imaging (RDI), we were able to measure the linearly polarized intensity and the total intensity of the light scattered by the circumstellar disk with high precision. We used simple Monte Carlo simulations of multiple light scattering by the disk surface to derive constraints for three scattering parameters of the dust: the maximum polarization of the scattered light Pmax, the asymmetry parameter g, and the single-scattering albedo ω.
Results. We measure a reflected total intensity of 51.4 ± 1.5 mJy and 206 ± 12 mJy and a polarized intensity of 11.3 ± 0.3 mJy and 55.1 ± 3.3 mJy in the VBB and H-band, respectively. We also find in the visual range a degree of polarization that varies between 28% on the far side of the disk and 17% on the near side. In the H-band, the degree of polarization is consistently higher by about a factor of 1.2. The disk also shows a red color for the scattered light intensity and the polarized intensity, which are about twice as high in the near-infrared when compared to the visual. We determine with model calculations the scattering properties of the dust particles and find evidence for strong forward scattering (g ≈ 0.5–0.75), relatively low single-scattering albedo (ω ≈ 0.2–0.5), and high maximum polarization (Pmax ≈ 0.5–0.75) at the surface on the far side of the disk for both observed wavelengths. The optical parameters indicate the presence of large aggregate dust particles, which are necessary to explain the high maximum polarization, the strong forward-scattering nature of the dust, and the observed red disk color.
Key words: stars: individual: HD 142527 / instrumentation: high angular resolution / techniques: polarimetric / protoplanetary disks / polarization / scattering
The reduced Qϕ images given in Fig. 2 and the corresponding Uϕ images in VBB and H-band are only available at the CDS via anonymous ftp to cdsarc.u-strasbg.fr (130.79.128.5) or via http://cdsarc.u-strasbg.fr/viz-bin/cat/J/A+A/648/A110
© ESO 2021
1 Introduction
The existence of circumstellar disks was first deduced from infrared (IR) emission components in unresolved observations of the spectral energy distribution (SED) of young stars. Circumstellar disks reflect some of the stellar light at visual and near-IR wavelengths, and some of the light is absorbed by the disk and re-emitted as excess in the mid- and far-IR. The disk SED contains important information about the disk structure and the dust properties, and IR emission bands can be used to determine the composition of the dust. The clear detection of reflected light from protoplanetary disks was initially achieved with the Hubble Space Telescope (HST) and with adaptive optics (AO) assisted, ground-based telescopes (Roddier et al. 1995; Silber et al. 2000). More recently, the development of dedicated instruments with polarimetric differential imaging (PDI) capabilities such as the Spectro-Polarimetric High-contrast Exoplanet REsearch instrument (SPHERE; Beuzit et al. 2019)at the Very Large Telescope (VLT), the Gemini Planet Imager (GPI; Perrin et al. 2015) at the Gemini South Telescope and the High-Contrast Coronographic Imager for Adaptive Optics (HiCIAO; Hodapp et al. 2008)at the Subaru Telescope have opened up the possibility to perform observations of reflected light from circumstellar disks with unprecedented sensitivity. PDI has proven to be an effective and reliable method to remove unpolarized stellar light and reveal the polarized reflected light of disks. These observations have led to the detection of many protoplanetary disks in scattered light and revealed disks with a surprisingly large variety of different masses, sizes, and morphologies (e.g., Takami et al. 2014; Garufi et al. 2017; Monnier et al. 2017; Avenhaus et al. 2018).
Protoplanetary disks are considered to be the places where planet formation occurs around young pre-main-sequence stars. The disks initially consist of a mixture of gas and submicron-sized dust particles. Dust coagulation over time leads to the growth of dust particles sizes and eventually to the formation of planetesimals and planets. The analysis of the dust constituents and dust evolution mechanisms in young stellar environments is therefore vital for our understanding of planet formation. One way of constrainingthe dust properties is through the optical properties of the reflected light. A few studies in the past have used direct imaging of circumstellar disks to determine optical properties such as the scattering asymmetry parameter g, the maximum polarization of the reflectedlight Pmax, the single-scattering albedo ω, and the (polarized) scattering phase function (e.g., Duchêne et al. 2004; Pinte et al. 2008; Mulders et al. 2013). These studies haveshown, for example, that the wavelength dependence of the scattered light intensity for disks can significantly deviate from measurements performed on the smaller sized dust found in the interstellar medium or molecular dust clouds (e.g., Duchêne et al. 2004), which is an indication for dust growth. The measurements in circumstellar disks also revealed degrees of linear polarization that are not compatible with scattering on simple spherical and compact dust grains (e.g., Pinte et al. 2008).
Transition disks are well suited for scattered-light observations because they usually feature a dust-depleted inner cavity between the star and the inner disk wall. This results in a bright illuminated inner disk wall at a large enough distance from the star so that it can be observed in nearby star-forming regions. HD 142527 has a very large inner cavity, most likely because the central star has a companion. Therefore it is not a typical transition disk (Price et al. 2018), but its brightness and size make it exceptionally well suited for scattered-light observations.
In this paper, we focus on the quantitative analysis of high spatial resolution visual and near-IR observation of the HD 142527 protoplanetary disk to determine the dust optical properties. The data were taken with the PDI modes of the Zurich IMaging POLarimeter (ZIMPOL; Schmid et al. 2018) and the InfraRed Dual-band Imager and Spectrograph (IRDIS; Dohlen et al. 2008; van Holstein et al. 2020; de Boer et al. 2020), which are subsystems of SPHERE. This allows the simultaneous measurement of the total intensity and linearly polarized intensity of the scattered light and therefore also determine the degree of polarization for different parts of the HD 142527 disk with high precision. For simplicity, we refer from here on to linear polarization just as polarization. The scattered intensities from the near and far side of the disk constrain the asymmetry parameter g of the scattering phase function, the degree of polarization, and the single-scattering albedo ω, while 90° scattering constrains the maximum polarization pmax.
We provide accurate photopolarimetry of the reflected light as a function of the azimuthal angle and radial distance for the large outer disk around HD 142527 and set limits on scattering parameters that can be compared to measurements from other disks, to model simulations, or laboratory studies of dust light-scattering properties. The outer disk is hereafter called the disk, and whenever the inner disk or the hot dust are discussed, we specify this accordingly. In Sect. 2, we review properties and previous observations of HD 142527 relevant for this work. In Sect. 3, we describe the observations and data reduction, and in Sect. 4 we describe the data analysis procedures used to measure the scattered intensity, the polarized intensity, and the degree of polarization of the reflected light on different parts of the disk. In Sect. 5, we present the main results of our measurements, which are discussed in Sect. 6, and Sect. 7 contains our concluding remarks.
2 Dust properties in HD 142527
HD 142527 is a binary system that consists of a massive F-type Herbig Ae/Be star with an M-dwarf companion (Biller et al. 2012) on a close-in (< 0.1′′) and possibly highly eccentric orbit (Claudi et al. 2019). The system has been studied intensively in the past due to its extendeddisk at a distance of only 156 pc (Gaia Collaboration 2018) and its unusually high IR excess of FIR ∕F* = 0.92 (Dominik et al. 2003). The inner rim of the large circumbinary disk is slightly eccentric (ϵ ≈ 0.137), with a semimajor axis of about 140 AU (Avenhaus et al. 2014), and the disk is optically thick in the visual and the near- and mid-IR. Fukagawa et al. (2006) have detected reflected light from the disk at separations up to around 550 AU in H-band observations. The structure of the disk is still investigated because the system is complex and the outer disk is partially shadowed by a compact hot disk near the star (Marino et al. 2015). Verhoeff et al. (2011) have found that the high IR excess of the system can be explained by invoking the presence of a relatively high and steep inner wall for the disk at 130 AU, but no clear consensus exists on the scale height of the disk and its inclination toward the observer because different methods find slightly different solutions. Radial velocity measurements of molecular lines with ALMA found a disk inclination of about 28° with a position angle of −20° (Fukagawa et al. 2013; Perez et al. 2015), but the results depend on the poorly constrained stellar mass of HD 142527, which was estimated to be around 2 M⊙. Lower inclinations around 20°−24° were found by fitting IR imaging data (Verhoeff et al. 2011; Avenhaus et al. 2014), but these results depend on assumptions about the light-scattering model and can be strongly correlated with the scale height of the disk (Avenhaus et al. 2014). The values for the scale height of the inner disk wall were also derived by fitting scattered-light images and the IR SED, and the results vary between 17 and 30 AU (Verhoeff et al. 2011; Avenhaus et al. 2014; Min et al. 2016a). Accurate geometric parameters for the disk are important for interpreting the scattered intensity and degree of polarization because these signals strongly depend on the scattering angle.
The H − K color of the disk was determined to be gray (Fukagawa et al. 2006), and Honda et al. (2009) revealed a strong water-ice absorption feature at 3.1 μm. The presence of water ice in this system was previously detected by a mineralogical analysis of the HD 142527 spectrum presented in Malfait et al. (1999). Water ice is important from the planet formation perspective because ice-coated dust grains are expected to stick together more easily and form larger grains more efficiently.
Because of the large size and brightness of the disk around HD 142527, the emission from the dust has been imaged extensively at wavelengths ranging from around0.6 μm (Avenhaus et al. 2017) up to 24 μm (Fujiwara et al. 2006) and at submillimeter (submm) and radio wavelengths up to 1.2 mm (Perez et al. 2015). The gas distribution and dynamics have been studied with submm observations of emission lines (e.g., Casassus et al. 2013, 2015; Fukagawa et al. 2013; Rosenfeld et al. 2014; Perez et al. 2015). In observations of the scattered-light intensity in the near-IR, the near side of the disk is brighter than the far side (e.g., Fukagawa et al. 2006; Avenhaus et al. 2014) because the dust scatters light predominantly in forward direction. For mid-IR observations at λ > 10 μm, the far side of the disk is brighter than the near side because these observations image the thermal emission from the strongly illuminated inner wall of disk, which is exposed on the far side but hidden from view on the near side.
Canovas et al. (2013) and Avenhaus et al. (2014) both used H- and K-band polarimetry of HD 142527 to determine the degree of polarization of the light scattered from the disk and found that the far side produces significantly more linear polarization than the near side. Min et al. (2016a) used their detailed model of the disk to produce a synthetic scattered-light image, which also reproduces the asymmetry in degree of polarization. However, the values for the degree of polarization from all studies are in poor agreement. With similar observations in H- and K-band, Canovas et al. (2013) measured 15–20%, while Avenhaus et al. (2014) obtained 40–50%, and Min et al. (2016a) predicted a polarization of 50–60% with their model for the same wavelengths. In this work, we carefully analyze polarimetric imaging data from well-calibrated instruments to deliver improved measurements of reflected-light properties such as the degree of linear polarization in order to solve these disagreements.
Summary of all SPHERE/ZIMPOL and IRDIS observations that were used in this work.
3 Observations and data reduction
3.1 ZIMPOL observations
The main ZIMPOL data we used to measure the disk signal in this work were obtained on 2015 May 2 as part of the SPHERE GTO program and were first published in Avenhaus et al. (2017). The observations were obtained in P2 polarimetry mode (field-stabilized) with four different derotator offset positions to reduce the fixed pattern noise induced by the instrument. The images were taken in the very broadband (VBB) filter that spans over the R and I-band (λc = 735 nm, Δλ = 290 nm) in both channels of ZIMPOL with 3 s detector integration time (DIT), and without the coronagraph. The high throughput of the VBB filter is well suited to detect the faint signal of the reflected light in the visible. The observations were obtained with the detectors in fast-polarimetry mode to reduce the residual speckle noise in the differential polarization at small separations because the original goal of the observations was the detection of the inner disk. The data were minimally saturated in the core of the point spread function (PSF) with the 3 s DIT. We used these data to measure the scattered disk intensity and polarized intensity because they provide the highest Strehl ratio of all ZIMPOL datasets listed in Table 1.
A second dataset with ZIMPOL was obtained as part of the GTO program on 2016 March 31 with DIT = 2 s to avoid saturation. The data are also described in Avenhaus et al. (2017). Half of the 2016 observations were obtained in P2 polarimetry (field-stabilized), and the other half in P1 polarimetry (field-rotating) mode, but they were otherwise identical to the observations made in 2015. We used these data to determine the total flux from the system Itotal in the VBB filter because this filter show no detector saturation. The total flux measured in these data is 3 ± 0.5% higher than that of the 2015 data after correcting for the different airmasses during the observations. The small difference could be due to saturation of the star in the 2015 data.
A third dataset of HD 142527 was obtained on 2017 May 31 for an open time proposal. The observations were identical to the first observation in 2015, but they showed the low-wind effect. Slow wind at the VLT can lead to a degradation of the PSF because it splits the single-peak PSF into a PSF with multiple smaller peaks (Sauvage et al. 2015; Cantalloube et al. 2019), which significantly lowers the resolution and therefore the signal-to-noise ratio (S/N) of the disk observations. Schmid et al. (2018) showed an image of the ZIMPOL PSF from this run. We included these data in our analysis for measuring the intrinsic polarization of HD 142527 because the recoating of the M1 and M3 telescope mirrors in April 2017 significantly lowered the instrument polarization for observations with ZIMPOL, which enables more accurate measurements of the intrinsic polarization of a source.
We used a reference star differential imaging (RDI) approach to measure the scattered intensity. Angular differential imaging (ADI) is not possible for these data because the observations were performed in field-stabilized mode. The reference star observations were used to determine the ZIMPOL VBB PSF without the disk, and they were obtained with polarimetric imaging of α Cen B on 2017 June 19. The coronagraphic PSF of these observations can be used as a reference for the non-coronagraphic HD 142527 data because the disk is located at a large separation > 0.6′′, where the shape of the PSF is barely affected by the coronagraph. The reference star dataset does not contain any strong signals other than the stellar PSF. It was observed during similar conditions and exhibits a large diversity of different VBB PSFs. We randomly selected 120 frames distributed over the whole α Cen B observing run to construct our reference star dataset. More detailed information about all ZIMPOL datasets used in this work can be found in Table 1.
The ZIMPOL data were reduced with the sz-software (SPHERE/ZIMPOL) pipeline developed at ETH Zürich specifically for the reduction of ZIMPOL data. The IDL-based software package performs basic data preprocessing, reduction, and calibration steps, which are essentially identical to the ESO Data Reduction and Handling (DRH) software package developed for SPHERE (Pavlov et al. 2008). A detailed technical description of ZIMPOL is presented in Schmid et al. (2018). The basic data reduction steps include bias subtraction, flat fielding, correcting the modulation-demodulation efficiency, and centering of the frames. We used a common estimated mean center for all frames with an accuracy better than 1 pixel (3.6 mas). Perfect individual centering at the level of <1 mas is not required for measurements of the extended signal of the disk. In addition, we measured and corrected the relative beam shift of the two orthogonal polarization states, subtracted the frame transfer smearing, and corrected for the residual telescope polarization and the intrinsic polarization of the star. The last two steps normalize the integrated Stokes parameters of the central object to zero (Q = 0 and U = 0), which is required for HD 142527 because the star exhibits a relatively strong intrinsic or interstellar polarization of ~ 1%. The normalization can affect measurements of the polarized intensity (e.g., Hunziker et al. 2020). This possibility is investigated further in Sect. 3.3.
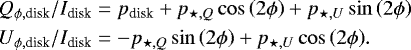
The Stokes Q and U images were then transformed into the azimuthal Qϕ and Uϕ basis according to the radial polarization Qr and Ur defined in Schmid et al. (2006):
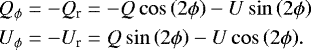 (1)
(1)
For reflected light from a circumstellar disk with low inclination, most of the polarized intensity is contained in Qϕ, while Uϕ should be zero. Multiple scattering of stellar light in the disk, crosstalk between Q and U, and stellar or uncorrected instrumental polarization can lead to a nonzero Uϕ parameter, but for the observations used in this work, the signal in Uϕ was determined to be negligible.
The format of the reduced images is 1024 × 1024 pixels with apixel size of 3.6 × 3.6 mas. We estimated the resolution with the full width at half maximum (FWHM) of the PSF (~ 25 mas) for the datafrom 2015 and the flux calibration data from 2016. As shown in Fig. 1, both VBB datasets have the same resolution, and the radial profiles are not significantly different at any separation because the observing conditions were similar. Fig. 1 also shows the location of the AO control ring for all datasets. The AO control ring refers to an increased speckle intensity located at a distance of 20λ∕D from the center of the stellar PSF, which can interfere with the extraction of faint circumstellar signals. Images of the scattered intensity (Stokes I) and the polarized intensity (Stokes Qϕ) of the disk for the VBB observations are shown in Fig. 2.
3.2 IRDIS observations
The SPHERE/IRDIS observations were obtained on 2017 May 31 in field-stabilized dual-beam polarimetricimaging (DPI) mode using a classical Lyot coronagraph and the broadband H filter (BB_H) with central wavelength λc = 1625.5 nm and bandwidth Δλ = 291 nm. The DITs during the observations were alternated between 8 s and 16 s. For most measurements in this work, we used the combined result with both DITs. The flux calibration observations were made with short DIT = 2 s exposures with the neutral density filter ND_2.0 that diminishes the flux by about a factor of 100.
Because these observations were taken during the same night as the third ZIMPOL epoch, they also show the low-wind effect, which affects the resolution of the data. However, the effect on the H-band dataset is not very disturbing because the limited resolution has no significant effect on the signal extraction of an extended bright circumstellar disk. In addition, the brightness of the disk with respect to the star is much higher in the H-band than in the VBB.
The reference dataset for the shape of the IRDIS H-band PSF without disk is the polarimetric imaging of HR8799 from 2016 October 11. This dataset was published invan Holstein et al. (2017, 2021), and we used it here because it does not contain any strong signals1 other than the stellar PSF and was obtained during similar conditions as the science data. In addition,both datasets are coronagraphic, and the stars have a similar brightness in H-band. The post-processed HR8799 dataset contains a total of 172 different H-band PSFs, whichwe all used as reference frames in our calculations. More detailed information about the IRDIS datasets can be found in Table 1.
The data reduction for the IRDIS data was performed with the end-to-end IRDAP data reduction pipeline (van Holstein et al. 2020). All frames were centered on a common estimated mean center, which was determined with the four satellite spots of the star center frames (Beuzit et al. 2019). In addition to the standard calibration steps and centering of the frames, IRDAP also corrects the polarimetric crosstalk, removes instrument polarization, and measures and removes interstellar polarization and the intrinsic polarization of the star (see discussion in Sect. 3.3).
The image format of the IRDIS data after the reduction is 1024 × 1024 pixels, with a pixel size of 12.27 × 12.27 mas. We determined a resolution of 44 mas (see Fig. 1) for these data. This value is slightly lower than expected for the observing conditions listed in Table 1 because of the low-wind effect. The final reduced images, intensity (Stokes I), and polarized intensity (Stokes Qϕ) for the H-band observations are shown in Fig. 2.
 |
Fig. 1 Normalized PSFs of HD 142527 for the ZIMPOL VBB and IRDIS H-band normalized to a total count level of 106 within an aperture diameter of 3 arcsec. The bump at ~0.08′′ in the H-band PSF is caused by the low-wind effect. The locations of the AO control rings and the disk are indicated. |
 |
Fig. 2 Polarized intensity Qϕ and total intensity I signal of the disk around HD 142527 for the non-coronagraphic VBB and the coronagraphic H-band observations. The scale for the size and orientation for all images is shown in the bottom left image. The position of the star is marked with a cross. The color scales are in counts per DIT. The VBB Stokes I image in the top right frame is scaled with r2.75 (r is the distance from the star) to improve the visibility of the disk, and therefore no color scale is given. The bright point-like spots in the same image are ghost images of the star that are produced by the instrument. |
3.3 Intrinsic stellar polarization
As part of the data reduction for all datasets, we normalized the Q and U polarization measured in an aperture for each individual exposure by adjusting the scale factors cQ and cU in the subtraction Qnorm = Q − cQ ⋅ I = 0 and similar for Stokes U. We used an annulus from r = 0.2–0.6′′ as aperture, containing much light from the central source, but avoiding the saturated center and the scattered light from the inner and outer disks. This normalization procedure is common practice for differential polarimetric imaging of disks to remove disturbing polarization signals from the telescope and the interstellar polarization because a disk often only becomes visible after this polarimetric normalization (e.g., Quanz et al. 2011; Avenhaus et al. 2014). However, the method assumes that the central source has no intrinsic polarization, and this is questionable for HD 142527 because there is polarization at a level of 0.5–1.0% from a very compact, partly unresolved inner disk (Avenhaus et al. 2017), and we also obtained unusually large cQ and cU normalization factors.
3.3.1 Correction for the telescope polarization
The telescope polarization is mainly introduced by inclined mirrors and strongly depends on the telescope pointing direction. This has been modeled for VLT/SPHERE for measurements of polarization standard stars with a precision of Δp ≈±0.1% (Schmid et al. 2018; van Holstein et al. 2020). For the ZIMPOL data, a precise measurement is possible because the observations of 2017 exhibit a large parallactic angle range of about 50° or a circular arc of 100° in the Q/I–U/I plane, as discussed in detail in Appendix A.2 of Hunziker et al. (2020).
We measured a total sum of intrinsic and interstellar polarization of p⋆ (VBB) = 1.0 ± 0.1% for the 2017 data along a position angle φ⋆(VBB) = 51 ± 3° and p⋆(H) = 0.6 ± 0.1%, φ⋆ (H) of 69 ± 5°. The 2015 and 2016 VBB data are not optimal for measuring the stellar polarization because the observations were taken after meridian passage with small changes in parallactic angles. In addition, the telescope mirrors were recoated later in 2016, and therefore the telescope polarization is much higher for the 2015 and 2016 data than for the 2017 data. However, by combining all the 2015 and 2016 data, we were able to determine p⋆ (VBB) = 0.8 ± 0.1% and φ⋆ (VBB) = 49 ± 4°, which agrees well with the measurements from 2017. To our knowledge, there are no prior measurements published for the linear polarization of HD 142527.
This total stellar polarization could be caused by interstellar polarization from absorption by magnetically aligned dust grains along the line of sight or by intrinsic stellar polarization and scattering from hot dust near the star, which was partly resolved by Avenhaus et al. (2017). However, the polarization in this paper was also normalized, and the net contribution of the star in the inner disk (< 0.2′′) to the polarization in the annulus that was used for the normalization is not known.
The interstellar polarization contributes a factor cism to the stellar polarization, which applies equally for the star and the disk. If the total stellar polarization is only caused by interstellar polarization, then the normalization would correct for it, as for the telescope polarization. However, if there is a significant contribution from the central object to the polarization, then the normalization is nulling this real signal from the central object, and an error in the normalized polarization signal of the disk is introduced. Therefore we investigate the nature of the total stellar polarization for HD 142527.
3.3.2 Interstellar polarization for HD 142527
A polarization of p⋆(VBB) ≈ 1.0% and p⋆ (H) ≈ 0.55% would be a high interstellar polarization for a star at a distance of 156 pc like HD 142527. Other stars at similar distances only exhibit polarizations of a few dozen percent, and polarizations of > 0.5% are uncommon for distances <500 pc (Gontcharov & Mosenkov 2019). However, our object is located in the Lupus cloud complex, a star-forming region at a distance of ~ 150–200 pc (Comerón 2008; Gaia Collaboration 2018). Its exact location is close to the Lupus 4 field, one of the large dusty clouds in Lupus, and other stars in this field show high linear polarizations p ≈ 0.5–2.5% in the optical with a rather narrow distribution of position angles of φp = 26 ± 9° (Rizzo et al. 1998), which can be explained by a large-scale interstellar polarization component.
Pottasch & Parthasarathy (1988) estimated the extinction from dust along the line of sight toward HD 142527 to be AV = 0.6, which was supported by Verhoeff et al. (2011), who also obtained an extinction of AV = 0.6 to account for the reddening of the stellar light in their model. However, Malfait et al. (1998) noted a discrepancy between the observed total extinction and the interstellar extinction in their photometric study, indicating that potentially variable intrinsic dust contributes along the line of sight.
In addition, the position angles φ⋆ for the polarization p⋆ of HD 142527 in our data are about 25° larger for the VBBand about 43° larger in theH-band than the mean presented in Rizzo et al. (1998), indicating that an intrinsic polarization component contributes as well, particularly for the H-band. Moreover, the measured wavelength dependence of the total stellar polarization Λ =p⋆(H)∕p⋆(V BB) = 0.6 ± 0.1 does not agree well with interstellar polarization as described by Serkowski et al. (1975), which predicts a lower ratio of Λ ≈0.32 on average, again indicating that an intrinsic polarization component is present in HD 142527. However, this is based on an empirical law with significant uncertainties and should therefore not seen as strong evidence.
The combined evidence shown in this section points towards the presence of interstellar and intrinsic dust components which can both contribute to the observed polarization p⋆ of HD 142527, but with the limited available data from previous studies it is not possible to disentangle the two polarization components. Therefore, we have to assume that the star exhibits at least some intrinsic polarization in addition to the interstellar polarization. Spectropolarimetry of this object would be required to determine the contributions of intrinsic and interstellar polarization.
3.3.3 Polarimetric normalization and disk polarization
We investigated the effect of the applied normalization on the disk signal for HD 142527 because we have strong evidence that the star and the barely resolved inner hot dust produce a net intrinsic polarization of p ≈ 0.3–0.7%. A detailed calculation of how the normalization of Q and U affects polarized signals close to the star for an intrinsically polarized star is presented in Hunziker et al. (2020) (Appendix B). This formalism can also be applied to the case of an extended source, in particular, the disk of HD 142527. We assumed a disk with intrinsic polarized signals 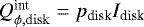 and
and  and a star with intrinsic polarization components p⋆,Q and p⋆,U, and applied Eq. (B.8) from Hunziker et al. (2020) to determine the disk signal Qϕ,disk and Uϕ,disk after the normalization,
 (2)
(2)
This shows that the measured degree of polarization for the disk pdisk changes due to the normalization by an amount corresponding to the intrinsic stellar polarization p⋆. This means that even a large uncertainty in p⋆ of 0.1% for the stellar polarization would only have a small effect on the relative disk polarization Qϕ,disk∕Idisk if pdisk is at a level of 20–40%, as for HD 142527. Furthermore, the change is not constant over the whole image, but for Qϕ,disk it adds a quadrant pattern aligned withthe direction φ⋆. A quadrant pattern rotated by 45° is also added to the Uϕ,disk signal, so that Uϕ,disk systematically deviates from zero. A nonzero Uϕ,disk signal would usually not be expected for a large low-inclination disk like HD 142527 unless the scattering grains are aligned or second-order scattering effects are really strong, which was investigated by Canovas et al. (2014) for an unpolarized central source. The amplitude of the introduced pattern is p⋆ Idisk for both Qϕ,disk and Uϕ,disk.
To illustrate the effect, we simulated an azimuthally symmetric disk with pdisk = 20% and a star that exhibits intrinsic polarization along the direction of U (or φ⋆ = 45°), which is similar to HD 142527, but with an unreasonably high p⋆ of 5% and 20% for illustration purposes. In Fig. 3 we show Qϕ,disk after normalizing Q and U in a circular aperture < 0.6′′ that did not overlap with the disk signal. The Qϕ,disk signal after the normalization clearly deviates from azimuthal symmetry, with the deviation aligned with the direction φ⋆ and a variation of pdisk of about ± p⋆, in agreement with Eq. (2).
The polarization of the disk of HD 142527 is affected in a similar way as the disk model shown in Fig. 3. Our measured polarization pdisk along the position angle of p⋆ (around 60°) should be artificially increased by≲1% and decreased by the same amount in the perpendicular direction (around 150°) if p⋆ is purely due to intrinsic stellar polarization. Because our resolved measurements yield typical values of pdisk ≈ 30% with errors larger than 1%, we consider the effect of the possible intrinsic polarization of the star as negligible. Other more accurate measurements such as the total disk-integrated degree of polarization pdisk are less affected because the positive and negative overcorrections introduced by the normalization mostly average out when integrated over the whole or over half of the disk because of the azimuthal periodicity of the induced variation. However, because the disk is slightly asymmetric, we find that the normalization can result in a maximum error of about 0.3p⋆ for the total disk-integrated degree of polarization pdisk. This corresponds to an error of 0.3% and 0.17% for the VBB and H-band data, respectively.
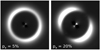 |
Fig. 3 Simulated Qϕ disk signal for an azimuthally symmetric disk with pdisk = 20%, illustrating the effect of polarimetric normalization for a star with very strong (10–40 times stronger than estimated for HD 142527) intrinsic polarization of 5% (left) and 20% (right) with φ⋆ = 45°. |
4 Data analysis
Our measurements include the integrated total intensity of the system Itotal in the VBB and H-band and the total intensity Idisk and polarized intensity Qϕ,disk from the disk alone. In addition, we determined the intensity  and polarized intensity
  from the far side of the disk as a simple way to quantify the brightness difference between the predominantly forward- and backward-scattering side. Furthermore, we measured radial profiles of the disk intensity Idisk(φ, r) and polarized intensity Qϕ,disk(φ, r), with φ the position angle (PA) with respect to north and r the projected separation from the star. We then used the measurements of Qϕ and I to derive the linear degree of polarization p = Qϕ∕I of the reflected light. This section describes the details of our data analysis. The most relevant measurement results are then transformed into physical units and are summarized in Sect. 5.1.
4.1 PSF smearing effect
The spatial resolution of the observations is determined by the wavelength and by the performance of the AO system and the observing conditions. The finite resolution has a strong effect on measurements in small apertures. We refer to this as the PSF smearing effect. An analysis of the unsaturated PSF for the VBB observations shows, for example, that only about 50% of the total intensity is located within 3λ∕D of the center of the PSF of a point source (see, e.g., Schmid et al. 2018). Therefore a significant fraction of the total intensity is omitted in photometry with smaller apertures unless the measured photometric flux values are corrected. In addition, the effect is different for the I and Qϕ signal. The I signal is just smeared because it is strictly positive. For the Q and U signal, however, the PSF smearing additionally leads to crosstalk between disk regions with negative and positive polarization, which cancels out a fraction of Qϕ (Schmid et al. 2006). This additional effect must be considered to avoid incorrect results for the degree of polarization Qϕ ∕I. In order to estimate correction factors fcorr for our measurements, we simulated these effects in the following way: We first simulated I, Qϕ, and Uϕ images of a face-on azimuthally symmetric disk with Uϕ = 0 and with radial profiles similar to the real disk. We then transformed the Qϕ and Uϕ images into the Q and U basis and convolved all intensities I →Ĩ,  and U →Ũ with the unsaturated PSF of the particular observations3. Afterwards we transformed the convolved
  and Ũ images back into the
  , Ũϕ basis and finally applied all measuring procedures to I, Qϕ and Ĩ,
  , and calculated the correction factors
  and
and 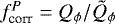 for the photometric results.
We measured the uncorrected integrated intensities of the disk Ĩdisk and  in an annular aperture from 0.6′′ to 1.75′′ around the central star as indicated in Fig. 4. The outer radius was chosen as large as possible to fit into the field of view (FOV) of ZIMPOL. We investigated the amount of integrated intensity lost due to PSF smearing for simulated disks with radial profiles similar to the disk in HD 142527, and we report the correction factors fcorr for the integrated disk intensities resulting from this analysis in Table 2. The values in Table 2 show the average correction factors for all of the tested radial profiles, and the errors show the variance for different radial profiles. We find that
  and
and  are different, and there is no strong dependence on the radial profile of the disk. However, we note that more integrated intensity is lost in general (higher fcorr values) for disk profiles that are less strongly radially extended. The effect becomes increasingly stronger for small disks that are not much larger than the data resolution. The values in the table show that fcorr is significantly higher for the VBB data than for the H-band data, even though the resolution in VBB is better. This shows that the effect of the Strehl ratio, which was lower in the visible, is stronger in this case because the PSFs in observations with low Strehl ratio have a strong residual halo (Fig. 1), therefore the total flux of the PSF is smeared over a larger portion of the image.
In the same way, we modeled the effect of PSF smearing for the measurements of the radial disk intensity profiles Ĩdisk(φ, r) and  and report the fcorr values in Table 2. Because the profile measurements are different from the total intensity integration, the resulting fcorr are differentas well. The corrections are significantly larger because a larger fraction of the “smeared" flux is missed in a radial line extraction compared to the integration in a large aperture. This is further discussed in Sect. 4.3. The advantages of the radial profiles are the equal correction factors
  , which result in much more precise measurements of the degree of polarization because
 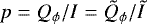 eliminates one major source of error. The situation is depicted in Fig. 5 for simulated H-band disk intensity profiles similar to the measured profiles at φ = 200°, a position angle where the profile determinations are very accurate for both wavelengths. We show the convolved profiles
  , Ĩdisk(φ, r) and
  together with the initial model profiles before convolution. The radially integrated intensity profiles Qϕ and I of the convolved disk signal underestimate the true model intensities by about 26% on average, which corresponds to
 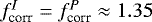 . However, the measured degrees of polarization of the convolved disk
  are very close to the initial model values at all separations r because the measured profiles Ĩdisk(φ, r) and
  are both degraded in the same way by the PSF smearing (see Sect. 4.3).
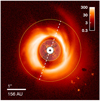 |
Fig. 4 HD 142527 Qϕ image of the outer disk in H-band with IRDIS. The two yellow circles at 0.6′′ and 1.75′′ indicate the annulus aperture we used to measure the total disk intensity. A white disk with radius 0.2′′ covers the inner part of the image, which is dominated by residuals from speckles and from the coronagraph. The position of the star behind the disk is marked with a cross. The dashed line indicates the approximate direction of the disk major axis at a position angle of − 20°. The scale isin counts for a 16 s DIT. North is up and east is to the left. The features to the southwest of the disk originate from defects on the IRDIS detector. |
Correction factors for PSF smearing for the HD 142527 observations.
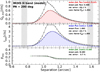 |
Fig. 5 Simulated radial profiles for Qϕ (red) and Stokes I (blue) and the degree of polarization Qϕ∕I (green) convolved with the IRDIS H-band PSF. The black curves show the initial model profiles of the disk before the convolution. The convolved profiles roughly correspond to the disk measurements at position angle 200° (see Fig. 8, bottom). The radially integrated mean disk intensities and the relative lost intensity (rel. error) were calculated for both profiles between the cross-hatched areas. |
4.2 Integrated intensity analysis
First, we integrated the polarized disk intensity Qϕ,disk in an annular aperture from 0.6′′ to 1.75′′ relative to the total intensity of the system Itotal in a circular aperture with radius 1.75′′ (see Fig. 4). We used the flux calibration frames of the H-band observations to measure Itotal(H) and the unsaturated VBB observationsfrom 2016 to measure Itotal(VBB). We obtainedItotal(VBB) = 4.13 ± 0.02 × 10⁶ cts s−1 and Itotal(H) = 2.00 ± 0.10 × 10⁷ cts s−1 for the total system intensities and Qϕ,disk∕Itotal(VBB) = 0.46 ± 0.02% and Qϕ,disk∕Itotal(H) = 1.07 ± 0.07% for the polarized disk intensity contrast. Weassume that the Qϕ,disk∕Itotal values are constant in time because no sign of variability has been reported up to now for this disk. The errors are dominated by the uncertainty of the correction factors in Table 2.
Measuring the disk intensity is difficult because we have to separate the weak disk signal Idisk from the stellar PSF in the Stokes I image. For a rough estimate of Idisk, we scaled the reference VBB and H-band PSFs to the brightness of HD 142527 and removed it from the Stokes I image of the respective HD 142527 dataset. This analysis resulted in intensity contrast values of Idisk∕Itotal(VBB) < 4% and Idisk∕Itotal(H) = 4 ± 1%. The errors are dominated by the variability of the reference PSFs. For the VBB data, it was not possible to extract the disk intensity accurately, resulting in a mere upper limit for the contrast. More accurate results for the total disk intensity measurements follow from the degree of polarization in Sect. 5.1.
We also quantified the polarized intensity for the near and far sides of the disk inside the annular aperture. For position angles φ ranging from −20° to 160°, that is, the eastern side of the annulus shown in Fig. 4, we measure  in the visual, or in other words, about 49 ± 4% of the polarized disk intensity originates from the far side of the disk. In the H-band, the polarized intensity from the far side is
 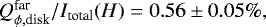 which corresponds to 52 ± 9% of the total polarized intensity from the disk. The results suggest that the reflected polarized intensity is evenly distributed on the near and far sides of the disk for both wavelengths. These values were already corrected for PSF smearing using the values from Table 2.
 |
Fig. 6 Measured radial polarized intensity profile from the HD 142527 IRDIS data in H-band (blue crosses) at a position angle of 200°. The solid red line was fit through the data points in the cross-hatched areas. We consider this as the zero line for the polarized surface brightness radial profiles. |
4.3 Radial profile analysis
4.3.1 Disk polarized intensity profiles
For the measurement for each radial profile  , we first extracted a line of pixels in the Qϕ images along a position angle φ, starting from the position of the star at r = 0. The pixels were then binned to lower the statistical errors of the measurement, but we retained a sampling in radial direction of ~ 0.015′′. For each profile we defined the positions of the inner and outer edge of the disk signal and determined the mean intensity of several pixels at these points. We used a straight line through these points as zero level for
  , just as indicated in Fig. 6. This removes the polarized intensity outside the two cross-hatched areas and below the red line indicated in Fig. 6. We used the same inner and outer edge for both VBB (ZIMPOL) and H-band (IRDIS) observationsto ensure that the profiles can be compared between both wavelengths. The outer boundary is therefore limited by the VBB data because the FOV of ZIMPOL is much smaller than the FOV of IRDIS. This kind of normalization of the radial profiles will lead to a small (~5%) underestimation of the radially integrated polarized intensity in a given profile, but because we applied the same method to the intensity profiles Ĩdisk(φ, r) as well, it will provide a high accuracy for the degree of polarization.
4.3.2 Disk intensity profiles
For the measurement of Ĩdisk(φ, r), we first extracted radial profiles from the observed Stokes I(φ, r) = I⋆(φ, r) + Ĩdisk(φ, r), following the same strategy as explained above for Qϕ, and then subtracted from it the signal I⋆(φ, r) of the bright stellar PSF. To simulate the stellar PSF profile I⋆(φ, r), we applied a special form of RDI, using the reference star PSF images for ZIMPOL VBB and IRDIS H-band discussed in Sect. 3.1. This method proved to deliver reliable results for Ĩdisk(φ, r) for both datasets, and it is a straightforward way to quantify the systematic errors of the measurement. From the VBB reference dataset we selected 120 × 1.1 s exposures distributed over the whole observing run. From the H-band dataset we selected all 172 × 16 s exposures. This ensured that both sets of reference images contained PSFs with a range of different observing conditions and AO performances. From each individual PSF we extracted 72 reference profiles  at position angles φ = 0°, 5°, 10°, etc., with each
  being an azimuthal average over a 10° section of the image. This resulted in a total of 8640 and 12 384 different reference profiles for VBB and H-band, respectively. We then used a least-squares algorithm to fit each
  to the I(φ, r) profiles of each investigated dataset for HD 142527. The only free parameter for the fit was the scaling factor ki. In Fig. 7 we show examples of several different
  reference profiles compared to the radial profiles I(φ, r) at position angle φ = 200° for the VBB and H-band. The cross-hatched areas highlight where the
  were fit to Itotal(φ, r) to determine ki. The position of the areas used for the fit were chosen for each radial profile individually such that they do not overlap significantly with the disk intensity. We used the mean of the N = 4000 best fitting
  profiles (red line) as approximation for I⋆(r),
 (3)
(3)
The quality of the fit was assessed through the root-mean-square (RMS) of the residuals after the fit, and the profiles with the smallest RMS were selected for Eq. (3). In addition,  with small RMS but ki that deviated significantly from the expected scaling factor4 were excluded from the calculation of the mean because their radial profiles can deviate significantly from the true I⋆ (r) between the cross-hatched areas.
In the H-band data, the mean reference profile models fit the increased intensity produced by the AO control ring at ~ 0.9′′ very well (Fig. 7, bottom). The second bump in the radial profile at ~ 1.1′′ is caused by the disk intensity. In the VBB data, the disk is far outside the AO control ring, therefore the disk signal is less disturbed by the PSF bump caused by the AO control radius, but the brightness of the disk relative to the stellar PSF is much lower than in the H-band data.
As a last step, just like for  , we then also fitted a line through Ĩdisk(φ, r) at the same reference points inside and outside of the disk (cross-hatched areas in Fig. 6), along which we set the radial profile to zero. Detailed examples for the resulting Ĩdisk(φ, r) at φ =200° are presented inFig. 8, and all the measured radial profiles can be found in Appendix A. The radial profiles
  and Ĩdisk(φ, r) for each position angle yield a radial profile of the degree of polarization
  and an intensity-weighted average degree of polarization pdisk(φ), which is denoted for each position angle in Appendix A.
Because the IRDIS observations were optimized for the detection of the disk (e.g., coronagraphic long exposure time), the signal of the disk is much stronger in the H-band data. However, it is more challenging to reliably subtract the stellar PSF from the disk signal and determine Ĩdisk(φ, r) in these data because of the AO control ring and the diffraction pattern of the telescope spiders (see Fig. 2). The diffraction spiders are present in the VBB data as well, but they are weaker and more diluted in the reduced data. The AO control ring is located at a distance of about 0.34″ for the ZIMPOL VBB observations, which is clearly inside the inner rim of the disk, but about 0.84″ in H-band, where it coincides with parts of the disk in HD 142527. The southern part of the disk is farther away from the star than any other part (see Fig. 2, bottom right panel) and the AO control ring and the disk form two distinct radial features that can be separated most reliably as shown in Fig. 7 for a position angle of 200°. At other position angles, the disk signal and the AO control ring overlap, introducing larger uncertainties for the measured radial profiles, especially for the far side of the disk at about position angles 30° to 90°. The narrow and bright surface brightness profiles on the near side of the disk generally allowed for more precise measurements of Ĩdisk(φ, r) and eventually pdisk(φ, r). For several position angles, especially in the H-band data, measurements were impossible due to the bright diffraction spiders of the telescope. Some of these problems could be mitigated by performing measurements only on the 8 s or 16 s DIT data separately because the spider features at a given position angle can be absent in one of the two sets.
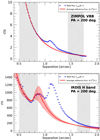 |
Fig. 7 Measured radial intensity profiles of HD 142527 for the ZIMPOL VBB and the IRDIS H-band data (blue crosses) at a position angle of 200° compared tothe mean of the best-fitting radial profiles from the reference data (solid red line). The shaded red area shows the 1σ spread of the reference profiles. All reference profiles were fit only in the cross-hatched areas to the HD 142527 data to avoid fittingand subtracting the disk signal. |
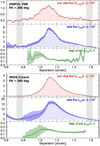 |
Fig. 8 Radial profiles for Qϕ (red), StokesI (blue), and the degree of polarization Qϕ∕I (green) at a position angle of 200° for the ZIMPOL VBB observations (top) and for the IRDIS H-band observations (bottom). The intensity values on the vertical axis are in units of surface brightness relative to the total intensity of the system, i.e., [Itotal∕arcsec2]. For the degree of polarization, only the values inside the cross-hatched boundaries with <0.5 error are shown in the plot to improve the visibility. |
4.3.3 Measurement errors
The statistical noise of the individual data points in the radial profiles is low (VBB data: ~ 4 × 10⁻³ cts; H-band data: ~ 0.3 cts) because the data are binned. In the VBB data, the detector read-out noise dominates the statistical noise because be the number of counts at the separation of the disk is low (see Fig. 7, top). In the H-band, the noise is composed of photon noise, speckle noise, and systematic errors from the extraction of the Idisk values.
For the uncertainty of  , we only considered the statistical errors because other noise sources are eliminated by the polarimetry. For Ĩdisk(φ, r), the systematics from the measurement of the radial profile usually dominate the error budget. To calculate the systematic errors, we determined the 68.3% spread of the 4000 best-fitting reference profiles
  . The final error bars ofĨdisk(φ, r) are then calculated by adding the statistical and systematic errors. The errors for the degree of polarization pdisk(φ, r) were calculated with error propagation from the errors of
  and Ĩdisk(φ, r).
Relative photopolarimetric measurements for HD 142527 from this work.
4.3.4 Integrated disk intensity and degree of polarization
Instead of using large-aperture photometry, the integrated disk intensities Qϕ,disk and Idisk can also be calculated by integrating  and Ĩdisk(φ, r) in radial and azimuthal direction and using
  and
and  to correct for PSF smearing. However, as mentioned before, the normalization of the radial profiles can lead to an underestimation of the intensity values. Therefore the integrated radial profiles only provide a lower limit for the integrated disk intensity values,
 (4)
(4)
 (5)
(5)
Because we measured  and Ĩdisk(φ, r) only for a limited set of φ and r with some sector missing, we linearly interpolated the missing values in order to calculate the integral. The calculated lower limits for Qϕ,disk∕Itotal and Idisk∕Itotal are 0.29% and 1.3% for the VBB data and 0.90% and 3.4% for the H-band, which is consistent with the measurements from the large-aperture photometry presented in Sect. 4.2.
More importantly, the derived profiles Qϕ,disk and Idisk can be used to determine the degree of polarization pdisk with high precision because the normalization of the radial profiles affects the intensity and polarized intensity in the same way and therefore barely changes the degree of polarization (see Fig. 5). By integrating the radial profiles as shown in Eq. (4) and (5), but separately from position angles − 20° to 160° and 160° to 340°, it is also possible to calculate the degree of polarization just for the far side  and near side
  of the disk. The results of these measurements are reported in Table 3.
5 Results
5.1 Final photopolarimetric values
The most precise measurements described in Sect. 4 are the integrated polarized intensity Qϕ,disk in large apertures and the degree of polarization pdisk from the radial profiles. The final values are summarized in Table 3. The total disk intensity Idisk could not be measured precisely but was instead calculated from Qϕ and p. The brightness magnitudes and spectral flux densities for the total system flux were obtained by using the measured magnitude and flux values from the Tycho-2 (Høg et al. 2000), Gaia (Gaia Collaboration 2018), and 2MASS (Cutri et al. 2003) surveys to produce an SED of HD 142527 from B- to K-band. We then used the Gaia GRP and 2MASS H-band filter transmission curves to correct for the different filter responses compared to the ZIMPOL VBB filter and the IRDIS H-band, and we used a blackbody spectrum at 9730 K to obtain the correct magnitudes in the Vega system. The errors reported for the magnitude and flux values in Table 4 result from the combination of our own measurement errors, the measurement errors of Gaia and 2MASS, the variability of HD 142527 determined with HIPPARCOS, and the estimated interpolation errors caused by the low spectral resolution of the SED that was used for HD 142527. The magnitudes derived for HD 142527 with the ZIMPOL VBB filter and the IRDIS H-band filter are within ±0.10 and 0.05 of the values measured with the corresponding Gaia and 2MASS filters, respectively.
Absolute flux values for HD 142527 from this work.
5.2 Brightness and degree of polarization depending on position angle
The radial profiles characterize the radial and azimuthal variation of the disk surface brightness and pdisk. The measurements summarized in Fig. 9 show for each position angle φ the  , Ĩdisk(φ, r) and pdisk(φ, r) values from the four brightest points of the
  radial profiles from Appendix A (in other words, measured along the bright ridge). The location of the brightest points for each position angle are marked in panels a) and b). We chose not to display the average or integrated total intensity for each position angle because these values depend on our selection of the inner and outer edge of the radial profiles, which had to consider the FOV of ZIMPOL, faint disk sections, and PSF noise features. The brightest points, however, show little dependence on this empirical choice and therefore provide reliable measurements of the disk surface brightness. These points also provide the most precise values of pdisk(φ, r). However, because pdisk is a normalized quantity, it can also be calculated as the intensity-weighted average over the whole radial profile as long as it is not strongly dependent on r. We show this by comparing the intensity-weighted radial average pdisk(φ) (dashed black line) versus the intensity-weighted average of the brightest points (green dots). The values agree very well at most position angles, except for the H-band values in the range between 10° to 80°. These values are affected by systematic noise from the AO control ring, which seems to cause an underestimation of the brightness from the brightest spots on the disk.
The azimuthal profiles are similar for both wavelengths and clearly show the strong Ĩdisk(φ) asymmetry between the near and far sides of the disk, while  is symmetrical. This produces the significant asymmetry of pdisk(φ) with a broad Δφ ≈ 50° minimum and maximum degree of polarization centered on the expected location of the semiminor axis of the disk at a position angle of 70°∕250°.
The surface brightness in Fig. 9 is given relative to the star, but the stellar magnitudes from Table 4 allow a simple transformation into magnitudes per arcsecond squared with
 (6)
(6)
This formula includes the PSF smearing correction factors  for the integrated radial profiles (Table 2). The correction factors are precise within the error bars stated in Table 2 for the radially integrated intensity values, but not necessarily for individual points on the radial profiles. Especially the maximum intensity of narrow peaks, as observed at the disk rim on the near side, is more strongly effected by PSF smearing and would require larger correction factors (up to 50% larger). The accurate calculation of an unconvolved maximum surface brightness on the near side would therefore require deriving individual correction factors for each point on the radial profile. Therefore we limit the analysis here to the far side of the disk at about a position angle of 70°, where we determine a more accurate PSF smearing corrected surface brightness with the factors in Table 2 for all individual points on the radial profiles because the profiles are relatively flat. With Eq. (6) we calculate a surface brightness of 12.9±0.2 mag arcsec−2 in VBB and 10.2 ± 0.2 mag arcsec−2 in H-band for the points marked in Fig. 9. This translates into a spectral flux density of 18 ± 3 mJy arcsec−2 in VBB and 87 ± 16 mJy arcsec−2 in H-band. The results in H-band are on the same order as the results presented in Honda et al. (2009), but a detailed comparison is not possible because the authors did not investigate the effect of PSF smearing in their work and only analyzed a small section of the near side of the disk around the position angle 240°.
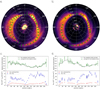 |
Fig. 9 Polarized intensity of HD 142527 in the VBB (a) and H-band (b) and the corresponding surface brightness Ĩdisk(φ), maximum polarized surface brightness |

5.3 Simulating near- and far-side brightness profiles
The near- to far-side asymmetry of the observed disk surface brightness and degree of polarization can also be seen in the individual  , Ĩdisk(r, φ) and pdisk(r, φ) radial profiles (Fig. A.2). We illustrate this in Fig. 10 with a few selected radial profiles located close to the semiminor axis on the near and far side. The polarized surface brightness profiles
  show similar maximum values on both sides, while the maximum values of Ĩdisk(r, φ) are significantly higher on the near side compared to the far side. Therefore the degree of polarization is significantly lower on the near side. Both effects can be explained by the difference in scattering angle and the presence of forward-scattering dust. The scattering angle for the far side decreases with separation and lies between ≈ 120° and 90° and the produced degree of polarization is high, while the scattering angle on the near side is about 50°, which produces a lower degree of polarization.
We constrained the optical properties of the dust with simulations of the photon absorption and scattering with Monte Carlo simulations of the photon random walk (Ma & Schmid, in prep.). The photons are sent out by the central star and undergo single and multiple scatterings or absorption in the disk wall. The angle dependence of the scattering intensity is calculated with the Henyey–Greenstein phase function, and the angle dependence of the degree of polarization is modeled in the same way as for Rayleigh scattering. The disk wall is approximated locally by a plane-parallel model, and the scattered photons escape from the same position as they penetrated the wall. The optical properties of the dust are described by the asymmetry parameter g, the maximum polarization Pmax for a scattering angle of 90°, and the single-scattering albedo ω. We simulated the reflected light from the disk for the far side φ = 70° and the near side φ = 250° adopting the geometry of the disk surface based on the axisymmetric disk model for HD 142527 from Marino et al. (2015), which provides a detailed dust density distribution in radial and vertical direction. We also adopted a surface of constant optical depth to define the disk wall geometry. To improve the match with our observations, we changed the length scales of the disk to account for the new Gaia distance to HD 142527 of 156 pc instead of 140 pc, adopted a disk inclination of 20°, and moved the near side farther out radially (by ~10 AU) to account for the quite substantial deviations from axisymmetry of HD 142527. A vertical cut through our inclined disk model is shown in Fig. 11, illustrating the visible parts of the adopted disk surface geometry for the Monte Carlo simulations and the underlying density distribution model from Marino et al. (2015).
The approximation of the disk wall by a plane-parallel surface is expected to be quite good for the central section of the wall on the far side, which is close to perpendicular to the midplane. The strongly curved rims of the disk walls and the flat upper disk surfaces are more problematic; a plane-parallel geometry is probably a poor approximation here. Therefore we fit our model results to the measured profile sections for the steep wall on the far side between 0.7′′ and 1.0′′ and investigated how well the model profile matches other disk regions. For our models we first selected the model scattering parameters ω and g for the scattering albedo and asymmetry and searched for a Pmax value that provided a good match with the measured degree of polarization of the wall on the far side. To first order, the simulated pdisk depends linearly on Pmax for given ω and g. This yields a family of scattering parameters that give the correct degree of polarization pdisk for the wall on the far side. The modeled surface brightness levels of the calculated Ĩdisk were scaled to fit the measured brightness on the wall of the far side. We discuss in Sect. 5.4 constraints on this scaling based on estimates for the stellar illumination and the disk surface reflectivity.
A few examples of simulated and PSF convolved radial profiles for the disk minor axis with scattering parameters that match the polarization level pdisk on the far side well are shown in Fig. 10 in comparison with the measured disk profiles. As in the observations, the reflected intensity on the far side around r =0.7′′ first increases faster than the polarized intensity with a corresponding pDisk(r) dependence of 0.25 at 0.7′′ and 0.31 at 0.9′′. Other sections of the simulated profiles show some shortcomings that are most likely caused by the adoptedplane-parallel surface geometry. For example, at larger separations on the far side (> 1′′), the simulated brightness drops faster with separation for all parameter combinations. In addition, the modeled degree of polarization increases rather than roughly remaining at a constant level.
The simulated radial profiles on the near side show a strong dependence on the asymmetry parameter g, and a good match is obtained for g = 0.75. However, we expect that the plane-parallel approximation overestimates the real g factor because the real HD 142527 disk will produce a significant contribution to the forward scattering peak from optically thin dust layers located above the near side disk rim and the upper disk surface (see Fig. 11). A flat surface model can compensate for this problem by boosting the forward-scattering with a large g parameter.
We find the following dependences and constraints for the three dust scattering parameters: The observed degree of polarization pdisk is directly proportional to the maximum polarization Pmax, therefore Pmax must be larger than the observed maximum pdisk because of depolarization from multiple scattering, which defines the strong constraints Pmax ≈ 30% for the VBB and Pmax ≈ 40% for the H-band. Increasing the single-scattering albedo ω enhances the amount of reflected light, but it also reduces pdisk because multiply scattered photons with randomized polarization contribute to the reflected light, but dilute the polarization signal. Therefore we only obtain a good match for the polarization of the wall on the far side if both ω and Pmax are high (e.g., ω = 0.5, Pmax = 0.70), or both are low (e.g., ω = 0.2, Pmax = 0.50), with some lower dependences on the g parameter as well. Our tests have also shown that this relation results in an upper limit ω < 0.7 because even for Pmax = 1, ω should not exceed 0.7 to match the data. Increasing the asymmetry parameter g mainly changes the ratio of the reflected intensity of the near and far sides of the disk (see Fig. 10). Unfortunately, our surface models are not suited to accurately model the near side of the disk, and therefore our constraint g < 0.75 is rather loose. Other than that, the g parameter also affects the degree of polarization somewhat, and strong forward-scattering or high g values increase the probability that scattered photons undergo additional interactions in the disk. This results in an increased probability for multiple scattering and reduced pdisk.
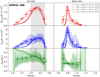 |
Fig. 10 Comparison of PSF-convolved model calculation for the radial profiles of
|

5.4 Disk reflectivity
The observed disk surface brightness shown in Fig. 10 is expressed relative to the total stellar intensity as the surface brightness contrast SB ∕I⋆. The peak value at the wall on the far side in the VBB is SB∕I⋆ = 6.7 × 10⁻³ arcsec−2 if corrected for the PSF smearing (correction factor of 1.67 from Table 2), which results in an intrinsic magnitude difference SB [mag arcsec−2] − m⋆[mag] = 5.4 mag arcsec−2. This surface brightness contrast can be used to estimate the surface reflectivity R of the wall on the far side, which is defined relative to an ideal white Lambert surface according to R = 1 for R = RLam. The reflectivity per unit area of a Lambert surface is RLam(θ) = cosθ∕π, where θ is the viewing angle with respect to the surface normal. The disk surface brightness is measured per unit area perpendicular to the viewing direction, orRSB,Lam = 1∕π, and it must consider the stellar illumination,
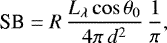 (7)
(7)
where d is the physical distance of ≈120–150 AU, and θ0 is the incidence angle ≈0°−45° (or cos θ0 ≈ 1–0.7) for the wall on the far side (see Fig. 11). Expressing d in arcsec yields a simple relation between the surface brightness contrast per arcsec2 and the surface reflectivity,
![Mathematical equation: \begin{equation*} R =\frac{\textrm{SB}}{I_{\star}}\,\cdot\,\frac{\pi}{\cos\theta_0}(d[\textrm{arcsec}])^2\,. \end{equation*}](/articles/aa/full_html/2021/04/aa40166-20/aa40166-20-eq58.png) (8)
(8)
This relation assumes that stellar emission is isotropic and that neither the observed stellar intensity I⋆ = Lλ∕(4π D2) nor the disk irradiation I0 = Lλ∕(4π d2) are strongly affected by absorption or additional emission. This assumption is probably not well fulfilled for HD 142527 because observations show scattering emission (Avenhaus et al. 2017), thermal emission (Verhoeff et al. 2011), and absorption (Marino et al. 2015) by hot dust located close < 5 AU to the star. Therefore we expect uncertainties of at least ± 30% for the deduced reflectivity.
According to the disk surface model (Fig. 11), the parameters for the wall on the far side near the disk midplane are about cosθ0 = 1 and d =0.8′′ or R = 0.015 ± 0.005. For the H-band, the convolved surface brightness contrast is roughly 2.2 times higher (see Fig. 9), but the correction factor for PSF smearing is lower. This results in an H-band reflectivity of 0.03 ± 0.01.
This low reflectivity requires that either the single-scattering albedo ω is low or that the scattering asymmetry g is very high, so that most photons are scattered farther into the disk where absorption can occur (Mulders et al. 2013). For example, the simulated reflectivity for the wall on the far side near the midplane is about R = 0.018 for the parameters ω = 0.2, g = 0.5, or R = 0.03 for ω =0.5 and g = 0.75 according to calculations for plane–parallel surfaces (Ma & Schmid, in prep.), and these two cases appear to approximately bracket the good values for the dust in HD 142527. We can also say that these model parameters would then suggest a maximum scattering polarization of Pmax ≈ 0.5 for the ω =0.2 case (VBB) and perhapsPmax ≈ 0.7 for ω = 0.5 for the H-band case.
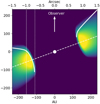 |
Fig. 11 Disk model geometry for HD 142527 for the vertical plane along the minor axis with the location of the visible part of the reflecting disk surface (solid white line). The color scale illustrates the adapted disk volume density model of Marino et al. (2015). The disk midplane (dashed white line) is inclined by 20° toward the observer. The dotted lines indicate the location of the steep wall on the far side of the disk between 0.7′′ and 1.0′′ where the approximation of the disk wall by a plane-parallel surface is expected to be quite good. |
6 Discussion
Differential polarimetric imaging of protoplanetary disks has seen steady improvements in the past decade fromdisk detection to high-contrast disk characterization with small inner working angles < 0.1′′. With the newest generation of instruments, now a level is also reached at which quantitative photopolarimetric measurements become possible (Perrin et al. 2015; Schmid et al. 2018; de Boer et al. 2020; van Holstein et al. 2020). This provides the scattering properties of the circumstellar dust and helps improve our understanding of dust evolution and the formation of planets in these disks.
Accurate polarization parameters for circumstellar disks are not easy to derive with high-contrast observations using extreme AO systems because of the strongly variable PSF. Knowing the PSF well is essential for calibrating the extended polarized emission of the disk. Moreover, it is often difficult or even impossible to disentangle the disk intensity signal from the very strong and variable stellar PSF. Even the differential polarization signal Qϕ is very useful, but many ambiguities in the photopolarimetric analysis are solved when the degree of polarization pϕ = Qϕ∕I for the scattered disk radiation can also be derived. Only a few measurements available to date, and according to our knowledge, no measurements except for this work that include a detailed assessment of the uncertainties.
The selection of a favorable disk target under these circumstances is crucial to achieve accurate photopolarimetric measurements. HD 142527 is an ideal target because the bright, strongly illuminated inner disk wall is located at a large apparent separation of 0.8–1.1′′, and therefore it is relatively easy to separate the disk from the bright star. In addition, PSF smearing and polarization cancellation effects are much smaller for extended disks. However, we caution that the disk of HD 142527 is a special case, in which hot dust near the star produces a strong near-IR excess, shadows on the outer disk, and observable strong scattering very close to the star. For this reason, it is unclear how well the observed stellar intensity I* represents the illumination for the disk region.
6.1 Color of the scattered light in HD 142527
The main results of this study are the photopolarimetric measurements for the VBB and the H-bands for the scattered light from the disk given in Table 3. The large wavelength separation of the two bands is ideally suited to quantify the spectral dependence of the scattered radiation. Figure 12 shows our results together with previous measurements found in the literature. We find a red color for the polarized intensity Qϕ,disk∕Itotal and the intensity Idisk∕Itotal for the normalized scattered radiation from the disk in HD 142527. The measured values are about a factor of two higher for the H-band (1.625 μm) when compared to the VBB (735 nm) or when the relative intensities are roughly proportional to the wavelength.
For the disk-averaged degree of polarization, we find values of pdisk = 21.8% in the VBB and 26.7% in the H-band. The polarization pdisk strongly depends on the disk azimuth angle. For both filters, pdisk is about 1.3times higher for the far side and 0.77 times lower for the near side than the averaged value. This difference is caused by the large asymmetry of the disk intensity, while the polarized intensity is essentially the same for the near and far sides at both wavelengths. The maximum disk polarization max (pdisk) measured for the brightest disk regions on the far side are about 30 ± 5% in the VBB and 40 ± 10% in the H-band (see Fig. 9).
We also estimate a surface reflectivity of the wall on the far side and obtain R = 1.5% for VBB and 3.0% for the H-band. Based on very simple calculations for a plane surface, we conclude that these reflectivity values can only be explained by strongly forward-scattering dust g ≈ 0.5–0.75 with a low single-scattering albedo ω ≈ 0.2–0.5. These estimates are based on the assumption that the stellar emission is spherically symmetric or that the disk “sees” the same stellar luminosity as an observer on Earth. This assumption can be questioned for the HD 142527 system, which showsstrong shadows from a close-in circumstellar disk (Marino et al. 2015) and a very strong IR excess of FIR∕F* = 0.92 (Dominik et al. 2003) from thermal dust emission. This suggests that the light from the central star could be attenuated differently for our line of sight and for the illuminated far side of the disk. If the stellar light is strongly attenuated along our line of sight, then the real disk surface reflectivity would be even lower than 2 to 3%, but the relatively strong IR excess could be easily explained. If there is strong absorption between the star and the far side of the disk (but not between the star and us), then the reflectivity would be higher, but the high relative IR excess would be harder to explain. This discussion is important because it questions the origin of the observed color and the wavelength-dependent reflectivity. The observed color and reflectivity of the disk could at least partially be caused by wavelength-depended anisotropic emission from the central object. A comprehensive study of this potential effect is beyond the scope of this paper, however. The effect of anisotropic emission in systems with complex close-in dust structures on measurements of the reflected light should be investigated further in the future.
6.2 Comparison with previous HD 142527 data
For the first time, we have presented scattered-light intensities for the disk around HD 142527 for visual wavelengths (< 1 μm). However, several previous measurements in the IR can be compared to our H-band results. They are included in Fig. 12. Fukagawa et al. (2006) measured the relative intensity Idisk∕Itotal of the scattered light for the H-band. Their result is 22% lower than our value. This can be considered as good agreement considering that the two studies used different apertures for the disk intensity measurement, and the observations of Fukagawa et al. (2006) were performed at a much lower Strehl ratio. Fukagawa et al. (2006) also measured the K-band intensity of the disk and found essentially the same Idisk∕Itotal ratio as for the H-band, indicating that the H − K color of the scattered light is gray. It would be interesting to obtain measurements for more bands between the VBB and H-bands for HD 142527 to determine the wavelength of the turnover from red to gray colors for the scattered intensity. Scattered-light intensity measurements were also obtained by Honda et al. (2009) in the H- and K-bands, the 3.08 μm ice absorption filter, and the L′-band (3.8 μm) for a bright region on the near side (southwest rim) of the disk. These data do not provide a disk-integrated intensity, but relative brightness measurements for the selected disk areas. They confirm the gray color for the H- and K-bands of Fukagawa et al. (2006), and report slightly red colors for K − L′ and a very strong attenuation of the scattered-light intensity in the 3.08 μm filter, most likely because icy grains are present in the scattering region.
The polarized intensity Qϕ,disk∕Itotal was determined previously by Avenhaus et al. (2014) for the H- and K-bands with data from NACO/VLT. They obtained the same disk morphology as observed by us, with about equal polarized intensity on the east and west side and the same intensity asymmetry. They measured Qϕ,disk∕Itotal = 0.71% for the H-band, or about one-third less when compared to our work. This result is compatible with this study because Avenhaus et al. (2014) did not consider polarimetric cancellation effects and expected systematic uncertainties of up to 30%. Their H − K color for the polarized intensity is quite uncertain (see Fig. 12), but also compatible with gray dust scattering in the IR.
The degree of polarization pdisk was also derived by Avenhaus et al. (2014) for the H-band. They measured 20% on the bright west side and about 45% with maxima above 50% on the east side. This agrees well with our results (Fig. 9) when we consider the calibration uncertainties mentioned in their paper. Canovas et al. (2013) also obtained H and Ks NACO/VLT imaging polarimetry of HD 142527 and found the same disk structures, but they derived upper limits for the polarization of pdisk ≤ 19% for the wall on the far side (east) and pdisk ≤ 15.8% for the west side from their H-band data. This strongly disagrees with our results and those of Avenhaus et al. (2014), and we suspect that the discrepancy is linked to the extraction of the disk intensity, which is a real challenge for disk data taken with older AO systems under suboptimal conditions.
 |
Fig. 12 Wavelength dependence of the measured relative intensities Idisk∕Itotal and polarized intensities Qϕ,disk∕Itotal for the scattered light from the disk in HD 142527. The colored symbols are from Table 3, the values marked with (F06) from Fukagawa et al. (2006) and (A14) from Avenhaus et al. (2014). The values (H09) from Honda et al. (2009) are given in an inset with an arbitrary scale factor to offset them from the other data because these are relative measurements for an area at the southwest rim of the disk. |
6.3 Comparison with other protoplanetary disks
The normalized disk polarization Qϕ,disk∕Itotal strongly depends on the disk geometry, especially on whether we can spatially resolve the strongly illuminated disk regions. The wavelength dependence of the scattered light is not so much a function of geometry, but far more depends on the dust scattering properties. We find a red color between 0.7 and 1.6 μm for the disk in HD 142527, and it is quite well established that other protoplanetary disks also show a similar red wavelength dependence. For example, Monnier et al. (2019) derived Qϕ,disk∕Itotal = 1.5% for the J-band and 2.5% for the H-band for HD 34700A. Stolker et al. (2016) reported values of 0.35% for the R-band, 0.55% for the I band, and 0.80% for the J-band for HD 135344B. Similar red colors for the polarized intensity are obtained by Tschudi & Schmid (in prep.) for HD 169142. Mulders et al. (2013) and Sissa et al. (2018) also derived a red color for the scattered-light intensity of the disk in HD 100546, and a gray color for V − H was found for TW Hya by Debes et al. (2013). We are not aware of a protoplanetary disk for which Qϕ,disk∕Itotal or Idisk∕Itotal increase toward shorter wavelengths. Thus, there seems to exist a predominant color trend, and the derived HD 142527 results represent an accurate measurement of this color gradient for the polarized intensity of a protoplanetary disk. A red color for the reflected light indicates a dust-scattering albedo that increases toward longer wavelengths. This is predicted, for example, by Min et al. (2016b) for dust aggregate models, and this type of dust is also used in the model calculation of the DIANA project (Woitke et al. 2016).
The measured degree of polarization pdisk of the reflected light strongly depends on the scattering angle, but also on the dust properties. The maximum pdisk is expected for a scattering angle α near 90°, and for most disks, there are scattering regions in which α is close to 90°, either on the far side as in the case of HD 142527 (see Fig. 11), or near the major axis for disks with higher inclination. Thus, the measured maximum polarization max(pdisk) appears to be another useful diagnostic for constraining the dust in protoplanetary disks. For HD 142527 we measured max (pdisk) ≈ 30% for the VBB and ≈40% for the H-band. Measurements for other disks include those of Perrin et al. (2009) with max (pdisk) ≈ 55% for AB Aur based on NICMOS/HST at 2 μm data. This result was also confirmed with ground-based imaging polarimetry by Hashimoto et al. (2011). Similar levels of polarization were obtained for HD 34700A by Monnier et al. (2019) with max (pdisk) ≈ 50% in the J-band and even ≈60% in the H-band. A much lower value is found by Tschudi & Schmid (in prep.) for HD 169142, who obtained only about max (pdisk) = 23 ± 5% for the visual R′- and I′ -bands. More estimates for the polarization of the scattered light from protoplanetary disks are reported in the literature, but usually with uncertainties of about a factor 1.5–2. For example, Silber et al. (2000) reported a degree of polarization of up to 50% at 1 μm for GG Tau, and Tanii et al. (2012) measured max(pdisk) ≈ 65% for UX Tau A in the H-band.
Accurate measurements of the degree of polarization for more disks are urgently needed to clarify whether max (pdisk) differs from system to system and if max(pdisk) is systematically lower for shorter wavelengths. Higher IR polarization may suggest a population of small grains or aggregates with small substructures so that scattering in IR is closer to the Rayleigh regime. The light-scattering grains would have to be relatively large, with sizes >1 μm (e.g., Mulders et al. 2013), to produce the red color in the visual, and simultaneously, the grains would have to exhibit a significant amount of porosity to be able to produce a high maximum polarization despite the large particle size.
7 Conclusion
We presented high-precision measurements of the polarized intensity, the intensity, the degree of polarization, and the surface brightness for the scattered light from the extended disk around HD 142527 for the two wavelengths 735 nm and 1.625 μm based on SPHERE/VLT data. The accuracy we achieved is unprecedented for the visual to near-IR color of the polarized flux and degree of polarization for a protoplanetary disk. Measurements of the wavelength dependence for the scattered light provide a key for determining the scattering properties of the dust because additional ambiguities in the interpretation of the measurements can be lifted.
We compared our measurements with a simple scattering model analysis for the wall on the far side of the disk, taking the near side into account as well. Our analysis yields some rough estimates for the single-scattering albedos (ω ≈ 0.2–0.5) and the maximum polarization introduced in the scattering (Pmax ≈ 0.5–0.75) and confirms the presence of forward-scattering dust particles (g ≈ 0.5–0.75), as has been suggested by previous studies. Systematic model calculations applied to our measurements or future high-precision measurements of other protoplanetary disks should provide much better determinations, including the wavelength dependence of these dust scattering parameters.
Moreover, the measurements of HD 142527 presented in this work could be improved with dedicated measurements using SPHERE. In particular, measurements of the disk intensity and the degree of polarization in the IR could be improved with reference star calibrations taken during the same night and by using the star-hopping mode that is available for SPHERE for this purpose. The S/N of the data for the visual data could be improved with longer exposure times in combination with a coronagraph, and the IR data quality would be better for observations without the low-wind effect and in pupil-stabilized mode to minimize the effects of the telescope spiders. Clearly, high-quality observations at more wavelengths from the V -band to the K-band could also be obtained.
Many scattering models for the dust in protoplanetary disks have been proposed that agree reasonably well for poorly measured disks, but usually show significant discrepancies if the color dependence of the scattering intensity and polarization are also considered. The maximum polarization and the red color for HD 142527 found in this work are quite similar to other protoplanetary disks and can be interpreted as the presence of large (> 1 μm) dust grains for the red color with a significant amount of porosity, which seems to be necessary to produce the high maximum polarization. However, further studies with detailed dust models are needed to explain the scattering parameters derived with our measurements.
Acknowledgements
SH and HMS acknowledge the financial support by the Swiss National Science Foundation through grant 200020_162630/1. SPHERE is an instrument designed and built by a consortium consisting of IPAG (Grenoble, France), MPIA (Heidelberg,Germany), LAM (Marseille, France), LESIA (Paris, France), Laboratoire Lagrange (Nice, France), INAF–Osservatorio di Padova (Italy), Observatoire de Genève (Switzerland), ETH Zurich (Switzerland), NOVA (Netherlands), ONERA (France) and ASTRON (Netherlands) in collaboration with ESO. SPHERE was funded by ESO, with additional contributions from CNRS (France), MPIA (Germany), INAF (Italy), FINES (Switzerland) and NOVA (Netherlands). SPHERE also received funding from the European Commission Sixth and Seventh Framework Programmes as part of the Optical Infrared Coordination Network for Astronomy (OPTICON) under grant number RII3-Ct-2004-001566 for FP6 (2004–2008), grant number 226604 for FP7 (2009–2012) and grant number 312430 for FP7 (2013–2016). We also acknowledge financial support from the Programme National de Planétologie (PNP) and the Programme National de Physique Stellaire (PNPS) of CNRS-INSU in France. This work has also been supported by a grant from the French Labex OSUG@2020 (Investissements d’avenir – ANR10 LABX56). The project is supported by CNRS, by the Agence Nationale de la Recherche (ANR-14-CE33-0018). It has also been carried out within the frame of the National Centre for Competence in Research PlanetS supported by the Swiss National Science Foundation (SNSF). Finally, this work has made use of the SPHERE Data Centre, jointly operated by OSUG/IPAG (Grenoble), PYTHEAS/LAM/CESAM (Marseille), OCA/Lagrange (Nice), Observatoire de Paris/LESIA (Paris), and Observatoire de Lyon, also supported by a grant from Labex OSUG@2020 (Investissements d’avenir – ANR10 LABX56). This research has made use of the SIMBAD database, operated at CDS, Strasbourg, France. Based on observations collected at the European Southern Observatoryunder ESO programmes 095.C-0273(A), 096.C-0248(B), 098.C-0790(A), 099.C-0127(B) and 099.C-0601(A).
Appendix A Radial profiles
A.1 VBB data
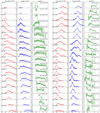 |
Fig. A.1 Radial surface brightness profiles for Qϕ (red), StokesI (blue), and the degree of polarization Qϕ∕I (green) atseveral different position angles for the ZIMPOL VBB observations. The intensity values on the vertical axis are in units of surface brightness relative to the total intensity of the system, i.e., [Itotal ∕arcsec2]. |
A.2 H-band data
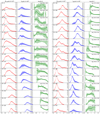 |
Fig. A.2 Radial surface brightness profiles for Qϕ (red), StokesI (blue), and the degree of polarization Qϕ∕I (green) at several different position angles for the IRDIS H-band observations. The intensity values on the vertical axis are in units of surface brightness relative to the total intensity of the system, i.e., [Itotal∕arcsec2]. |
References
- Avenhaus, H., Quanz, S. P., Schmid, H. M., et al. 2014, ApJ, 781, 87 [Google Scholar]
- Avenhaus, H., Quanz, S. P., Schmid, H. M., et al. 2017, AJ, 154, 33 [Google Scholar]
- Avenhaus, H., Quanz, S. P., Garufi, A., et al. 2018, ApJ, 863, 44 [Google Scholar]
- Beuzit, J. L., Vigan, A., Mouillet, D., et al. 2019, A&A, 631, A155 [NASA ADS] [CrossRef] [EDP Sciences] [Google Scholar]
- Biller, B., Lacour, S., Juhász, A., et al. 2012, ApJ, 753, L38 [Google Scholar]
- Canovas, H., Ménard, F., Hales, A., et al. 2013, A&A, 556, A123 [NASA ADS] [CrossRef] [EDP Sciences] [Google Scholar]
- Canovas, H., Ménard, F., Hales, A., et al. 2014, in Rev. Mex. Astron. Astrofis. Conf. Ser., 44, 4 [Google Scholar]
- Cantalloube, F., Dohlen, K., Milli, J., Brandner, W., & Vigan, A. 2019, Messenger, 176, 25 [Google Scholar]
- Casassus, S., Hales, A., de Gregorio, I., et al. 2013, A&A, 553, A64 [NASA ADS] [CrossRef] [EDP Sciences] [Google Scholar]
- Casassus, S., Marino, S., Pérez, S., et al. 2015, ApJ, 811, 92 [Google Scholar]
- Claudi, R., Maire, A. L., Mesa, D., et al. 2019, A&A, 622, A96 [NASA ADS] [CrossRef] [EDP Sciences] [Google Scholar]
- Comerón, F. 2008, The Lupus Clouds, ed. B. Reipurth, 5, 295 [Google Scholar]
- Cutri, R. M., Skrutskie, M. F., van Dyk, S., et al. 2003, 2MASS All Sky Catalog of Point Sources [Google Scholar]
- de Boer, J., Langlois, M., van Holstein, R. G., et al. 2020, A&A, 633, A63 [NASA ADS] [CrossRef] [EDP Sciences] [Google Scholar]
- Debes, J. H., Jang-Condell, H., Weinberger, A. J., Roberge, A., & Schneider, G. 2013, ApJ, 771, 45 [Google Scholar]
- Dohlen, K., Langlois, M., Saisse, M., et al. 2008, in Ground-based and Airborne Instrumentation for Astronomy II, SPIE Conf. Ser., 7014, 70143L [Google Scholar]
- Dominik, C., Dullemond, C. P., Waters, L. B. F. M., & Walch, S. 2003, A&A, 398, 607 [NASA ADS] [CrossRef] [EDP Sciences] [Google Scholar]
- Duchêne, G., McCabe, C., Ghez, A. M., & Macintosh, B. A. 2004, ApJ, 606, 969 [Google Scholar]
- Fujiwara, H., Honda, M., Kataza, H., et al. 2006, ApJ, 644, L133 [Google Scholar]
- Fukagawa, M., Tamura, M., Itoh, Y., et al. 2006, ApJ, 636, L153 [Google Scholar]
- Fukagawa, M., Tsukagoshi, T., Momose, M., et al. 2013, PASJ, 65, L14 [Google Scholar]
- Gaia Collaboration 2018, VizieR Online Data Catalog, I/345 [Google Scholar]
- Garufi, A., Benisty, M., Stolker, T., et al. 2017, Messenger, 169, 32 [Google Scholar]
- Gontcharov, G. A., & Mosenkov, A. V. 2019, MNRAS, 483, 299 [Google Scholar]
- Hashimoto, J., Tamura, M., Muto, T., et al. 2011, ApJ, 729, L17 [NASA ADS] [CrossRef] [Google Scholar]
- Hodapp, K. W., Suzuki, R., Tamura, M., et al. 2008, HiCIAO: the Subaru Telescope’s new high-contrast coronographic imager for adaptive optics, SPIE Conf. Ser., 7014, 701419 [Google Scholar]
- Høg, E., Fabricius, C., Makarov, V. V., et al. 2000, A&A, 355, L27 [Google Scholar]
- Honda, M., Inoue, A. K., Fukagawa, M., et al. 2009, ApJ, 690, L110 [Google Scholar]
- Hunziker, S., Schmid, H. M., Mouillet, D., et al. 2020, A&A, 634, A69 [CrossRef] [EDP Sciences] [Google Scholar]
- Malfait, K., Bogaert, E., & Waelkens, C. 1998, A&A, 331, 211 [NASA ADS] [Google Scholar]
- Malfait, K., Waelkens, C., Bouwman, J., de Koter, A., & Waters, L. B. F. M. 1999, A&A, 345, 181 [NASA ADS] [Google Scholar]
- Marino, S., Perez, S., & Casassus, S. 2015, ApJ, 798, L44 [NASA ADS] [CrossRef] [Google Scholar]
- Min, M., Bouwman, J., Dominik, C., et al. 2016a, A&A, 593, A11 [NASA ADS] [CrossRef] [EDP Sciences] [Google Scholar]
- Min, M., Rab, C., Woitke, P., Dominik, C., & Ménard, F. 2016b, A&A, 585, A13 [NASA ADS] [CrossRef] [EDP Sciences] [Google Scholar]
- Monnier, J. D., Harries, T. J., Aarnio, A., et al. 2017, ApJ, 838, 20 [Google Scholar]
- Monnier, J. D., Harries, T. J., Bae, J., et al. 2019, ApJ, 872, 122 [Google Scholar]
- Mulders, G. D., Min, M., Dominik, C., Debes, J. H., & Schneider, G. 2013, A&A, 549, A112 [NASA ADS] [CrossRef] [EDP Sciences] [Google Scholar]
- Pavlov, A., Möller-Nilsson, O., Feldt, M., et al. 2008, in Advanced Software and Control for Astronomy II, Proc. SPIE, 7019, 701939 [Google Scholar]
- Perez, S., Casassus, S., Ménard, F., et al. 2015, ApJ, 798, 85 [Google Scholar]
- Perrin, M. D., Schneider, G., Duchene, G., et al. 2009, ApJ, 707, L132 [Google Scholar]
- Perrin, M. D., Duchene, G., Millar-Blanchaer, M., et al. 2015, ApJ, 799, 182 [Google Scholar]
- Pinte, C., Padgett, D. L., Ménard, F., et al. 2008, A&A, 489, 633 [NASA ADS] [CrossRef] [EDP Sciences] [Google Scholar]
- Pottasch, S. R., & Parthasarathy, M. 1988, A&A, 192, 182 [NASA ADS] [Google Scholar]
- Price, D. J., Cuello, N., Pinte, C., et al. 2018, MNRAS, 477, 1270 [Google Scholar]
- Quanz, S. P., Schmid, H. M., Geissler, K., et al. 2011, ApJ, 738, 23 [Google Scholar]
- Rizzo, J. R., Morras, R., & Arnal, E. M. 1998, MNRAS, 300, 497 [NASA ADS] [CrossRef] [Google Scholar]
- Roddier, F., Roddier, C., Graves, J. E., & Northcott, M. J. 1995, ApJ, 443, 249 [Google Scholar]
- Rosenfeld, K. A., Chiang, E., & Andrews, S. M. 2014, ApJ, 782, 62 [Google Scholar]
- Sauvage, J.-F., Fusco, T., Guesalaga, A., et al. 2015, in Adaptive Optics for Extremely Large Telescopes IV (AO4ELT4), E9 [Google Scholar]
- Schmid, H. M., Joos, F., & Tschan, D. 2006, A&A, 452, 657 [NASA ADS] [CrossRef] [EDP Sciences] [Google Scholar]
- Schmid, H. M., Bazzon, A., Roelfsema, R., et al. 2018, A&A, 619, A9 [NASA ADS] [CrossRef] [EDP Sciences] [Google Scholar]
- Serkowski, K., Mathewson, D. S., & Ford, V. L. 1975, ApJ, 196, 261 [NASA ADS] [CrossRef] [Google Scholar]
- Silber, J., Gledhill, T., Duchêne, G., & Ménard, F. 2000, ApJ, 536, L89 [Google Scholar]
- Sissa, E., Gratton, R., Garufi, A., et al. 2018, A&A, 619, A160 [NASA ADS] [CrossRef] [EDP Sciences] [Google Scholar]
- Stolker, T., Dominik, C., Avenhaus, H., et al. 2016, A&A, 595, A113 [NASA ADS] [CrossRef] [EDP Sciences] [Google Scholar]
- Takami, M., Hasegawa, Y., Muto, T., et al. 2014, ApJ, 795, 71 [Google Scholar]
- Tanii, R., Itoh, Y., Kudo, T., et al. 2012, PASJ, 64, 124 [NASA ADS] [Google Scholar]
- van Holstein, R. G., Snik, F., Girard, J. H., et al. 2017, in SPIE Conf. Ser., 10400, 1040015 [Google Scholar]
- van Holstein, R. G., Girard, J. H., de Boer, J., et al. 2020, A&A, 633, A64 [NASA ADS] [CrossRef] [EDP Sciences] [Google Scholar]
- van Holstein, R. G., Stolker, T., Jensen-Clem, R., et al. 2021, A&A, 647, A21 [EDP Sciences] [Google Scholar]
- Verhoeff, A. P., Min, M., Pantin, E., et al. 2011, A&A, 528, A91 [NASA ADS] [CrossRef] [EDP Sciences] [Google Scholar]
- Woitke, P., Min, M., Pinte, C., et al. 2016, A&A, 586, A103 [NASA ADS] [CrossRef] [EDP Sciences] [Google Scholar]
The planets orbiting HR8799 are too faint compared to the bright disk in HD 142527 to interfere with the analysis, and their signals are additionally suppressed by the RDI process.
Assuming pmax to be located at wavelength λmax = 545 nm and K = 1.15.
We use the tilde to indicate that a value is affected by PSF smearing. Whenever the symbol is not used for a measurement, the value is already corrected for PSF smearing.
Estimated through the difference in brightness difference between HD 142527 and the observed reference star and the different exposure times.
All Tables
All Figures
|
Fig. 1 Normalized PSFs of HD 142527 for the ZIMPOL VBB and IRDIS H-band normalized to a total count level of 106 within an aperture diameter of 3 arcsec. The bump at ~0.08′′ in the H-band PSF is caused by the low-wind effect. The locations of the AO control rings and the disk are indicated. |
| In the text | |
|
Fig. 2 Polarized intensity Qϕ and total intensity I signal of the disk around HD 142527 for the non-coronagraphic VBB and the coronagraphic H-band observations. The scale for the size and orientation for all images is shown in the bottom left image. The position of the star is marked with a cross. The color scales are in counts per DIT. The VBB Stokes I image in the top right frame is scaled with r2.75 (r is the distance from the star) to improve the visibility of the disk, and therefore no color scale is given. The bright point-like spots in the same image are ghost images of the star that are produced by the instrument. |
| In the text | |
|
Fig. 3 Simulated Qϕ disk signal for an azimuthally symmetric disk with pdisk = 20%, illustrating the effect of polarimetric normalization for a star with very strong (10–40 times stronger than estimated for HD 142527) intrinsic polarization of 5% (left) and 20% (right) with φ⋆ = 45°. |
| In the text | |
|
Fig. 4 HD 142527 Qϕ image of the outer disk in H-band with IRDIS. The two yellow circles at 0.6′′ and 1.75′′ indicate the annulus aperture we used to measure the total disk intensity. A white disk with radius 0.2′′ covers the inner part of the image, which is dominated by residuals from speckles and from the coronagraph. The position of the star behind the disk is marked with a cross. The dashed line indicates the approximate direction of the disk major axis at a position angle of − 20°. The scale isin counts for a 16 s DIT. North is up and east is to the left. The features to the southwest of the disk originate from defects on the IRDIS detector. |
| In the text | |
|
Fig. 5 Simulated radial profiles for Qϕ (red) and Stokes I (blue) and the degree of polarization Qϕ∕I (green) convolved with the IRDIS H-band PSF. The black curves show the initial model profiles of the disk before the convolution. The convolved profiles roughly correspond to the disk measurements at position angle 200° (see Fig. 8, bottom). The radially integrated mean disk intensities and the relative lost intensity (rel. error) were calculated for both profiles between the cross-hatched areas. |
| In the text | |
|
Fig. 6 Measured radial polarized intensity profile from the HD 142527 IRDIS data in H-band (blue crosses) at a position angle of 200°. The solid red line was fit through the data points in the cross-hatched areas. We consider this as the zero line for the polarized surface brightness radial profiles. |
| In the text | |
|
Fig. 7 Measured radial intensity profiles of HD 142527 for the ZIMPOL VBB and the IRDIS H-band data (blue crosses) at a position angle of 200° compared tothe mean of the best-fitting radial profiles from the reference data (solid red line). The shaded red area shows the 1σ spread of the reference profiles. All reference profiles were fit only in the cross-hatched areas to the HD 142527 data to avoid fittingand subtracting the disk signal. |
| In the text | |
|
Fig. 8 Radial profiles for Qϕ (red), StokesI (blue), and the degree of polarization Qϕ∕I (green) at a position angle of 200° for the ZIMPOL VBB observations (top) and for the IRDIS H-band observations (bottom). The intensity values on the vertical axis are in units of surface brightness relative to the total intensity of the system, i.e., [Itotal∕arcsec2]. For the degree of polarization, only the values inside the cross-hatched boundaries with <0.5 error are shown in the plot to improve the visibility. |
| In the text | |
|
Fig. 9 Polarized intensity of HD 142527 in the VBB (a) and H-band (b) and the corresponding surface brightness Ĩdisk(φ), maximum polarized surface brightness |
| In the text | |
|
Fig. 10 Comparison of PSF-convolved model calculation for the radial profiles of
|
| In the text | |
|
Fig. 11 Disk model geometry for HD 142527 for the vertical plane along the minor axis with the location of the visible part of the reflecting disk surface (solid white line). The color scale illustrates the adapted disk volume density model of Marino et al. (2015). The disk midplane (dashed white line) is inclined by 20° toward the observer. The dotted lines indicate the location of the steep wall on the far side of the disk between 0.7′′ and 1.0′′ where the approximation of the disk wall by a plane-parallel surface is expected to be quite good. |
| In the text | |
|
Fig. 12 Wavelength dependence of the measured relative intensities Idisk∕Itotal and polarized intensities Qϕ,disk∕Itotal for the scattered light from the disk in HD 142527. The colored symbols are from Table 3, the values marked with (F06) from Fukagawa et al. (2006) and (A14) from Avenhaus et al. (2014). The values (H09) from Honda et al. (2009) are given in an inset with an arbitrary scale factor to offset them from the other data because these are relative measurements for an area at the southwest rim of the disk. |
| In the text | |
|
Fig. A.1 Radial surface brightness profiles for Qϕ (red), StokesI (blue), and the degree of polarization Qϕ∕I (green) atseveral different position angles for the ZIMPOL VBB observations. The intensity values on the vertical axis are in units of surface brightness relative to the total intensity of the system, i.e., [Itotal ∕arcsec2]. |
| In the text | |
|
Fig. A.2 Radial surface brightness profiles for Qϕ (red), StokesI (blue), and the degree of polarization Qϕ∕I (green) at several different position angles for the IRDIS H-band observations. The intensity values on the vertical axis are in units of surface brightness relative to the total intensity of the system, i.e., [Itotal∕arcsec2]. |
| In the text | |
Current usage metrics show cumulative count of Article Views (full-text article views including HTML views, PDF and ePub downloads, according to the available data) and Abstracts Views on Vision4Press platform.
Data correspond to usage on the plateform after 2015. The current usage metrics is available 48-96 hours after online publication and is updated daily on week days.
Initial download of the metrics may take a while.