Fig. 8
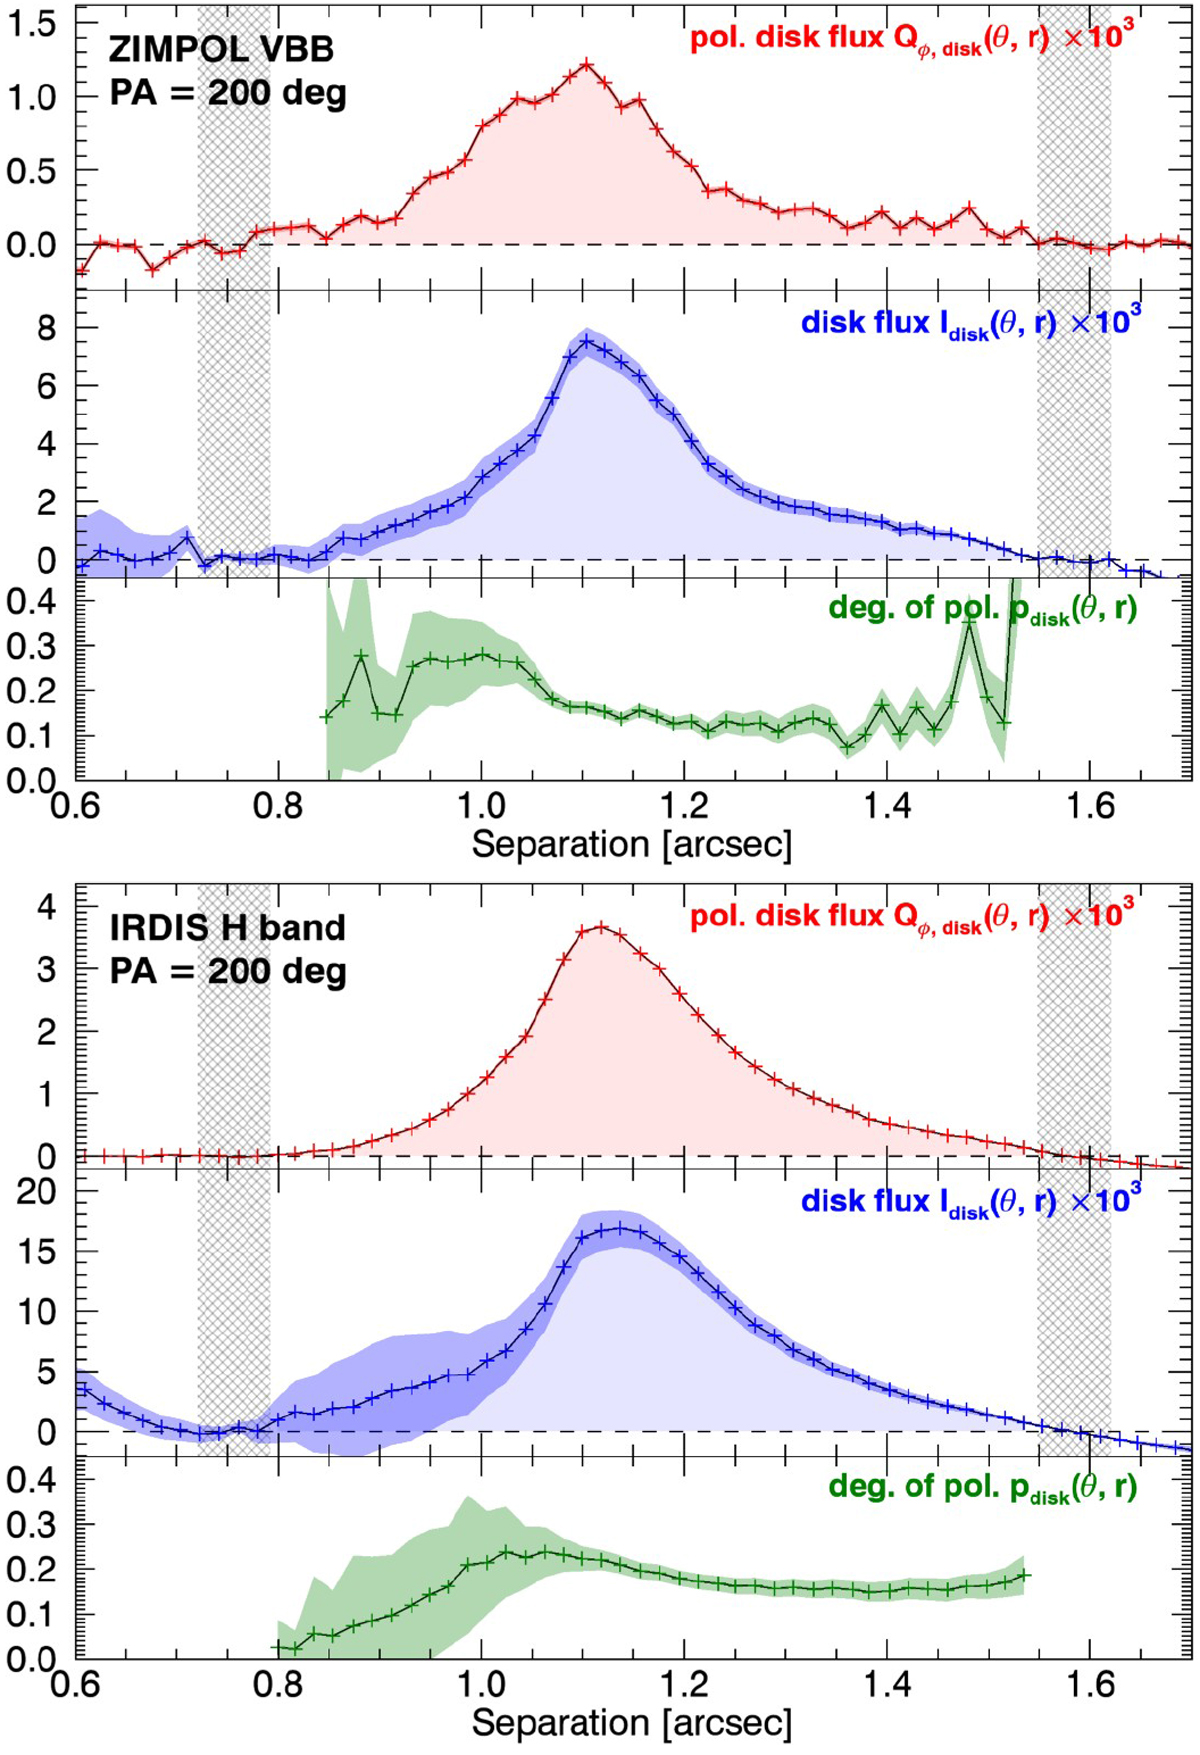
Radial profiles for Qϕ (red), StokesI (blue), and the degree of polarization Qϕ∕I (green) at a position angle of 200° for the ZIMPOL VBB observations (top) and for the IRDIS H-band observations (bottom). The intensity values on the vertical axis are in units of surface brightness relative to the total intensity of the system, i.e., [Itotal∕arcsec2]. For the degree of polarization, only the values inside the cross-hatched boundaries with <0.5 error are shown in the plot to improve the visibility.
Current usage metrics show cumulative count of Article Views (full-text article views including HTML views, PDF and ePub downloads, according to the available data) and Abstracts Views on Vision4Press platform.
Data correspond to usage on the plateform after 2015. The current usage metrics is available 48-96 hours after online publication and is updated daily on week days.
Initial download of the metrics may take a while.