Fig. 2
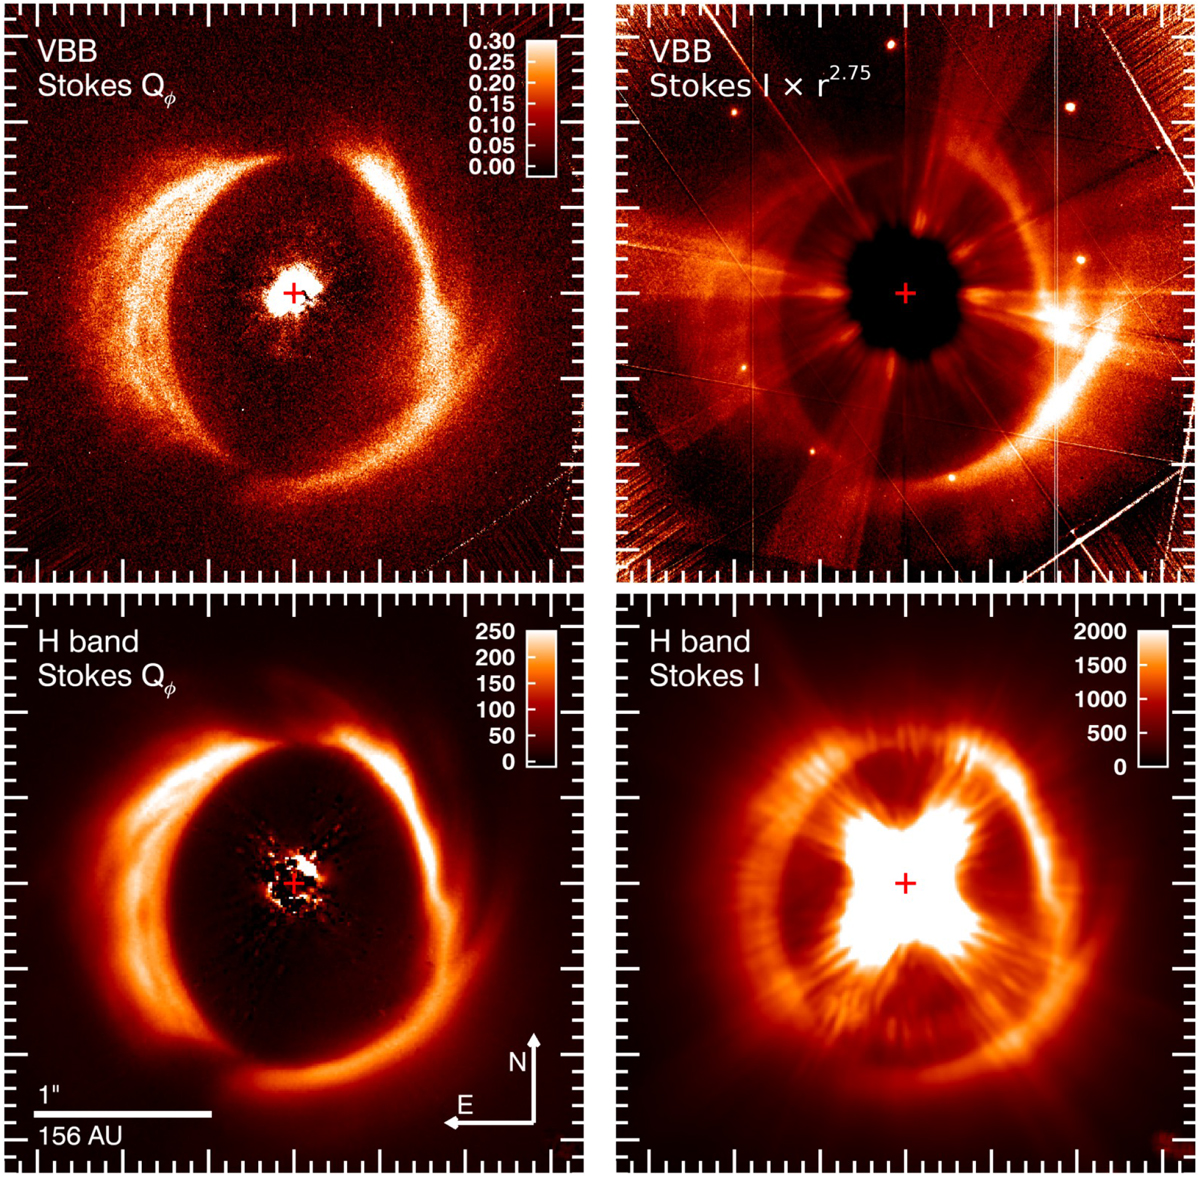
Polarized intensity Qϕ and total intensity I signal of the disk around HD 142527 for the non-coronagraphic VBB and the coronagraphic H-band observations. The scale for the size and orientation for all images is shown in the bottom left image. The position of the star is marked with a cross. The color scales are in counts per DIT. The VBB Stokes I image in the top right frame is scaled with r2.75 (r is the distance from the star) to improve the visibility of the disk, and therefore no color scale is given. The bright point-like spots in the same image are ghost images of the star that are produced by the instrument.
Current usage metrics show cumulative count of Article Views (full-text article views including HTML views, PDF and ePub downloads, according to the available data) and Abstracts Views on Vision4Press platform.
Data correspond to usage on the plateform after 2015. The current usage metrics is available 48-96 hours after online publication and is updated daily on week days.
Initial download of the metrics may take a while.