Fig. 9
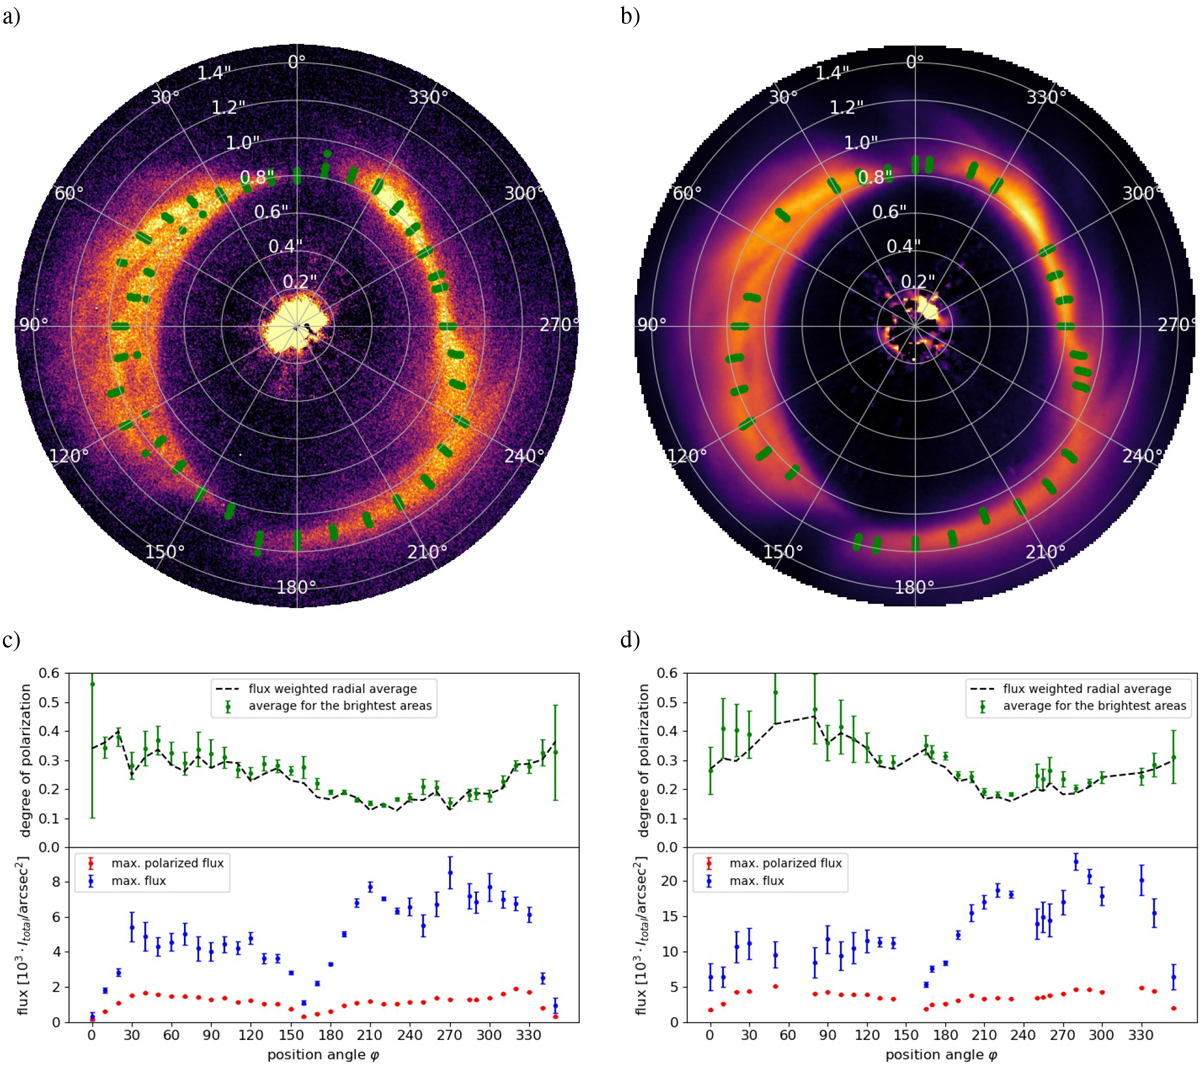
Polarized intensity of HD 142527 in the VBB (a) and H-band (b) and the corresponding surface brightness Ĩdisk(φ), maximum polarized surface brightness ![]() and degree of polarization pdisk(φ) in (c) and (d), respectively. The azimuthal surface brightness profiles in (c) and (d) show theaverage surface brightness for the four brightest values (indicated by the green dots in (a) and (b)) in each radial profile (see Appendix A). The values are not corrected for signal loss due to PSF smearing. The plots for the azimuthal degree of polarization also show the degree of polarization at the positions where the highest surface brightness was measured (green dots), and additionally show the intensity-weighted average polarization for the complete radial profiles (dashed line).
and degree of polarization pdisk(φ) in (c) and (d), respectively. The azimuthal surface brightness profiles in (c) and (d) show theaverage surface brightness for the four brightest values (indicated by the green dots in (a) and (b)) in each radial profile (see Appendix A). The values are not corrected for signal loss due to PSF smearing. The plots for the azimuthal degree of polarization also show the degree of polarization at the positions where the highest surface brightness was measured (green dots), and additionally show the intensity-weighted average polarization for the complete radial profiles (dashed line).
Current usage metrics show cumulative count of Article Views (full-text article views including HTML views, PDF and ePub downloads, according to the available data) and Abstracts Views on Vision4Press platform.
Data correspond to usage on the plateform after 2015. The current usage metrics is available 48-96 hours after online publication and is updated daily on week days.
Initial download of the metrics may take a while.