Fig. 5
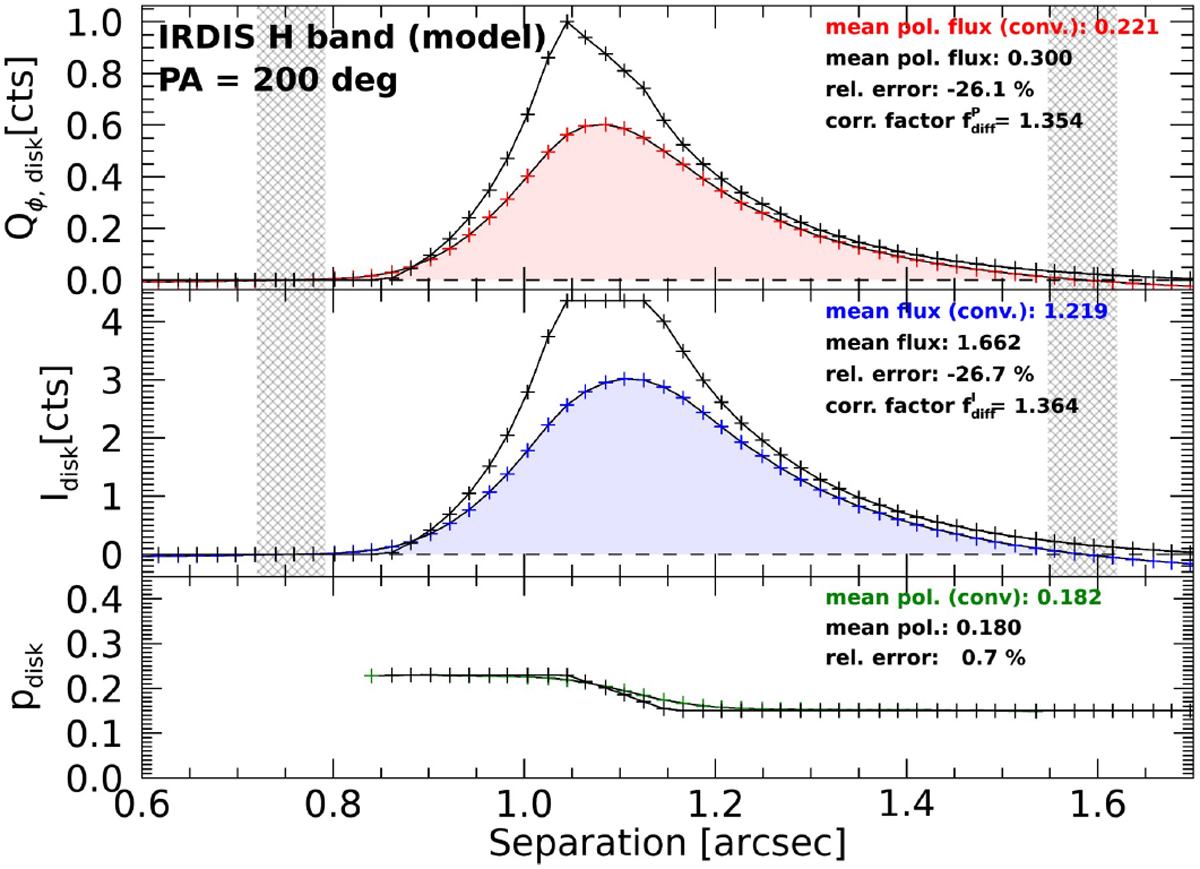
Simulated radial profiles for Qϕ (red) and Stokes I (blue) and the degree of polarization Qϕ∕I (green) convolved with the IRDIS H-band PSF. The black curves show the initial model profiles of the disk before the convolution. The convolved profiles roughly correspond to the disk measurements at position angle 200° (see Fig. 8, bottom). The radially integrated mean disk intensities and the relative lost intensity (rel. error) were calculated for both profiles between the cross-hatched areas.
Current usage metrics show cumulative count of Article Views (full-text article views including HTML views, PDF and ePub downloads, according to the available data) and Abstracts Views on Vision4Press platform.
Data correspond to usage on the plateform after 2015. The current usage metrics is available 48-96 hours after online publication and is updated daily on week days.
Initial download of the metrics may take a while.