| Issue |
A&A
Volume 635, March 2020
|
|
|---|---|---|
| Article Number | A47 | |
| Number of page(s) | 15 | |
| Section | Extragalactic astronomy | |
| DOI | https://doi.org/10.1051/0004-6361/201936434 | |
| Published online | 04 March 2020 | |
AGN feedback in a galaxy merger: multi-phase, galaxy-scale outflows with a fast molecular gas blob ∼6 kpc away from IRAS F08572+3915⋆
1
Astronomy Department, Universidad de Concepción, Av. Esteban Iturra s/n Barrio Universitario, Casilla 160, Concepción, Chile
e-mail: This email address is being protected from spambots. You need JavaScript enabled to view it.
2
Max-Planck-Institute for Extraterrestrial Physics (MPE), Gießenbachstraße 1, 85748 Garching, Germany
3
NOVA Optical Infrared Instrumentation Group at ASTRON, PO Box 2, 7990 AA Dwingeloo, The Netherlands
4
Department of Astronomy and Joint Space-Science Institute, Univ. of Maryland, College Park, MD 20742, USA
5
Institute of Astronomy and Kavli Institute for Cosmology Cambridge, University of Cambridge, Cambridge, UK
6
Space Telescope Science Institute, Baltimore, MD 21218, USA
7
Departamento de Física y Matemáticas, Univ. de Alcalá, Campus Universitario, 28871 Alcalá de Henares, Spain
8
Department of Physics, Rhodes College, Memphis, TN 38112, USA
9
INAF – Osservatorio Astronomico di Brera, Via Brera 28, 20121 Milano, Italy
Received:
1
August
2019
Accepted:
13
November
2019
Abstract
To understand the role that active galactic nuclei (AGN) feedback plays in galaxy evolution, we need in-depth studies of the multi-phase structure and energetics of galaxy-wide outflows. In this work, we present new, deep (∼50 h) NOEMA CO(1-0) line observations of the molecular gas in the powerful outflow driven by the AGN in the ultra-luminous infrared galaxy IRAS F08572+3915. We spatially resolve the outflow, finding that its most likely configuration is a wide-angle bicone aligned with the kinematic major axis of the rotation disk. The molecular gas in the wind reaches velocities up to approximately ±1200 km s−1 and transports nearly 20% of the molecular gas mass in the system. We detect a second outflow component located ∼6 kpc northwest from the galaxy moving away at ∼900 km s−1, which could be the result of a previous episode of AGN activity. The total mass and energetics of the outflow, which includes contributions from the ionized, neutral, and warm and cold molecular gas phases, is strongly dominated by the cold molecular gas. In fact, the molecular mass outflow rate is higher than the star formation rate, even if we only consider the gas in the outflow that is fast enough to escape the galaxy, which accounts for ∼40% of the total mass of the outflow. This results in an outflow depletion time for the molecular gas in the central ∼1.5 kpc region of only ∼3 Myr, a factor of ∼2 shorter than the depletion time by star formation activity.
Key words: galaxies: active / galaxies: interactions / galaxies: evolution / galaxies: starburst / ISM: jets and outflows
A copy of the reduced datacube is available at the CDS via anonymous ftp to cdsarc.u-strasbg.fr (130.79.128.5) or via http://cdsarc.u-strasbg.fr/viz-bin/cat/J/A+A/635/A47
© ESO 2020
1. Introduction
Galaxy outflows are practically ubiquitous in the most luminous systems of our nearby universe (e.g., Heckman et al. 2000; Rupke et al. 2005; Veilleux et al. 2013; González-Alfonso et al. 2017; Pereira-Santaella et al. 2018). These outflows encompass multiple gas phases (e.g., Rupke & Veilleux 2013a; Morganti et al. 2013; Feruglio et al. 2015; Fiore et al. 2017), they are typically fast (v ≳ 1000 km s−1), and they can extend over kiloparsec scales. Their properties make them natural candidates for the source of negative feedback required by theoretical models and numerical simulations to quench star formation activity, transforming blue, star-forming galaxies into “red and dead” systems (e.g., Di Matteo et al. 2005; Hopkins & Beacom 2006).
While outflow feedback is acknowledged as an important process, the actual physical mechanisms involved are still poorly understood. Part of the problem is our limited knowledge of the fundamental properties of the outflowing gas, such as geometry, multiphase structure, and physical conditions (for a discussion, see Harrison et al. 2018). For example, knowledge of the ionized gas density in the outflow is required to convert Hα or [O III] line luminosities associated with the outflow into ionized gas masses. Electron densities in the outflowing gas around ne ∼ 102 cm−3 are typically assumed, although recent studies suggest that the density could be much higher (ne ∼ 103 − 105 cm−3; e.g., Santoro et al. 2018; Förster Schreiber et al. 2019; Baron & Netzer 2019; Shimizu et al. 2019; Ramos Almeida et al. 2019), resulting in lower outflow ionized gas masses by up to two or three orders of magnitude. For the molecular phase, studies based on CO lines require an αCO factor to convert CO(1-0) luminosities into H2 molecular gas masses. αCO can vary by a factor of ∼10 depending whether the gas is optically-thin or exposed to Galactic excitation conditions. Observational studies tend to favor αCO values for molecular outflows between the optically-thin limit (e.g., Dasyra et al. 2016), and two to three times the value adopted for ultra-luminous infrared galaxies (ULIRG) (e.g., Aalto et al. 2015; Leroy et al. 2015; Walter et al. 2017; Cicone et al. 2018a; Lutz et al. 2020).
Once the outflow gas mass in a given phase is measured, the shape, size, and velocity of the outflow are required to calculate the mass outflow rate. This represents another major obstacle as many times observations lack the angular resolution needed to determine the extent and velocity structure of the gas. A common approach to measuring mass outflow rates is to assume a spherical or bi-cone geometry with constant velocity. Depending on whether the outflow gas forms a “thin shell” (e.g., Rupke et al. 2005) or is filled with constant density (e.g., Maiolino et al. 2012) the mass outflow rate can differ by a factor of three. For a recent discussion on the different ways to measure mass outflow rates depending on the outflow history, see Lutz et al. (2020).
Finally, the multiphase nature of galactic outflows implies that measurements of the outflow properties based on a single gas phase can lead to misleading conclusions (for a discussion, see e.g., Cicone et al. 2018b). Historically, systematic studies of galactic outflows in nearby and high-z galaxies have focused on the ionized gas – for example, as observed as broad wing emission in the spectra of the Hα, [O III] or Paα lines – (e.g., Heckman et al. 1990; Rupke & Veilleux 2013a; Woo et al. 2016; Harrison et al. 2016; Förster Schreiber et al. 2019; Ramos Almeida et al. 2019) and the atomic phase – based on the Na D or Mg II lines in absorption (e.g., Heckman et al. 2000; Rupke et al. 2002, 2005; Weiner et al. 2009; Roberts-Borsani & Saintonge 2019). The molecular component of outflows, on the other hand, has been much more difficult to study. Great progress was made with the Herschel Space Observatory using the OH 119 μm line in absorption to study molecular outflows in Seyfert and luminous infrared galaxies (Fischer et al. 2010; Sturm et al. 2011; Veilleux et al. 2013; Bolatto et al. 2013; Spoon et al. 2013; George et al. 2014; Stone et al. 2016; González-Alfonso et al. 2017; Zhang et al. 2018). More recently, the advent of powerful millimeter-wave interferometers such as the Atacama Large Millimeter/submillimeter Array (ALMA) and the NOrthern Extended Millimeter Array (NOEMA) are rapidly increasing the number of molecular outflows detected based on observations of the CO line (e.g., Combes et al. 2013; Sakamoto et al. 2014; García-Burillo et al. 2014; Leroy et al. 2015; Feruglio et al. 2015; Morganti et al. 2015; Dasyra et al. 2016; Pereira-Santaella et al. 2016, 2018; Veilleux et al. 2017; Fluetsch et al. 2019; Lutz et al. 2020). At high-z, so far only a handful of large-scale, molecular outflows have been studied in QSOs (e.g., Cicone et al. 2015; Vayner et al. 2017; Feruglio et al. 2017; Carniani et al. 2017; Fan et al. 2018; Brusa et al. 2018), sub-millimeter galaxies (e.g., Spilker et al. 2018), and main-sequence, star-forming galaxies (e.g., Herrera-Camus et al. 2019).
To understand the existence of kpc-scale molecular outflows produced by active galactic nuclei (AGN), we must first look at the small-scale, mildly relativistic (∼0.1 − 0.3c) wind driven by AGN radiation pressure (e.g., King & Pounds 2003; Tombesi et al. 2015). This nuclear wind may violently collide with the surrounding interstellar medium (ISM), producing an inner reverse shock that propagates in the rarefied medium and an outer forward-moving shock. For an energy conserving outflow, the shocked gas do not cool, and expands adiabatically. As a consequence, the bulk of the kinetic energy of the wind is transferred to the outflowing gas, which can then expand to reach galaxy-wide scales (e.g., Faucher-Giguère & Quataert 2012; Zubovas & King 2012; Costa et al. 2014).
The fact that most of the mass in large-scale outflows is in the cold, molecular phase (e.g., Morganti et al. 2005; Fiore et al. 2017; Herrera-Camus et al. 2019) is still a matter of study. One alternative is that a large portion of the hot, outflowing gas is converted into molecular gas owing to efficient radiative cooling (e.g., Zubovas & King 2014; Richings & Faucher-Giguère 2018; Schneider et al. 2018). The other alternative is that cold clouds are driven out of the host galaxy by either thermal-gas ram pressure (e.g., Tadhunter et al. 2014; Hopkins et al. 2012) or radiation pressure from the hotter, outflowing material (e.g., Murray et al. 2011; Zhang & Thompson 2012).
Characterizing the molecular content of outflows is of major importance as molecular gas is the fuel for star formation; thus, ejecting a portion of the molecular gas from the nuclear regions can have a strong impact on their star formation activity.
To quantify the impact of AGN-feedback on galaxy evolution we require a detailed characterization of the multi-phase structure and energetics of outflows, which, in turn requires in-depth studies that minimize the assumptions typically made to estimate key outflow properties, such as the mass outflow rate. In that spirit, we present deep NOEMA CO(1-0) line observations of the molecular gas in the outflow in the ultra-luminous infrared galaxy (ULIRG) IRAS F08572+3915. These new observations, which achieve an angular resolution a factor of ∼2 better compared to previous studies (Cicone et al. 2014), improve our constraints on the size, geometry, and velocity structure of the outflow, leading to a more reliable measurement of the outflow energetics. Combined with estimates of the outflow properties from other phases (warm molecular, ionized, and atomic), here we present one of the few multi-phase views available of an AGN-driven outflow (for additional examples see Veilleux et al. 2013; Tombesi et al. 2015, 2017; Feruglio et al. 2015; Rupke et al. 2017).
IRAS F08572+3915 is a low redshift (z = 0.0582) ULIRG (LIR, 8 − 1000 μm = 1.4 × 10¹² L⊙; Veilleux et al. 2013) composed of two interacting spiral galaxies with a separation of about ∼5 kpc. Figure 1 shows an HST (F814W) image of the interacting pair and the circumgalactic material around them. The galaxy located in the northwest (NW) quadrant has a stellar mass of M⋆ ≈ 3 × 10¹⁰ M⊙ yr−1 (Rodríguez Zaurín et al. 2009) and is ∼2.5 magnitudes brighter in K-band than its southwest companion (Scoville et al. 2000). Thus, we will refer to this galaxy as the main galaxy in the system.
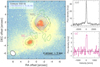 |
Fig. 1. Left: HST (F814W) image of the ULIRG IRAS F08572+3915. The system is composed of a pair of interacting galaxies where the energetics are dominated by a buried AGN in the NW system (Rupke & Veilleux 2013a). The contours show continuum-subtracted CO(1-0) emission detected at a 3σ significance or above in the intensity maps integrated in the [−120,+120] km s−1 (green) and [−400,+400] km s−1 (purple) velocity range. The NOEMA synthesized beam (θ = 1.4″ × 1.13″) is illustrated in the bottom-left corner. The angular resolution achieved is a factor of ∼2 better than previous CO(1-0) observations (Cicone et al. 2014). Right: CO(1-0) spectra of the NW (top) and SE (bottom) galaxies extracted within the circular apertures shown in the left panel. This is the first time the SE component is detected in CO emission. |
IRAS F08572+3915 is a key example of a deeply dust-obscured ULIRG with strong mid-infrared silicate absorption (e.g., Dudley & Wynn-Williams 1997; Spoon et al. 2007). Thus, it is not surprising that strong evidence for AGN activity in the system is only found at infrared wavelengths (Imanishi 2002; Imanishi et al. 2006; Armus et al. 2007). The system is only marginally detected in soft X-rays (Teng et al. 2009) and undetected in hard X-rays (Teng et al. 2015). Previous optically-based classifications of LINER (Veilleux et al. 1999) or Seyfert 2 were carried out on the basis of shallow spectra that shows no clear detection of neither the [O III] 5007 Å nor Hβ lines.
Assuming spherical symmetry, Veilleux et al. (2013) estimate that the fraction of the bolometric luminosity of the galaxy (Lbol = 1.15 LIR) produced by the AGN is αAGN = 0.74, which implies an AGN bolometric luminosity of LAGN, bol = αAGN × Lbol = 1.1 × 10¹² L⊙, a starburst luminosity of LSB = (1 − αAGN)×LIR = 4.7 × 10¹¹ L⊙, and a star formation rate (SFR) of 69 M⊙ yr−1 (based on the SFR − LIR calibration by Murphy et al. 2011). This places the main galaxy in IRAS F08572+3915 in the SFR − M⋆ plane a factor of ∼25 above the main-sequence of galaxies at similar redshift (Whitaker et al. 2012).
Throughout this paper, we adopt a cosmology with H0 = 70 km s−1 Mpc−1 and ΩM = 0.3, which results in a luminosity distance DL = 262 Mpc and a scale of 1.21 kpc/″ for a source at z = 0.0582.
2. Observations and data reduction
In total, there have been three IRAM NOEMA (formerly Plateau de Bure Interferometer) observing programs that target the CO(1-0) outflow in IRAS F08572+3915. Table 1 lists observing dates, configuration, number of antennas, and on-source time for these programs. The C+D only data (project v026) was already presented in Cicone et al. (2014). The WideX observations have a bandwidth of 3.6 GHz (corresponding to 9884 km s−1 at the observed frequency of 108.93 GHz) and a resolution of 1.95 MHz (corresponding to 5.35 km s−1).
Details of the NOEMA observations.
The data were calibrated in CLIC with help from the staff in Grenoble. After calibration, separate uv tables were created for the configuration C+D, A+B, and A+B+C+D observations. We then used the software MAPPING21 for cleaning and imaging in the uv-plane. The synthesized beam size is 2.95″ × 2.56″ with a Position Angle of 61° for the C+D configuration, 1.08″ × 0.82″ with a PA of 34° for the A+B configuration, and 1.4″ × 1.13″ with a PA of 43° for the A+B+C+D configuration. This is a factor of ∼2 higher angular resolution than that achieved in the IRAM Plateau de Bure Interferometer (PdBI) observations reported in Cicone et al. (2014). Configuration A+B+C+D observations will be used for further analysis because of the high level of sensitivity. The data were binned in 40 km s−1, which balances a good signal-to-noise ratio (S/N) and spectral resolution. The continuum is taken to be the average over the velocity range −3500 km s−1 to −2000 km s−1, and 2000 km s−1 to 4000 km s−1. It was detected at 1.5 mJy and was subtracted from the spectra before any analysis was undertaken.
3. The molecular gas in IRAS F08572+3915
3.1. Main galaxy
The main galaxy in the system (located in the northwest quadrant of Fig. 1) has previously been observed and detected in CO(1-0) line emission (Solomon et al. 1997; Evans et al. 2002; Cicone et al. 2014), although with a sensitivity and spatial resolution poorer than the observations presented here. Figure 1 (left) shows the distribution of the CO emission on top an HST (F814W) image. An elliptical Gaussian fit to the uv table of the A+B+C+D observations gives the peak of emission at RA 09:00:25.38 and Dec +39:03:54.2. This position coincides within 0.1″ of the radio center at 8.44 GHz found by Condon et al. (1991). The galaxy’s emission is not perfectly symmetric around this point, but is more extended towards the West. The best elliptical Gaussian fit has an intrinsic major full width at half maximum (FWHM) of 0.61 ± 0.2″ and an intrinsic minor FWHM of 0.54 ± 0.2″, corresponding to 0.74 by 0.65 kpc, with a PA of −10 ± 10°. The disk is thus slightly elongated towards the northwest, but because the length of the major and minor axes only differ by a little, the PA is not used here to constrain the orientation and inclination of the disk.
The top-right panel of Fig. 1 shows the CO spectrum of the main galaxy. We measure a redshift of zCO = 0.0582, which we use to set the systemic velocity. This redshift is similar to that found by Evans et al. (2002) and the same as the one measured by González-Alfonso et al. (2017) based on the [CII] line. The continuum level, depth of observations, and resolution do not indicate any absorption related to the wind seen by Geballe et al. (2006) and Shirahata et al. (2013) in other wavelengths.
Based on visual inspection, we decided to measure the flux in the galaxy by integrating in the [ − 400, +400] km s−1 velocity range. This results in FCO(1-0) = 8.2 ± 0.4 Jy km s−1,2 which is consistent with the single-dish (IRAM 30 m) measurement of FCO(1-0) = 9.0 ± 1.8 Jy km s−1 by Solomon et al. (1997). Our CO flux measurement corresponds to a molecular gas mass of Mmol = 1.04 ± 0.10 × 10⁹ M⊙ assuming a ULIRG-like conversion factor of αCO, ULIRG = 0.8 M⊙ (K km s−1 pc2)−1 (Downes & Solomon 1998). However, more recent studies by Genzel et al. (2015) and Tacconi et al. (2018) that compare CO and dust-based estimates of the molecular gas mass in nearby and high-z galaxies suggest that the αCO factor applied to (U)LIRGs should be the standard Milky Way conversion factor of αCO, MW = 4.4 M⊙ (K km s−1 pc2)−1 (Bolatto et al. 2013). This is assuming the latter give a molecular gas mass of Mmol = 5.72 × 10⁹ M⊙. Relative to the stellar mass of the main galaxy of M⋆ ≈ 3 × 10¹⁰ M⊙ (Rodríguez Zaurín et al. 2009), the molecular gas-to-stellar mass ratio is μ ≡ Mmol/M⋆ ≈ 3% or ≈16% if we assume αCO, ULIRG or αCO, MW, respectively.
The position, velocity range, flux, molecular gas mass, and size of the main galaxy are listed in Table 2.
CO(1-0) positions, fluxes and masses of the galaxies and outflows.
3.2. Companion galaxy
The left panel of Fig. 1 shows extended CO emission at the location of the companion galaxy in the southeast quadrant. This is the first time this galaxy is detected in CO line emission. The peak is at RA 9:00:25.6 and Dec +39:03:49, and coincides with the position of the galaxy in SDSS i−band images and the HST (F814W). The line profile has a regular shape, is narrow (σ = 59 km s−1), and peaks at v = 30 km s−1 (bottom-left panel in Fig. 1). The line has a flux of FCO(1-0) = 0.8 Jy km s−1, which corresponds to a molecular gas mass of Mmol ≈ 108 M⊙ assuming a conversion factor αCO, ULIRG (Table 2) and Mmol ≈ 5 × 10⁸ M⊙ assuming αCO, MW. There is a substantial uncertainty in the flux (estimated to be ∼20%), because the emission is extended and contaminated by residual side lobes from the main source. A Gaussian fit to the emission in the image plane results in a FWHM of 1.8″. With an average beam size of 1.25″, the estimated (deconvolved) FWHP of the SE galaxy is 1.3″ or 1.6 kpc. The size has been fit in the image plane because a fit in the uv plane was not successful.
4. The outflow in IRAS F08572+3915
As the top panels in Figs. 1 and 3 show, the spectrum of the main galaxy shows clear evidence for high-velocity gas material that extends up to velocities of ±1200 km s−1. These broad wings of emission are strongly suggestive of the presence of a fast molecular outflow.
4.1. Spatial distribution and kinematics of the outflow
The spatial and velocity distribution of the molecular gas can be further explored by looking at the channel maps in Fig. 2. The first four panels (vCO ≲ −400 km s−1) reveal the blueshifted wing of the outflow. This component is located southeast of the main galaxy and is centered at roughly the same position in all four bins; no evident velocity gradient is visible within our angular resolution. The next five channels encompass the velocity range −400 ≲ vCO ≲ +400 km s−1 where the bulk of the CO emission arises from the body of the main galaxy. Finally, the bottom panels reveal the redshifted component of the outflow (vCO ≳ +400 km s−1) located northwest of the galaxy center. Similar to the blue wing, this component remains centered at a similar position, except for the channel at vCO = 920 km s−1. Around this velocity a second outflow component is present located at about ∼6 kpc from the main galaxy in the northern direction.
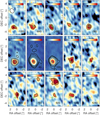 |
Fig. 2. Channel maps (40 km s−1 bins) showing the CO(1-0) line emission in IRAS F08572+3915 in velocity steps of 160 km s−1. The velocity of each map is printed in the lower-right corner and the NOEMA beam is shown in the top-left corner of the first panel. The green cross marks the position of the CO(1-0) peak in the NW galaxy, and the contours are placed at the 3, 5, 10 and 20σ level. Each map has its own color scale to make both bright and faint features visible, so we include the corresponding colorbar in the top of each panel in units of mJy beam−1. We observe that the outflow is aligned with the kinematic major axis of the disk (roughly going from the southeast to the northwest), and that the second redshifted outflow component is brightest around 900 km s−1. |
A complementary view of the outflow structure is provided in Fig. 3, which shows the spatial distribution of the integrated CO emission in the blue ([ − 1200, −400] km s−1) and red ([ + 400, +1200] km s−1) wings of the spectrum overplotted on a HST (F814W) image. The contours are placed at 3, 5 and 10σ levels, with 1σ corresponding to the noise level given in Table 2. As already revealed in the channel maps, two main outflows components can be identified: (1) a main component centered at the position of the northwest galaxy, and (2) a fast “blob” of gas located ∼5″ (∼6.4 kpc) north from the center. This second, fainter, outflow gas has been detected before by Cicone et al. (2014), and now thanks to the higher angular resolution of our observations, we confirm this is a different component.
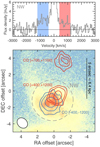 |
Fig. 3. Top: continuum-subtracted CO(1-0) spectrum extracted within a circular aperture of 5″ diameter centered on the NW galaxy. Strong broad wings of CO(1-0) line emission indicative of a molecular outflow are detected with velocities up to ±1200 km s−1. Bottom: integrated CO(1-0) line emission integrated in the blue ([ − 400, −1200] km s−1) and red ([ + 400, +1200] km s−1) wings and the red gas blob ([ + 700, +1100] km s−1) overplotted on a HST (F814W) image. The NOEMA synthesized beam is shown in the bottom-left corner. Contours correspond to 3, 5, and 10σ for the blue and red wings, and 3, 5, and 7σ for the red gas blob. An extranuclear component of the red wing is detected approximately ∼6 kpc north (projected distance) of the NW galaxy moving at ∼ + 900 km s−1, but decelerating (see Fig. 4). |
Finally, Fig. 4 shows the integrated intensity, velocity, and velocity dispersion maps of the main galaxy, and the blue and red components of the outflow. The velocity map of the main component galaxy shows a convincing but slightly disturbed rotating disk with a position angle of approximately −45°. The blue and red main outflow components have velocity dispersions in the σCO ≈ 150 − 300 km s−1 range, and velocity fields that show no systematic variations as a function of position. In contrast, the velocity of the red gas “blob” decreases from ∼1000 km s−1 to about ∼850 km s−1 as a function of increasing distance from the host.
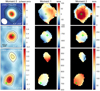 |
Fig. 4. Integrated intensity (left column), velocity (center column), and dispersion (right column) maps for the NW galaxy (top row), the blue wing (center row), and the two red wing components (bottom row). Only regions with > 3σ detections are shown. The green cross marks the position of the CO(1-0) peak in the NW galaxy. Contours correspond to 3, 5, 10 and 20σ, where σ for each map is listed in Table 2. The NOEMA beam is shown in the bottom-left corner of the first panel. |
We discuss in more detail the nature of this second outflow component in Sects. 4.4 and 5.3.
4.2. Geometry of the outflow
The observed spatially-resolved properties of the outflow – including the absence of a velocity gradient (within our resolution), the large range of velocities covered, and the spatial offset between the main outflow components and the galaxy center – provide useful constraints on its structure.
We consider two possible ideal cases: a bicone (a shell with an opening angle), and two individual blobs. In both cases the outflow has a maximum velocity vmax, and is only slightly resolved spatially. Firstly, for a bicone, if the angle is large enough so the geometry approaches a shell, or if the bicone is pointed directly toward the observer, then we would expect that the channel maps at all velocities to be centered at the same point. In any other case, we would expect that the blueshifted and redshifted emission should be offset from the center of the outflow, in opposite directions. Acceleration and deceleration may be observed, depending on the opening angle. Secondly, for individual clouds, the observed velocity range is caused by turbulence within the clouds, rather than projection effects. Unless the cloud moves directly toward us, it should be clearly offset from the driving source. Velocity gradients could be observed when the cloud accelerates or decelerates.
The main outflow component matches best with the description of the biconical outflow with a large opening angle, directed not toward us exactly, but forming an angle with the line-of-sight. Because of the large opening angle, we expect vmax to be close to the maximum observed velocity in the outflow, which is ∼1200 km s−1. The second redshifted outflow, on the other hand, matches the description of the individual cloud. The assumed geometry of the outflow has implications for the calculation of the mass loss rate and energetics as we discuss in the next section.
4.3. Size, mass outflow rate, and energetics
The sizes of the two components in the biconical outflow are retrieved from Gaussian fits to the uv data. The Full Width at Half Power (FWHP) of the blueshifted part is 0.77″ or 0.92 kpc, in comparison to the 1.36 kpc found in Cicone et al. (2014): adding visibilities at larger uv radii resulted in a better fit with a slightly more compact source. For the redshifted component, the difference between our FWHP and that found in Cicone et al. (2014) is larger because the second redshifted outflow is now resolved, and not included in the Gaussian fit. This results in a FWHP of the redshifted part of 0.82″ or 0.98 kpc (compared to 1.91 kpc found previously). The FWHP is listed in Table 2.
Since the size of the red outflow component (∼0.9 kpc) is smaller than its distance to the galaxy center (∼1.1 kpc), the outflow seems detached from the galaxy, as if it is not being replenished with new gas (see also the channel maps in Fig. 2). This observation suggests that the outflow is a bursty, rather than a continuous, process. This has consequences for the calculation of the outflow mass. Maiolino et al. (2012) derive the mass outflow rate for a spherical outflow with uniform density that is continuously replenished with new gas to be Ṁout = 3Moutvmax/R. This changes to an instantaneous mass outflow rate of Ṁout = Moutvmax/ΔR for a bursty outflow. In the latter case, the thickness of the outflowing shell, ΔR, is of interest. This value is hard to derive observationally in a biconical outflow, but the FWHP as given in Table 2 is the best approximation. Assuming then an αCO, ULIRG conversion factor for the gas in the outflow, vout = 1200 km s−1 (see Sect. 4.2), and ΔR = 0.95 kpc (the average FWHP between the red and blue wings; see Table 2), the molecular mass outflow rate in IRAS F08572+3915 is:
 (1)
(1)
Since ΔR is probably overestimated, this mass outflow rate represents a conservative estimate. This value is also ∼3 times smaller than that derived previously by Cicone et al. (2014). This is mainly caused by two changes: (1) the second redshifted outflow is excluded from the analysis, resulting in a smaller outflow mass by ∼15% (see Fig. 3), and (2) the outflow rate is calculated as Ṁout = Mvmax/ΔR rather than as Ṁout = 3 × Mvmax/R, based on new insights that the outflow is bursty rather than continuous.
In addition to the mass outflow rate, we can also calculate the momentum (Ṗout = Ṁout × vout) and energy flux ( ) of the molecular outflow in IRAS F08572+3915. Based on the values listed in Table 2, the outflow momentum flux in IRAS F08572+3915 is
 (2)
(2)
and the outflow kinetic energy flux is
 (3)
(3)
We analyze these quantities in the context of the momentum boost and the power generated by the starburst and the AGN activity present in IRAS F08572+3915 in Sect. 5.2.
4.4. The second redshifted outflow ∼6 kpc north of the main galaxy
The second and independent part of the redshifted outflow is located at RA 9:00:25.26, Dec +39:03:58.9, at 4.9″ or 5.9 kpc north from the main galaxy. The spectrum extracted within a R = 1.5″ circular aperture centered at this position is shown in Fig. 5 (this outflow component is also detected in the A+B only array configuration data, see Appendix A). It has a flux of FCO(1-0) = 0.4 Jy km s−1, corresponding to a molecular gas mass of Mmol ≈ 5 × 10⁷ M⊙ (assuming a conversion factor αCO, ULIRG). No optical counterparts for this outflow have been found. The size of the outflow cannot be retrieved from a Gaussian fit in the uv-plane because it is faint. We therefore estimate the size from a Gaussian fit in the image plane, deconvolved with the beam size. The resulting projected size (FWHM) is 0.7 kpc.
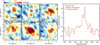 |
Fig. 5. Left: channel maps showing the CO(1-0) line emission of the “gas blob” (RA 9:00:25.26, Dec +39:03:58.9) located ∼6 kpc north of the main galaxy. The NOEMA beam is shown in the top-left corner of the first panel. The contours show the 2.5σ (dashed line) and 3, 4, 5 and 6σ (solid lines) levels of emission. Right: CO(1-0) spectrum extracted from a circular region with a radius of 1.5″ centered around the “gas blob.” |
Although this outflow component is barely resolved, it seems to have a velocity gradient, ranging from 1000 km s−1 on the side facing the galaxy to about 700 km s−1 on the opposite side (see Figs. 2 and 4). The gradient is seen in all channel maps, regardless of their bin size. Moreover, the shift is observed in spectra taken at different distances from the host, which reinforces the idea that the velocity gradient is real. Since there is no clear obstacle in the way of the outflow, the gas might simply slow down as a result of gravitational pull and the lack of an ongoing driving mechanism or because there is more energy being deposited closer to the nucleus in the NW galaxy. We discuss possible scenarios for the origin of the gas blob in Sect. 5.3.
5. Analysis
5.1. Comparison of the molecular, atomic, and ionized phases of the outflow
The improved spatial resolution and sensitivity of the CO observations makes it possible to make a comparison with other ISM phases of the outflow. Previously observed components of the wind include the atomic, ionized, and cold and warm molecular phases (Sturm et al. 2011; Rupke & Veilleux 2013a,b; Janssen et al. 2016; González-Alfonso et al. 2017). Table 3 summarizes the outflow properties of the different phases including the total mass in the outflow, the average (or typical) velocity, the outflow radius in kpc (if known), the mass outflow rate (Ṁout), the momentum rate (Ṁoutv), and the energy rate (1/2Ṁoutv2).
Positions, fluxes and masses of the galaxies and outflows.
Cold molecular phase – CO. For a detailed description of the cold molecular phase of the outflow based on the CO(1-0) line see Sect. 4.2.
Molecular phase – OH. The molecular phase of the wind in the NW component of IRAS F08572+3915 is also seen in multiple OH transitions (Sturm et al. 2011; González-Alfonso et al. 2017). It is important to note that the OH observations trace only the central part of the outflow: because the blueshifted wings in the OH lines are observed in absorption, a FIR continuum background is required to see the outflow. In IRAS F08572+3915 this continuum has a half-light radius as small as 0.4 kpc at 70 μm, and 0.7 kpc at 100 μm (Lutz et al. 2016). This suggests that there is an overlap between the molecular outflow traced by the CO(1-0) and OH transitions. We note, however, that most likely the gas traced by the OH transitions is more sensitive to the nuclear outflowing gas (González-Alfonso et al. 2017), while CO(1-0) emission is more sensitive to the more extended, kiloparsec scale blue-shifted outflow. According to the model of the outflow by González-Alfonso et al. (2017), the total molecular gas mass in the outflow as traced by the OH transitions is Mmol, OH = 1.2 × 10⁸ M⊙, which is consistent, within the uncertainties, with the CO-based molecular gas mass of Mmol, CO = 2.7 × 10⁸ M⊙.
Warm molecular phase – H2.Rupke & Veilleux (2013b, 2016) present OSIRIS/Keck observations of the warm H2-pagination
outflow, which has velocities between −700 km s−1 and −1000 km s−1. The outflow accelerates over a few hundred parsec, which suggests that the gradient in the CO outflows is undetected due to beam smearing. As Fig. 6 shows, the CO(1-0) blueshifted wing is aligned with the warm H2 outflow (Rupke & Veilleux 2016). The H2 outflow emerges along the minor axis of a very small-scale (≲500 pc) disk that is oriented very differently from the large-scale disk as traced in the optical (Rupke & Veilleux 2013a) or the cold molecular gas. The outflow mass and outflow rate in warm H2 is ∼10−4 times the mass and outflow rate traced by CO(1-0). The same mass ratio between warm and cold H2 was found in M82 by Veilleux et al. (2009). We note, however, that the H2 observations only cover a small area of the whole outflow (the FOV is 1″ × 2.9″).
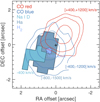 |
Fig. 6. Multiphase structure of the outflow in IRAS F08572+3915, including the cold molecular wind as traced by the CO(1-0) line (this work; blue and red contours), and the warm molecular (H2), atomic (Na I D), and ionized winds (Hα) as reported by Rupke & Veilleux (2013a). The black cross marks the position of the CO(1-0) peak in the NW galaxy. The observed range of velocities in the winds is listed next to each outflow component. Absorption by the galaxy’s disk is probably the reason that the redshifted outflow is only detected in CO. |
Neutral and ionized phases – Na I D and Hα. The ionized phase of the outflow, as traced by broad blueshifted Hα line emission, reaches very high velocities (∼3300 km s−1; Rupke & Veilleux 2013a) and extends along the major kinematic axis of the galaxy, similar to the blue wing of the molecular outflow. The atomic wind, traced by the Na I D line in absorption, is offset from the nucleus by ∼1 − 2 kpc and partly overlaps with the blueshifted ionized and molecular winds. It reaches velocities up to ∼1000 km s−1 (Rupke & Veilleux 2013a). The FoV of the observations of the atomic and ionized phases of the outflow covers red and blue components of the biconical outflow. Still, in both cases, only the blueshifted part of the outflow is detected, most likely because the redshifted part is obscured by the disk.
Multi-phase – [C II]. [C II] 158 μm line emission can arise from the ionized, molecular, and atomic media (e.g., Pineda et al. 2013; Abdullah et al. 2017; Herrera-Camus et al. 2017). Therefore, the high-velocity (∼800 km s−1) gas detected in the [C II] spectrum of IRAS F08572+3915 by Janssen et al. (2016) could be probing a combination of phases in the outflow. Janssen et al. (2016), assuming that the gas in the outflow follows typical ULIRG-like conditions (n = 105 cm−3 and T = 100 K), estimate a total mass in the outflow of Mout = 1.4 × 10⁸ M⊙, which is comparable to that measured in the cold molecular phase using the CO and OH lines.
Which gas phase dominates the mass and energetics of the outflow? In Fig. 7 we compare the outflow mass and mass loading factor of IRAS F08572+3915 as a function of the gas phase, understanding that this exercise is limited, among other factors, by the assumptions on the wind geometry and luminosity-to-mass conversion factors that can introduce up to an order-of-magnitude uncertainty. For comparison, we also include multi-phase outflow measurements for other three major merger, luminous infrared systems: Mrk 231, Mrk 273, and IRAS F10565+2448 (Rupke & Veilleux 2013a; Veilleux et al. 2013; Janssen et al. 2016; González-Alfonso et al. 2017). We find that in IRAS F08572+3915, the cold molecular gas is the dominant phase of the outflow. The atomic phase, however, is only a factor ∼3 lower than the molecular gas which, upon taking into account the uncertainties in the calculations, could be considered comparable. The same conclusion is true for the other three ULIRGs in Fig. 7.
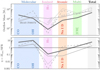 |
Fig. 7. Outflow mass (top) and mass loading factor η (bottom) for different gas phases of the outflow, including molecular (as traced by CO and OH), ionized (Hα) and atomic phases (Na I D), and most likely a combination of the three as traced by [C II]. For the sum of the phases (last column) we consider the molecular phase as traced by the CO line emission. We caution the reader that these measurements are affected by a series of assumptions on the physical conditions of the gas and geometry that can have a significant impact on the final value. The results for IRAS F08572+3915 are shown with a thick gray line. For comparison, outflow properties of other major merger, infrared luminous systems such as Mrk 231 (dashed line), Mrk 273 (solid line), and IRAS F10565+2448 are also shown (Rupke & Veilleux 2013a; Veilleux et al. 2013; Cicone et al. 2014; Janssen et al. 2016; González-Alfonso et al. 2017). |
The bottom panel of Fig. 7 shows the mass loading factor (defined as η = Ṁout,mol/SFR) measured in the different gas phases. We find that the mass loading factor in the molecular phase largely dominates over the atomic and ionized phase values, and that it is the only phase where the rate of gas ejection is higher than the rate of molecular gas consumption, i.e., ηmol > 1. We discuss in more detail the implications of the high molecular mass outflow rate in Sect. 5.4.
5.2. Star formation versus AGN activity as drivers of the main molecular outflow
In this section we investigate if the nuclear starburst, the AGN, or a combination of the two are capable of driving the powerful molecular outflow observed in IRAS F08572+3915.
In an ideal scenario, outflows can be either momentum- or energy-driven (e.g., Faucher-Giguère & Quataert 2012; Costa et al. 2014), which results in different predictions on how much the stellar and AGN feedback can contribute to the expansion of the wind. The observed high momentum boost in the molecular outflow of IRAS F08572+3915 (∼20 LAGN/c or ∼40 LSF/c) can only be explained if the outflow is energy-driven. In that case, energy injection by supernovae explosions and winds from massive stars is expected to be ∼0.1 − 0.5% of the starburst luminosity (e.g., Murray et al. 2005; Veilleux et al. 2005). For IRAS F08572+3915, this corresponds to ∼(0.1 − 0.5)% × LSB ∼ 2 − 9 × 1042 erg s−1, which is at least a factor of ∼15 lower than the measured molecular outflow kinetic luminosity (Eq. (3)). If the main power source is the AGN, the maximum energy input is expected to be ∼5% of the AGN radiative power in case the coupling efficiency with the ISM is 100% (e.g., Faucher-Giguère & Quataert 2012; Zubovas & King 2012). This results in ∼5%×LAGN ∼ 2 × 1044 erg s−1, which is comparable to the kinetic luminosity of the molecular outflow (Eq. (3)). This suggests that the AGN is the main source driving the outflow, and that the coupling efficiency with the ISM is high as a result of a dense, thick and more spherical distribution of the gas and dust around the AGN. This scenario is consistent with the observed deeply dust obscured nature of the nuclear region in IRAS F08572+3915 (see Sect. 1).
In summary, this simple and idealized analysis presented here suggests that the fast, kpc-scale molecular outflow in IRAS F08572+3915 is energy conserving, driven by the AGN, and with a high ISM coupling efficiency.
5.3. The origin of the fast gas blob ∼6 kpc away from the galaxy
In addition to the main component of the outflow, we detect a gas blob of projected size ∼1 kpc and located ∼6 kpc northwest of the main system that is moving away at ∼900 km s−1 (see Sect. 4.4 for details). Here we discuss two alternatives to explain its origin: a fossil outflow and a faint jet.
Outflow features resulting from episodic driving of the AGN are commonly known as fossil outflows, and are both expected from theory (e.g., King et al. 2011) and observed in nearby systems (e.g., Fluetsch et al. 2019; Lutz et al. 2020). In this scenario, the fast gas blob could be the result of an earlier phase of nuclear activity. For a distance of 6 kpc and assuming the gas has been driven out all the way from the center at a constant velocity of 900 km s−1, the flow time from the center of the main galaxy is ∼6 Myr (this also assumes deprojection effects in velocity and radius cancel out). This rough estimate is consistent with the variability (or “flickering”) timescale of AGN activity of about ∼0.1 − 1 Myr (e.g., Schawinski et al. 2015; King & Nixon 2015; Zubovas & King 2016), and the fact that outflow material can continue to expand for a time ∼10 times longer than the duration of the nuclear active phase (King et al. 2011).
The second alternative is that the gas blob is the product of the interaction between a relativistic jet and the ISM. Feedback by jets is mainly driven by ram and thermal pressure which results in outflows that are energy-conserving on all scales (for a review, see Wagner et al. 2016). As the jet opens its way through the clumpy galaxy disk and surrounding material it disperses atomic and molecular clouds in all directions. The interaction between the jet and the ISM can extend for kiloparsec scales (e.g., Morganti et al. 2005; Holt et al. 2008; Wagner & Bicknell 2011).
There is no clear evidence for a jet in IRAS F08572+3915. Older radio observations using the Very Large Array (VLA) by Sopp & Alexander (1991) tentatively detect a faint, extended structure in the north-south direction that extends for about 4″ and could be interpreted as the signature of a faint jet. More recent observations with the upgraded Karl G. Jansky VLA by Leroy et al. (2011) and Barcos-Muñoz et al. (2017) – with comparable angular resolution than Sopp & Alexander (1991) – do not detect any extended component, only compact emission. Consistent with the scenario of no jet, the ratio between the rest-frame infrared and the 1.4 GHz monochromatic radio flux, qIR, indicates that IRAS F08572+3915 is radio-quiet (qIR is 3.57, about an order of magnitude higher than the average value found in ULIRGs; Leroy et al. 2011). We note, however, that there are examples of radio-quiet galaxies with jet-like winds indicating the existence of either a faint ongoing jet or a past jet event (e.g., Aalto et al. 2016; Fernández-Ontiveros et al. 2020). Finally, the CO spectral line energy distribution (SLED) up to J = 11 reveals highly excited gas in IRAS F08572+3915 (Papadopoulos et al. 2010; Pearson et al. 2016). While the strong AGN and starburst activity contribute significantly to the high molecular gas excitation, we cannot rule out that shocks resulting from a potential jet-dense ISM play a role in shaping the SLED beyond J ∼ 7 (e.g., Papadopoulos et al. 2008; Pellegrini et al. 2013).
In summary, we do not have enough evidence to confirm that there is or there has been a faint radio jet operating in IRAS F08572+3915 but if it was, it opens the possibility for the fast gas blob to be the result of dense material accelerated by the jet far away from the nucleus. In that case, the estimated flow time of ∼6 Myr in the fossil scenario would be obsolete. A jet-driven outflow would be also consistent with the observed high momentum boost and energy conserving properties of the wind. Certainly, deeper and higher angular resolution observations are needed to confirm or rule out the jet-ISM interaction scenario.
5.4. AGN feedback and quenching of star formation
Quantifying the impact of the outflow on the star formation activity of IRAS F08572+3915 is a very complicated problem that requires detailed knowledge on the accretion of fresh or recycled gas, the ejection of molecular gas by the outflow, how much of that gas can permanently escape from the galaxy, and the duty cycle of the AGN. Unfortunately, some of these key pieces are missing and in this section we can only hypothesize on the fate of IRAS F08572+3915 based on the measurements we have of the molecular gas reservoir, the star formation activity, and the energetics of the outflow.
We start by comparing the time it would take the star formation and the outflow to exhaust – via consumption or ejection – the total reservoir of molecular gas. The star formation depletion timescale, defined as tdep, SF = Mmol/SFR, is tdep, SF ≈ 15 Myr, which is at the low end of the range of tdep, SF measured in (U)LIRGs (e.g., Cicone et al. 2014; González-Alfonso et al. 2017; Shangguan et al. 2019). The molecular mass loading factor in IRAS F08572+3915 is ηmol = Ṁout,mol/SFR ≈ 5, so the depletion time due to the outflow, tdep,out = Mmol/Ṁout,mol, is only ∼3 Myr. This timescale is reduced by half if we only consider the molecular gas in the nuclear ∼1.5 kiloparsec region (i.e.,  Myr). Based on this short depletion timescale, one could expect that the outflow is rapidly quenching the star formation activity in (at least) the central region of IRAS F08572+3915. Before jumping to such conclusion, however, it is important to keep in mind that: (1) the AGN is variable and “flickers” on expected timescales of ∼0.1 − 1 Myr (e.g., Schawinski et al. 2015; Zubovas & King 2016), and (2) a large fraction of the molecular gas that is ejected via the outflow could be later re-accreted and become available to fuel future episodes of star formation (see for example the molecular outflows studied by Pereira-Santaella et al. 2018; Fluetsch et al. 2019; Herrera-Camus et al. 2019).
To obtain a rough estimate of the amount of molecular gas in the outflow of IRAS F08572+3915 that can escape the gravitational potential of its host, we need to determine the escape velocity from the system. We start by calculating the dynamical mass of the main (or northern) component of IRAS F08572+3915. For this we use dysmalpy, which is an updated version of the dynamical model code dysmal (Cresci et al. 2009; Davies et al. 2011) that now includes a Markov chain Monte Carlo (MCMC) sampling procedure. We model the CO velocity field using as a free parameters the dynamical mass (Mdyn), effective radius of an exponential disk (Reff), and inclination (i) of the galaxy. The details of the kinematic analysis are discussed in Appendix B. As we show in Fig. B.1, the dysmal model of the velocity field does a good job reproducing the bulk rotation of the system. From the MCMC sampling of the joint posterior probability distributions of the model parameters (see Fig. B.2), we determine that the dynamical mass and the effective radius are  and
and  kpc, respectively. Following a similar approach to Fluetsch et al. (2019), assuming a Hernquist profile for the density (Hernquist 1990) we estimate an escape velocity from the gravitational potential of the galaxy at ∼Reff of vesc ≈ 850 km s−1. If we then integrate the CO spectrum of the main galaxy in the range where velocities are higher than the escape velocity, we estimate that the global fraction of molecular gas that can escape the system is fesc ≈ 0.4. This value is at the high end of the distribution of global escape fractions of molecular gas computed for other ULIRGs by Pereira-Santaella et al. (2018) and Fluetsch et al. (2019). It is also consistent with the high molecular escape fraction of fesc ≈ 0.25 derived based on the analysis of the OH transitions by González-Alfonso et al. (2017). One caveat worth mentioning in this simplified calculation is that owing to the limited spatial resolution and the lack of precise knowledge concerning the wind geometry, it is impossible to estimate what fraction of the outflowing gas will escape at distances R ≲ Reff. Taking this into account would most likely reduce the global escape fraction.
If we fold in the outflow escape fraction into the calculation of the mass loss rate, we obtain the molecular gas mass escape rate, which for IRAS F08572+3915 is Ṁesc,mol = fesc × Ṁout,mol ≈ 150 M⊙ yr−1. This implies that the time it would take for the outflow to remove the molecular gas from the galaxy gravitational potential is only ∼3 Myr for the inner ∼1.5 kiloparsec region, and ∼7 Myr for the whole molecular content of the system. Figure 8 put these timescales in context with those measured in other (U)LIRGs by Fluetsch et al. (2019) and Pereira-Santaella et al. (2018). The color symbols represent the star formation and outflow depletion timescales if we consider all the gas that is being ejected.
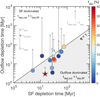 |
Fig. 8. Molecular gas depletion timescale (in Myr) due to gas consumption by star formation activity (tdep, SF = Mmol/SFR; abscissa) and gas removal by the outflow (tdep,out = Mmol/Ṁout,mol; ordinate). IRAS F08572+3915 is shown as a star, and other (U)LIRGs taken from the literature are shown as circles (Pereira-Santaella et al. 2018; Fluetsch et al. 2019). The points are color-coded according to the escape fraction fesc, defined as the mass fraction of the molecular gas in the outflow that can escape the gravitational potential of its host. Diagonal line represents tdep, SF = tdep, out or, equivalently, a mass loading factor of η = 1. Vertical lines show where the data points would move if we calculate the depletion time based on the rate of molecular gas ejected by the outflow that can escape the gravitational potential of its host (i.e., Ṁesc,mol = fesc × Ṁout,mol). |
All of the (U)LIRGs except two (IRAS 14348 NE and PG 0157+001) have tdep, out ≲ tdep, SF (or equivalently η ≳ 1), that is, the depletion of the molecular gas in these systems is dominated by the outflow. This scenario drastically changes if we now only consider the gas in the outflow that is fast enough to escape the gravitational potential of the galaxy. This change increases the outflow depletion timescales by a factor  , and the new position of the galaxies is shown with vertical grey lines. We note that all the galaxies, except IRAS F08572+3915, have shorter depletion timescales associated to the starburst activity, not the outflow (tdep, SF ≲ tdep, out, or equivalently ηesc = η × fesc ≲ 1). For IRAS F08572+3915, the rate of gas ejection that can escape is a factor of two higher than the rate of gas consumption. This result is consistent with the low molecular gas content measured in this galaxy relative to other (U)LIRGs: it is the system with the lowest molecular gas content in the sample of Solomon et al. (1997), and the one with the highest LFIR/MH2 ratio in the sample of González-Alfonso et al. (2015).
The fact that the mass loading factor in IRAS F08572+3915 is higher than one – even after we consider only the gas that is fast enough to escape the system – shows the potential the outflow has to deplete the molecular gas from the central region and thus prevent future episodes of star formation (e.g., Hopkins & Elvis 2010; Zubovas & King 2012; Zubovas & Bourne 2017). It is important to keep in mind, however, a series of factors that complicate this first order interpretation. For one, we have AGN variability, which will extend the actual ejection time of molecular gas. Another important unknown is the fraction of gas that is removed from the gravitational potential of the host that could be reaccreted at later times.
6. Summary and conclusions
We present deep and spatially-resolved observations of the molecular gas in the ultra-luminous infrared galaxy IRAS F08572+3915 based on new, deep (∼50 h) CO line observations with the NOEMA interferometer. This system is known to host a powerful, multi-phase AGN-driven outflow (Sturm et al. 2011; Rupke & Veilleux 2013a,b; Cicone et al. 2014; Janssen et al. 2016; González-Alfonso et al. 2017). The goal of this work was to characterize in detail the molecular phase of the wind and explore its impact on the star formation activity.
We highlight the following points:
-
Compared to previous observations of the CO(1-0) line emission by Cicone et al. (2014), our data achieves a better spatial resolution (θ = 1.4″ × 1.3″ versus θ = 3.1″ × 2.7″) and sensitivity (σ = 0.06 mJy beam−1 versus σ = 0.2 mJy beam−1). This allows us to spatially resolve the molecular outflow in the main galaxy and to detect for the first time the molecular gas in the minor galaxy of the interacting pair.
-
The molecular outflow in IRAS F08572+3915 is fast (vout ≈ 1200 km s−1), massive (Mmol, out ≈ 1/4 × Mmol, disk), and most likely has a biconical shape with a wide opening angle. No velocity gradient in the outflow is observed.
-
We detect an additional outflow component in the receding side that is detached from the biconical structure. This “gas blob” has a molecular gas mass of ∼5 × 10⁷ M⊙, it is located at about 6 kpc from the main galaxy, and is moving away at ∼900 km s−1. Its origin could be associated to the intermittent (or “flickering”) nature of AGN activity or the potential existence of a faint jet that interacted with the surrounding dense ISM medium.
-
Compared to other gas phases in the outflow (warm molecular, ionized, and atomic), the cold molecular phase dominates both the outflow mass and the mass loss rate in IRAS F08572+3915. In fact, this is the only phase where the mass loading factor η is greater than unity (ηcold, mol > 1 > ηneutral > ηion).
-
The fraction of molecular gas in the outflow that can escape the gravitational potential of the galaxy is fesc ∼ 0.4, which is at the high end of the range of escape fractions measured in other (U)LIRGs (fesc ∼ 0.01 − 0.3; Pereira-Santaella et al. 2018; Fluetsch et al. 2019).
-
The mass outflow rate of high-velocity gas that can escape the galaxy (i.e., Ṁesc,mol = fesc × Ṁout,mol) is ∼150 M⊙ yr−1, which is a factor of ∼2 higher than the SFR. Compared to the samples of (U)LIRGs in Pereira-Santaella et al. (2018) and Fluetsch et al. (2019), IRAS F08572+3915 is the only system with a powerful enough outflow to deplete the central molecular gas by “blowing it away” on a timescale shorter than that of star formation.
CLIC and MAPPING2 part of the GILDAS package (Guilloteau & Lucas 2000): http://www.iram.fr/IRAMFR/GILDAS
Here we assume a 5% flux calibration uncertainty. According to the “IRAM Plateau de Bure Interferometer Data Reduction Cookbook” (Castro-Carrizo & Neri 2010), the flux calibration accuracy at 3 mm is ≲10%.
Acknowledgments
We thank the referee, K. Dasyra, for very useful comments and suggestions that greatly improved the manuscript. R.H.-C. would like to dedicate this work in memory of his father-in-law Fernando Antonio Bravo Parraguez (1966−2019). A.J. and R.H.-C. would like to thank Roberto Neri, Michael Bremer and the rest of the IRAM staff for their help with the data calibration, and Loreto Barcos for helpful discussions about VLA observations of the source. Figure 1 is based on observations made with the NASA/ESA Hubble Space Telescope, and obtained from the Hubble Legacy Archive, which is a collaboration between the Space Telescope Science Institute (STScI/NASA), the Space Telescope European Coordinating Facility (ST-ECF/ESA) and the Canadian Astronomy Data Centre (CADC/NRC/CSA). S.V. acknowledges support from a Raymond and Beverley Sackler Distinguished Visitor Fellowship and thanks the host institute, the Institute of Astronomy, where this work was concluded. S.V. also acknowledges support by the Science and Technology Facilities Council (STFC) and by the Kavli Institute for Cosmology, Cambridge. RM acknowledges ERC Advanced Grant 695671 “QUENCH” and support by the Science and Technology Facilities Council (STFC). E.GA is a Research Associate at the Harvard-Smithsonian Center for Astrophysics, and thanks the Spanish Ministerio de Economía y Competitividad for support under project ESP2017-86582-C4-1-R. CC acknowledges funding from the European Union’s Horizon 2020 research and innovation programme under the Marie Sklodowska-Curie grant agreement no. 664931.
References
- Aalto, S., Garcia-Burillo, S., Muller, S., et al. 2015, A&A, 574, A85 [NASA ADS] [CrossRef] [EDP Sciences] [Google Scholar]
- Aalto, S., Costagliola, F., Muller, S., et al. 2016, A&A, 590, A73 [NASA ADS] [CrossRef] [EDP Sciences] [Google Scholar]
- Abdullah, A., Brandl, B. R., Groves, B., et al. 2017, ApJ, 842, 4 [NASA ADS] [CrossRef] [Google Scholar]
- Armus, L., Charmandaris, V., Bernard-Salas, J., et al. 2007, ApJ, 656, 148 [NASA ADS] [CrossRef] [Google Scholar]
- Arribas, S., Colina, L., Bellocchi, E., Maiolino, R., & Villar-Martín, M. 2014, A&A, 568, A14 [NASA ADS] [CrossRef] [EDP Sciences] [Google Scholar]
- Barcos-Muñoz, L., Leroy, A. K., Evans, A. S., et al. 2017, ApJ, 843, 117 [NASA ADS] [CrossRef] [Google Scholar]
- Baron, D., & Netzer, H. 2019, MNRAS, 486, 4290 [NASA ADS] [CrossRef] [Google Scholar]
- Bolatto, A. D., Wolfire, M., & Leroy, A. K. 2013, ARA&A, 51, 207 [Google Scholar]
- Brusa, M., Cresci, G., Daddi, E., et al. 2018, A&A, 612, A29 [NASA ADS] [CrossRef] [EDP Sciences] [Google Scholar]
- Carniani, S., Marconi, A., Maiolino, R., et al. 2017, A&A, 605, A105 [NASA ADS] [CrossRef] [EDP Sciences] [Google Scholar]
- Castro-Carrizo, A., & Neri, R. 2010, IRAM Plateau de Bure Interferometer Data Reduction Cookbook [Google Scholar]
- Cicone, C., Maiolino, R., Sturm, E., et al. 2014, A&A, 562, A21 [NASA ADS] [CrossRef] [EDP Sciences] [Google Scholar]
- Cicone, C., Maiolino, R., Gallerani, S., et al. 2015, A&A, 574, A14 [NASA ADS] [CrossRef] [EDP Sciences] [Google Scholar]
- Cicone, C., Severgnini, P., Papadopoulos, P. P., et al. 2018a, ApJ, 863, 143 [NASA ADS] [CrossRef] [Google Scholar]
- Cicone, C., Brusa, M., Ramos Almeida, C., et al. 2018b, Nat. Astron., 2, 176 [Google Scholar]
- Combes, F., García-Burillo, S., Casasola, V., et al. 2013, A&A, 558, A124 [NASA ADS] [CrossRef] [EDP Sciences] [Google Scholar]
- Condon, J. J., Huang, Z.-P., Yin, Q. F., & Thuan, T. X. 1991, ApJ, 378, 65 [NASA ADS] [CrossRef] [Google Scholar]
- Costa, T., Sijacki, D., & Haehnelt, M. G. 2014, MNRAS, 444, 2355 [NASA ADS] [CrossRef] [Google Scholar]
- Cresci, G., Hicks, E. K. S., Genzel, R., et al. 2009, ApJ, 697, 115 [NASA ADS] [CrossRef] [Google Scholar]
- Dasyra, K. M., Combes, F., Oosterloo, T., et al. 2016, A&A, 595, L7 [NASA ADS] [CrossRef] [EDP Sciences] [Google Scholar]
- Davies, R., Förster Schreiber, N. M., Cresci, G., et al. 2011, ApJ, 741, 69 [NASA ADS] [CrossRef] [Google Scholar]
- Di Matteo, T., Springel, V., & Hernquist, L. 2005, Nature, 433, 604 [NASA ADS] [CrossRef] [PubMed] [Google Scholar]
- Downes, D., & Solomon, P. M. 1998, ApJ, 507, 615 [NASA ADS] [CrossRef] [Google Scholar]
- Dudley, C. C., & Wynn-Williams, C. G. 1997, ApJ, 488, 720 [NASA ADS] [CrossRef] [Google Scholar]
- Evans, A. S., Mazzarella, J. M., Surace, J. A., & Sanders, D. B. 2002, ApJ, 580, 749 [NASA ADS] [CrossRef] [Google Scholar]
- Fan, L., Knudsen, K. K., Fogasy, J., & Drouart, G. 2018, ApJ, 856, L5 [NASA ADS] [CrossRef] [Google Scholar]
- Faucher-Giguère, C.-A., & Quataert, E. 2012, MNRAS, 425, 605 [NASA ADS] [CrossRef] [Google Scholar]
- Fernández-Ontiveros, J. A., Dasyra, K. M., Hatziminaoglou, E., et al. 2020, A&A, 633, A127 [NASA ADS] [CrossRef] [EDP Sciences] [Google Scholar]
- Feruglio, C., Fiore, F., Carniani, S., et al. 2015, A&A, 583, A99 [NASA ADS] [CrossRef] [EDP Sciences] [Google Scholar]
- Feruglio, C., Ferrara, A., Bischetti, M., et al. 2017, A&A, 608, A30 [NASA ADS] [CrossRef] [EDP Sciences] [Google Scholar]
- Fiore, F., Feruglio, C., Shankar, F., et al. 2017, A&A, 601, A143 [NASA ADS] [CrossRef] [EDP Sciences] [Google Scholar]
- Fischer, J., Sturm, E., González-Alfonso, E., et al. 2010, A&A, 518, L41 [NASA ADS] [CrossRef] [EDP Sciences] [Google Scholar]
- Fluetsch, A., Maiolino, R., Carniani, S., et al. 2019, MNRAS, 483, 4586 [NASA ADS] [Google Scholar]
- Foreman-Mackey, D., Hogg, D. W., Lang, D., & Goodman, J. 2013, PASP, 125, 306 [CrossRef] [Google Scholar]
- Förster Schreiber, N. M., Übler, H., Davies, R. L., et al. 2019, ApJ, 875, 21 [NASA ADS] [CrossRef] [Google Scholar]
- García-Burillo, S., Combes, F., Usero, A., et al. 2014, A&A, 567, A125 [NASA ADS] [CrossRef] [EDP Sciences] [Google Scholar]
- García-Marín, M., Colina, L., & Arribas, S. 2009, A&A, 505, 1017 [NASA ADS] [CrossRef] [EDP Sciences] [Google Scholar]
- Geballe, T. R., Goto, M., Usuda, T., Oka, T., & McCall, B. J. 2006, ApJ, 644, 907 [NASA ADS] [CrossRef] [Google Scholar]
- Genzel, R., Tacconi, L. J., Lutz, D., et al. 2015, ApJ, 800, 20 [NASA ADS] [CrossRef] [Google Scholar]
- George, R. D., Ivison, R. J., Smail, I., et al. 2014, MNRAS, 442, 1877 [NASA ADS] [CrossRef] [Google Scholar]
- González-Alfonso, E., Fischer, J., Sturm, E., et al. 2015, ApJ, 800, 69 [NASA ADS] [CrossRef] [Google Scholar]
- González-Alfonso, E., Fischer, J., Spoon, H. W. W., et al. 2017, ApJ, 836, 11 [NASA ADS] [CrossRef] [Google Scholar]
- Guilloteau, S., & Lucas, R. 2000, in Imaging at Radio through Submillimeter Wavelengths, eds. J. G. Mangum, & S. J. E. Radford, ASP Conf. Ser., 217, 299 [NASA ADS] [Google Scholar]
- Harrison, C. M., Alexander, D. M., Mullaney, J. R., et al. 2016, MNRAS, 456, 1195 [NASA ADS] [CrossRef] [Google Scholar]
- Harrison, C. M., Costa, T., Tadhunter, C. N., et al. 2018, Nat. Astron., 2, 198 [NASA ADS] [CrossRef] [Google Scholar]
- Heckman, T. M., Armus, L., & Miley, G. K. 1990, ApJS, 74, 833 [NASA ADS] [CrossRef] [Google Scholar]
- Heckman, T. M., Lehnert, M. D., Strickland, D. K., & Armus, L. 2000, ApJS, 129, 493 [NASA ADS] [CrossRef] [MathSciNet] [Google Scholar]
- Hernquist, L. 1990, ApJ, 356, 359 [NASA ADS] [CrossRef] [Google Scholar]
- Herrera-Camus, R., Bolatto, A., Wolfire, M., et al. 2017, ApJ, 835, 201 [NASA ADS] [CrossRef] [Google Scholar]
- Herrera-Camus, R., Tacconi, L., Genzel, R., et al. 2019, ApJ, 871, 37 [NASA ADS] [CrossRef] [Google Scholar]
- Holt, J., Tadhunter, C. N., & Morganti, R. 2008, MNRAS, 387, 639 [NASA ADS] [CrossRef] [Google Scholar]
- Hopkins, A. M., & Beacom, J. F. 2006, ApJ, 651, 142 [NASA ADS] [CrossRef] [MathSciNet] [Google Scholar]
- Hopkins, P. F., & Elvis, M. 2010, MNRAS, 401, 7 [NASA ADS] [CrossRef] [Google Scholar]
- Hopkins, P. F., Quataert, E., & Murray, N. 2012, MNRAS, 421, 3522 [Google Scholar]
- Imanishi, M. 2002, ApJ, 569, 44 [NASA ADS] [CrossRef] [Google Scholar]
- Imanishi, M., Dudley, C. C., & Maloney, P. R. 2006, ApJ, 637, 114 [NASA ADS] [CrossRef] [Google Scholar]
- Janssen, A. W., Christopher, N., Sturm, E., et al. 2016, ApJ, 822, 43 [NASA ADS] [Google Scholar]
- King, A., & Nixon, C. 2015, MNRAS, 453, L46 [NASA ADS] [CrossRef] [Google Scholar]
- King, A. R., & Pounds, K. A. 2003, MNRAS, 345, 657 [NASA ADS] [CrossRef] [Google Scholar]
- King, A. R., Zubovas, K., & Power, C. 2011, MNRAS, 415, L6 [NASA ADS] [CrossRef] [Google Scholar]
- Leroy, A. K., Evans, A. S., Momjian, E., et al. 2011, ApJ, 739, L25 [NASA ADS] [CrossRef] [Google Scholar]
- Leroy, A. K., Walter, F., Martini, P., et al. 2015, ApJ, 814, 83 [NASA ADS] [CrossRef] [Google Scholar]
- Lutz, D., Berta, S., Contursi, A., et al. 2016, A&A, 591, A136 [NASA ADS] [CrossRef] [EDP Sciences] [Google Scholar]
- Lutz, D., Sturm, E., Janssen, A., et al. 2020, A&A, 633, A134 [NASA ADS] [CrossRef] [EDP Sciences] [Google Scholar]
- Maiolino, R., Gallerani, S., Neri, R., et al. 2012, MNRAS, 425, L66 [NASA ADS] [CrossRef] [Google Scholar]
- Morganti, R., Tadhunter, C. N., & Oosterloo, T. A. 2005, A&A, 444, L9 [NASA ADS] [CrossRef] [EDP Sciences] [Google Scholar]
- Morganti, R., Fogasy, J., Paragi, Z., Oosterloo, T., & Orienti, M. 2013, Science, 341, 1082 [NASA ADS] [CrossRef] [Google Scholar]
- Morganti, R., Oosterloo, T., Oonk, J. B. R., Frieswijk, W., & Tadhunter, C. 2015, A&A, 580, A1 [NASA ADS] [CrossRef] [EDP Sciences] [Google Scholar]
- Murphy, E. J., Condon, J. J., Schinnerer, E., et al. 2011, ApJ, 737, 67 [NASA ADS] [CrossRef] [Google Scholar]
- Murray, N., Quataert, E., & Thompson, T. A. 2005, ApJ, 618, 569 [NASA ADS] [CrossRef] [Google Scholar]
- Murray, N., Ménard, B., & Thompson, T. A. 2011, ApJ, 735, 66 [NASA ADS] [CrossRef] [Google Scholar]
- Papadopoulos, P. P., Kovacs, A., Evans, A. S., & Barthel, P. 2008, A&A, 491, 483 [NASA ADS] [CrossRef] [EDP Sciences] [Google Scholar]
- Papadopoulos, P. P., van der Werf, P., Isaak, K., & Xilouris, E. M. 2010, ApJ, 715, 775 [NASA ADS] [CrossRef] [Google Scholar]
- Pearson, C., Rigopoulou, D., Hurley, P., et al. 2016, ApJS, 227, 9 [NASA ADS] [CrossRef] [Google Scholar]
- Pellegrini, E. W., Smith, J. D., Wolfire, M. G., et al. 2013, ApJ, 779, L19 [NASA ADS] [CrossRef] [Google Scholar]
- Pereira-Santaella, M., Colina, L., García-Burillo, S., et al. 2016, A&A, 594, A81 [NASA ADS] [CrossRef] [EDP Sciences] [Google Scholar]
- Pereira-Santaella, M., Colina, L., García-Burillo, S., et al. 2018, A&A, 616, A171 [NASA ADS] [CrossRef] [EDP Sciences] [Google Scholar]
- Pineda, J. L., Langer, W. D., Velusamy, T., & Goldsmith, P. F. 2013, A&A, 554, A103 [CrossRef] [EDP Sciences] [Google Scholar]
- Ramos Almeida, C., Acosta-Pulido, J. A., Tadhunter, C. N., et al. 2019, MNRAS, 487, L18 [NASA ADS] [CrossRef] [Google Scholar]
- Richings, A. J., & Faucher-Giguère, C.-A. 2018, MNRAS, 474, 3673 [Google Scholar]
- Roberts-Borsani, G. W., & Saintonge, A. 2019, MNRAS, 482, 4111 [NASA ADS] [Google Scholar]
- Roberts, Jr., W. W., Huntley, J. M., & van Albada, G. D. 1979, ApJ, 233, 67 [NASA ADS] [CrossRef] [Google Scholar]
- Rodríguez Zaurín, J., Tadhunter, C. N., & González Delgado, R. M. 2009, MNRAS, 400, 1139 [NASA ADS] [CrossRef] [Google Scholar]
- Rupke, D. S. N., & Veilleux, S. 2013a, ApJ, 768, 75 [NASA ADS] [CrossRef] [Google Scholar]
- Rupke, D. S. N., & Veilleux, S. 2013b, ApJ, 775, L15 [NASA ADS] [CrossRef] [Google Scholar]
- Rupke, D. S. N., & Veilleux, S. 2016, ApJ, 827, L20 [NASA ADS] [CrossRef] [Google Scholar]
- Rupke, D. S., Veilleux, S., & Sanders, D. B. 2002, ApJ, 570, 588 [NASA ADS] [CrossRef] [Google Scholar]
- Rupke, D. S., Veilleux, S., & Sanders, D. B. 2005, ApJ, 632, 751 [Google Scholar]
- Rupke, D. S. N., Gültekin, K., & Veilleux, S. 2017, ApJ, 850, 40 [Google Scholar]
- Sakamoto, K., Aalto, S., Combes, F., Evans, A., & Peck, A. 2014, ApJ, 797, 90 [NASA ADS] [CrossRef] [Google Scholar]
- Santoro, F., Rose, M., Morganti, R., et al. 2018, A&A, 617, A139 [NASA ADS] [CrossRef] [EDP Sciences] [Google Scholar]
- Schawinski, K., Koss, M., Berney, S., & Sartori, L. F. 2015, MNRAS, 451, 2517 [NASA ADS] [CrossRef] [Google Scholar]
- Schneider, E. E., Robertson, B. E., & Thompson, T. A. 2018, ApJ, 862, 56 [NASA ADS] [CrossRef] [Google Scholar]
- Scoville, N. Z., Evans, A. S., Thompson, R., et al. 2000, AJ, 119, 991 [NASA ADS] [CrossRef] [Google Scholar]
- Shangguan, J., Ho, L. C., Li, R., et al. 2019, ApJ, 870, 104 [NASA ADS] [CrossRef] [Google Scholar]
- Shimizu, T. T., Davies, R. I., Lutz, D., et al. 2019, MNRAS, 490, 5860 [NASA ADS] [CrossRef] [Google Scholar]
- Shirahata, M., Nakagawa, T., Usuda, T., et al. 2013, PASJ, 65, 5 [NASA ADS] [CrossRef] [Google Scholar]
- Solomon, P. M., Downes, D., Radford, S. J. E., & Barrett, J. W. 1997, ApJ, 478, 144 [NASA ADS] [CrossRef] [Google Scholar]
- Sopp, H. M., & Alexander, P. 1991, MNRAS, 251, 112 [NASA ADS] [CrossRef] [Google Scholar]
- Spilker, J. S., Aravena, M., Béthermin, M., et al. 2018, Science, 361, 1016 [NASA ADS] [CrossRef] [Google Scholar]
- Spoon, H. W. W., Marshall, J. A., Houck, J. R., et al. 2007, ApJ, 654, L49 [NASA ADS] [CrossRef] [Google Scholar]
- Spoon, H. W. W., Farrah, D., Lebouteiller, V., et al. 2013, ApJ, 775, 127 [NASA ADS] [CrossRef] [Google Scholar]
- Stone, M., Veilleux, S., Meléndez, M., et al. 2016, ApJ, 826, 111 [NASA ADS] [CrossRef] [Google Scholar]
- Sturm, E., González-Alfonso, E., Veilleux, S., et al. 2011, ApJ, 733, L16 [NASA ADS] [CrossRef] [Google Scholar]
- Tacconi, L. J., Genzel, R., Saintonge, A., et al. 2018, ApJ, 853, 179 [NASA ADS] [CrossRef] [Google Scholar]
- Tadhunter, C., Morganti, R., Rose, M., Oonk, J. B. R., & Oosterloo, T. 2014, Nature, 511, 440 [NASA ADS] [CrossRef] [Google Scholar]
- Teng, S. H., Veilleux, S., Anabuki, N., et al. 2009, ApJ, 691, 261 [NASA ADS] [CrossRef] [Google Scholar]
- Teng, S. H., Rigby, J. R., Stern, D., et al. 2015, ApJ, 814, 56 [NASA ADS] [CrossRef] [Google Scholar]
- Tombesi, F., Meléndez, M., Veilleux, S., et al. 2015, Nature, 519, 436 [Google Scholar]
- Tombesi, F., Veilleux, S., Meléndez, M., et al. 2017, ApJ, 850, 151 [NASA ADS] [CrossRef] [Google Scholar]
- Übler, H., Genzel, R., Tacconi, L. J., et al. 2018, ApJ, 854, L24 [NASA ADS] [CrossRef] [Google Scholar]
- Vayner, A., Wright, S. A., Murray, N., et al. 2017, ApJ, 851, 126 [NASA ADS] [CrossRef] [Google Scholar]
- Veilleux, S., Kim, D.-C., & Sanders, D. B. 1999, ApJ, 522, 113 [NASA ADS] [CrossRef] [Google Scholar]
- Veilleux, S., Cecil, G., & Bland-Hawthorn, J. 2005, ARA&A, 43, 769 [Google Scholar]
- Veilleux, S., Rupke, D. S. N., & Swaters, R. 2009, ApJ, 700, L149 [NASA ADS] [CrossRef] [Google Scholar]
- Veilleux, S., Meléndez, M., Sturm, E., et al. 2013, ApJ, 776, 27 [NASA ADS] [CrossRef] [Google Scholar]
- Veilleux, S., Bolatto, A., Tombesi, F., et al. 2017, ApJ, 843, 18 [Google Scholar]
- Wagner, A. Y., & Bicknell, G. V. 2011, ApJ, 728, 29 [NASA ADS] [CrossRef] [Google Scholar]
- Wagner, A. Y., Bicknell, G. V., Umemura, M., Sutherland, R. S., & Silk, J. 2016, Astron. Nachr., 337, 167 [NASA ADS] [CrossRef] [Google Scholar]
- Walter, F., Bolatto, A. D., Leroy, A. K., et al. 2017, ApJ, 835, 265 [NASA ADS] [CrossRef] [Google Scholar]
- Weiner, B. J., Coil, A. L., Prochaska, J. X., et al. 2009, ApJ, 692, 187 [NASA ADS] [CrossRef] [Google Scholar]
- Whitaker, K. E., van Dokkum, P. G., Brammer, G., & Franx, M. 2012, ApJ, 754, L29 [NASA ADS] [CrossRef] [Google Scholar]
- Wong, T., Blitz, L., & Bosma, A. 2004, ApJ, 605, 183 [NASA ADS] [CrossRef] [Google Scholar]
- Woo, J.-H., Bae, H.-J., Son, D., & Karouzos, M. 2016, ApJ, 817, 108 [NASA ADS] [CrossRef] [Google Scholar]
- Wuyts, S., Förster Schreiber, N. M., Wisnioski, E., et al. 2016, ApJ, 831, 149 [NASA ADS] [CrossRef] [Google Scholar]
- Zhang, D., & Thompson, T. A. 2012, MNRAS, 424, 1170 [NASA ADS] [CrossRef] [Google Scholar]
- Zhang, Z.-Y., Ivison, R. J., George, R. D., et al. 2018, MNRAS, 481, 59 [NASA ADS] [CrossRef] [Google Scholar]
- Zubovas, K., & Bourne, M. A. 2017, MNRAS, 468, 4956 [NASA ADS] [CrossRef] [Google Scholar]
- Zubovas, K., & King, A. 2012, ApJ, 745, L34 [Google Scholar]
- Zubovas, K., & King, A. R. 2014, MNRAS, 439, 400 [NASA ADS] [CrossRef] [Google Scholar]
- Zubovas, K., & King, A. 2016, MNRAS, 462, 4055 [NASA ADS] [CrossRef] [Google Scholar]
Appendix A: CO(1-0) spectrum of the fast gas blob from the A+B array configuration observations
Figure A.1 shows the CO(1-0) spectrum extracted within a R = 1.5″ circular aperture centered on the second redshifted outflow component (α = 09:00:25.2, δ = +39:03:58.8) located ∼6 kpc north of the NW galaxy. The difference between the red and grey spectra is that the former is based on A+B array configuration data, while the latter is extracted in the combined A+B+C+D data, identical to that shown in Fig. 5. We confirm that the fast gas blob is detected in the A+B only data.
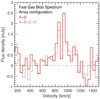 |
Fig. A.1. CO(1-0) spectrum of the outflowing gas blob located ∼6 kpc north of the NW galaxy and that is independent of the main outflow structure. In red we show the spectrum extracted from the A+B only data, while in grey we show the spectrum from the combined A+B+C+D data (which is identical to the one shown in Fig. 5). |
Appendix B: dysmalpy modeling of the kinematics
We model the 2D velocity field of the body (±400 km s−1) of IRAS F08572+3915 to constrain its dynamical mass, effective radius, and inclination using an updated version of the dynamical fitting code dysmal (Cresci et al. 2009; Davies et al. 2011; Wuyts et al. 2016; Übler et al. 2018). The code creates a three-dimensional mass model of the galaxy which is then compared to the data based on an implementation of an MCMC sampling procedure using the EMCEE package (Foreman-Mackey et al. 2013). One of the advantages of using dysmalpy is that it accounts for beam-smearing effects by convolving with the two-dimensional PSF (or beam) of the galaxy.
Free parameters in our modeling are the dynamical mass (Mdyn), the effective radius of an exponential disk (Reff), and the inclination (i). For these parameters, we chose Gaussian priors which reflect our prior knowledge about their values and uncertainties. For the dynamical mass we chose the range Mdyn = [109, 1011] M⊙ (a previous estimate of the dynamical mass derived from Hα line kinematics gave Mdyn ≈ 1010 M⊙; Arribas et al. 2014) and for the effective radius we chose the range Reff = [0.5, 1.5] kpc, based on the range of values measured from HST F814W and F160W data (García-Marín et al. 2009), which is also consistent with our CO measurement (see Table 2). From a visual inspection of the HST data, we set the boundaries for the disk inclination i prior between 20 and 60°. Fixed parameters in our modeling are the position angle and the central position of the velocity field which we set to 120° and α = 09:00:25.3, δ = +39:03:54.2, respectively, based on visual inspection.
Figure B.1 shows the CO(1-0) velocity field of IRAS F08572+3915, the velocity field extracted from the dysmalpy model cube, and the residual map. Overall, the kinematic model does a good job reproducing the bulk of the rotational motion observed in CO – the amplitude of the residual throughout a large portion of the disk is ≲15 km s−1. Near the edges, however, the model fails to capture the S-shaped pattern in the kinematics of IRAS F08572+3915, which is a signature of non-circular orbits and indicate deviations of the gravitational potential from axisymmetry or possible outflows and inflows (e.g., Roberts et al. 1979; Wong et al. 2004). This is expected as the dysmalpy model does not include any gas inflow or outflow component.
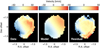 |
Fig. B.1. From left to right: CO(1-0) velocity field of IRAS F08572+3915, the best fit model from dysmalpy, and the residual map between the two. The observed motions in IRAS F08572+3915 are not purely rotational, as expected from a system that is undergoing a major interaction and host a powerful nuclear outflow. Nonetheless, the best fit velocity field from the dysmalpy code does a reasonable job reproducing the major kinematics features of IRAS F08572+3915. |
Figure B.2 shows the MCMC sampling of the joint posterior probability distributions of the model parameters (or the MCMC “corner plot”). Because the posterior distribution is well behaved, we choose our fiducial model to be represented by the median values of the individual marginalized distributions (blue lines), with uncertainties represented by the 1σ confidence ranges (dashed lines). Thus, our analysis based on the dysmalpy model suggests that  ,
,  kpc, and
  .
.
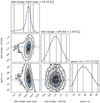 |
Fig. B.2. MCMC “corner plot” of our best-fit parametric model (see Fig. B.1). Figure shows the one- and two-dimensional projections of the posterior probability distributions of the three free parameters: the dynamical mass (Mdyn), the effective radius (Reff), and the inclination (i). The median values and 1σ confidence ranges of the marginalized distributions are indicated by the dashed lines in the 1D histograms. The median values are also shown as blue squares on top of the 2D histograms. The contours show the 1, 2, and 3σ confidence levels of the 2D distributions. |
All Tables
All Figures
|
Fig. 1. Left: HST (F814W) image of the ULIRG IRAS F08572+3915. The system is composed of a pair of interacting galaxies where the energetics are dominated by a buried AGN in the NW system (Rupke & Veilleux 2013a). The contours show continuum-subtracted CO(1-0) emission detected at a 3σ significance or above in the intensity maps integrated in the [−120,+120] km s−1 (green) and [−400,+400] km s−1 (purple) velocity range. The NOEMA synthesized beam (θ = 1.4″ × 1.13″) is illustrated in the bottom-left corner. The angular resolution achieved is a factor of ∼2 better than previous CO(1-0) observations (Cicone et al. 2014). Right: CO(1-0) spectra of the NW (top) and SE (bottom) galaxies extracted within the circular apertures shown in the left panel. This is the first time the SE component is detected in CO emission. |
| In the text | |
|
Fig. 2. Channel maps (40 km s−1 bins) showing the CO(1-0) line emission in IRAS F08572+3915 in velocity steps of 160 km s−1. The velocity of each map is printed in the lower-right corner and the NOEMA beam is shown in the top-left corner of the first panel. The green cross marks the position of the CO(1-0) peak in the NW galaxy, and the contours are placed at the 3, 5, 10 and 20σ level. Each map has its own color scale to make both bright and faint features visible, so we include the corresponding colorbar in the top of each panel in units of mJy beam−1. We observe that the outflow is aligned with the kinematic major axis of the disk (roughly going from the southeast to the northwest), and that the second redshifted outflow component is brightest around 900 km s−1. |
| In the text | |
|
Fig. 3. Top: continuum-subtracted CO(1-0) spectrum extracted within a circular aperture of 5″ diameter centered on the NW galaxy. Strong broad wings of CO(1-0) line emission indicative of a molecular outflow are detected with velocities up to ±1200 km s−1. Bottom: integrated CO(1-0) line emission integrated in the blue ([ − 400, −1200] km s−1) and red ([ + 400, +1200] km s−1) wings and the red gas blob ([ + 700, +1100] km s−1) overplotted on a HST (F814W) image. The NOEMA synthesized beam is shown in the bottom-left corner. Contours correspond to 3, 5, and 10σ for the blue and red wings, and 3, 5, and 7σ for the red gas blob. An extranuclear component of the red wing is detected approximately ∼6 kpc north (projected distance) of the NW galaxy moving at ∼ + 900 km s−1, but decelerating (see Fig. 4). |
| In the text | |
|
Fig. 4. Integrated intensity (left column), velocity (center column), and dispersion (right column) maps for the NW galaxy (top row), the blue wing (center row), and the two red wing components (bottom row). Only regions with > 3σ detections are shown. The green cross marks the position of the CO(1-0) peak in the NW galaxy. Contours correspond to 3, 5, 10 and 20σ, where σ for each map is listed in Table 2. The NOEMA beam is shown in the bottom-left corner of the first panel. |
| In the text | |
|
Fig. 5. Left: channel maps showing the CO(1-0) line emission of the “gas blob” (RA 9:00:25.26, Dec +39:03:58.9) located ∼6 kpc north of the main galaxy. The NOEMA beam is shown in the top-left corner of the first panel. The contours show the 2.5σ (dashed line) and 3, 4, 5 and 6σ (solid lines) levels of emission. Right: CO(1-0) spectrum extracted from a circular region with a radius of 1.5″ centered around the “gas blob.” |
| In the text | |
|
Fig. 6. Multiphase structure of the outflow in IRAS F08572+3915, including the cold molecular wind as traced by the CO(1-0) line (this work; blue and red contours), and the warm molecular (H2), atomic (Na I D), and ionized winds (Hα) as reported by Rupke & Veilleux (2013a). The black cross marks the position of the CO(1-0) peak in the NW galaxy. The observed range of velocities in the winds is listed next to each outflow component. Absorption by the galaxy’s disk is probably the reason that the redshifted outflow is only detected in CO. |
| In the text | |
|
Fig. 7. Outflow mass (top) and mass loading factor η (bottom) for different gas phases of the outflow, including molecular (as traced by CO and OH), ionized (Hα) and atomic phases (Na I D), and most likely a combination of the three as traced by [C II]. For the sum of the phases (last column) we consider the molecular phase as traced by the CO line emission. We caution the reader that these measurements are affected by a series of assumptions on the physical conditions of the gas and geometry that can have a significant impact on the final value. The results for IRAS F08572+3915 are shown with a thick gray line. For comparison, outflow properties of other major merger, infrared luminous systems such as Mrk 231 (dashed line), Mrk 273 (solid line), and IRAS F10565+2448 are also shown (Rupke & Veilleux 2013a; Veilleux et al. 2013; Cicone et al. 2014; Janssen et al. 2016; González-Alfonso et al. 2017). |
| In the text | |
|
Fig. 8. Molecular gas depletion timescale (in Myr) due to gas consumption by star formation activity (tdep, SF = Mmol/SFR; abscissa) and gas removal by the outflow (tdep,out = Mmol/Ṁout,mol; ordinate). IRAS F08572+3915 is shown as a star, and other (U)LIRGs taken from the literature are shown as circles (Pereira-Santaella et al. 2018; Fluetsch et al. 2019). The points are color-coded according to the escape fraction fesc, defined as the mass fraction of the molecular gas in the outflow that can escape the gravitational potential of its host. Diagonal line represents tdep, SF = tdep, out or, equivalently, a mass loading factor of η = 1. Vertical lines show where the data points would move if we calculate the depletion time based on the rate of molecular gas ejected by the outflow that can escape the gravitational potential of its host (i.e., Ṁesc,mol = fesc × Ṁout,mol). |
| In the text | |
|
Fig. A.1. CO(1-0) spectrum of the outflowing gas blob located ∼6 kpc north of the NW galaxy and that is independent of the main outflow structure. In red we show the spectrum extracted from the A+B only data, while in grey we show the spectrum from the combined A+B+C+D data (which is identical to the one shown in Fig. 5). |
| In the text | |
|
Fig. B.1. From left to right: CO(1-0) velocity field of IRAS F08572+3915, the best fit model from dysmalpy, and the residual map between the two. The observed motions in IRAS F08572+3915 are not purely rotational, as expected from a system that is undergoing a major interaction and host a powerful nuclear outflow. Nonetheless, the best fit velocity field from the dysmalpy code does a reasonable job reproducing the major kinematics features of IRAS F08572+3915. |
| In the text | |
|
Fig. B.2. MCMC “corner plot” of our best-fit parametric model (see Fig. B.1). Figure shows the one- and two-dimensional projections of the posterior probability distributions of the three free parameters: the dynamical mass (Mdyn), the effective radius (Reff), and the inclination (i). The median values and 1σ confidence ranges of the marginalized distributions are indicated by the dashed lines in the 1D histograms. The median values are also shown as blue squares on top of the 2D histograms. The contours show the 1, 2, and 3σ confidence levels of the 2D distributions. |
| In the text | |
Current usage metrics show cumulative count of Article Views (full-text article views including HTML views, PDF and ePub downloads, according to the available data) and Abstracts Views on Vision4Press platform.
Data correspond to usage on the plateform after 2015. The current usage metrics is available 48-96 hours after online publication and is updated daily on week days.
Initial download of the metrics may take a while.